Basics of R in Dataiku DSS
In this tutorial, we will show you how to:
Integrate R as part of your data pipeline through code recipes
Use Jupyter notebooks to prototype and test code
Transfer a Dataiku dataset into an R dataframe and back, using the
dataikuR package
We will work with the fictional retailer Haiku T-Shirt’s data.
Prerequisites
This tutorial assumes that you are familiar with the Basics courses.
Technical Requirements
Access to a Dataiku DSS instance that has the R integration installed.
Create Your Project
The first step is to create a new Dataiku DSS Project.
From the Dataiku homepage, click +New Project > DSS Tutorials > Code > R in Dataiku (Tutorial).
Click on Go to Flow.
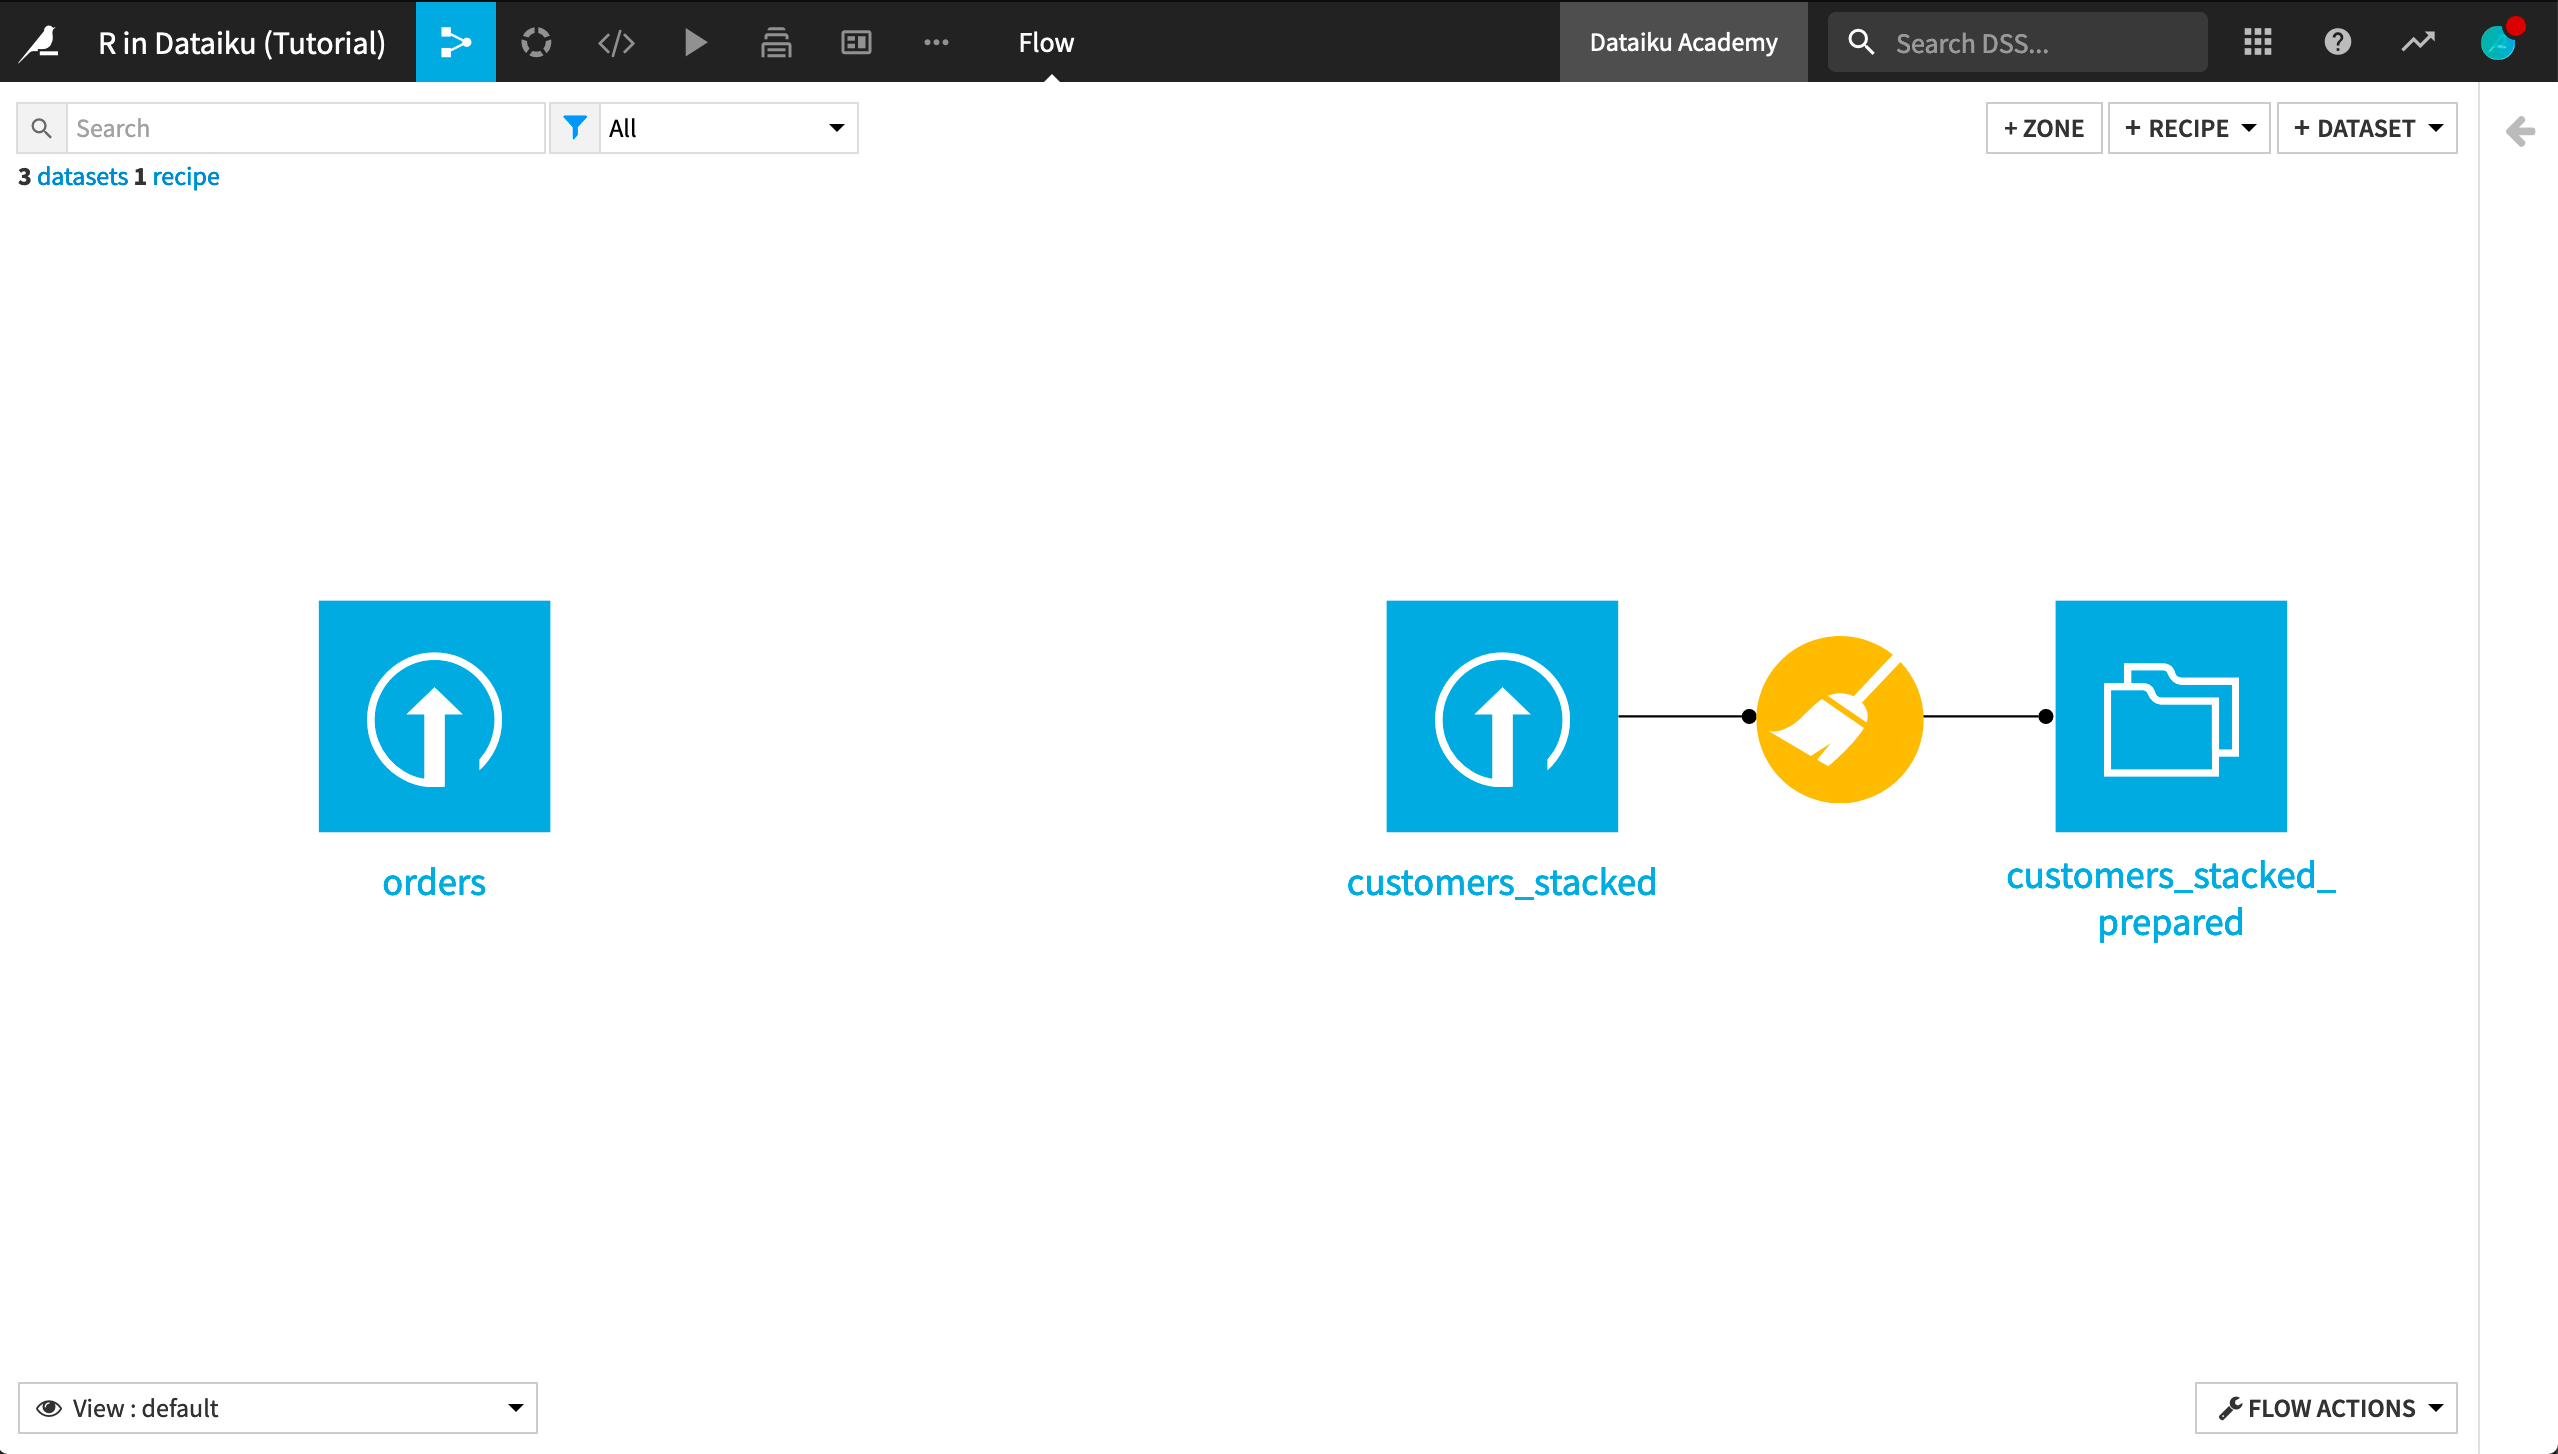
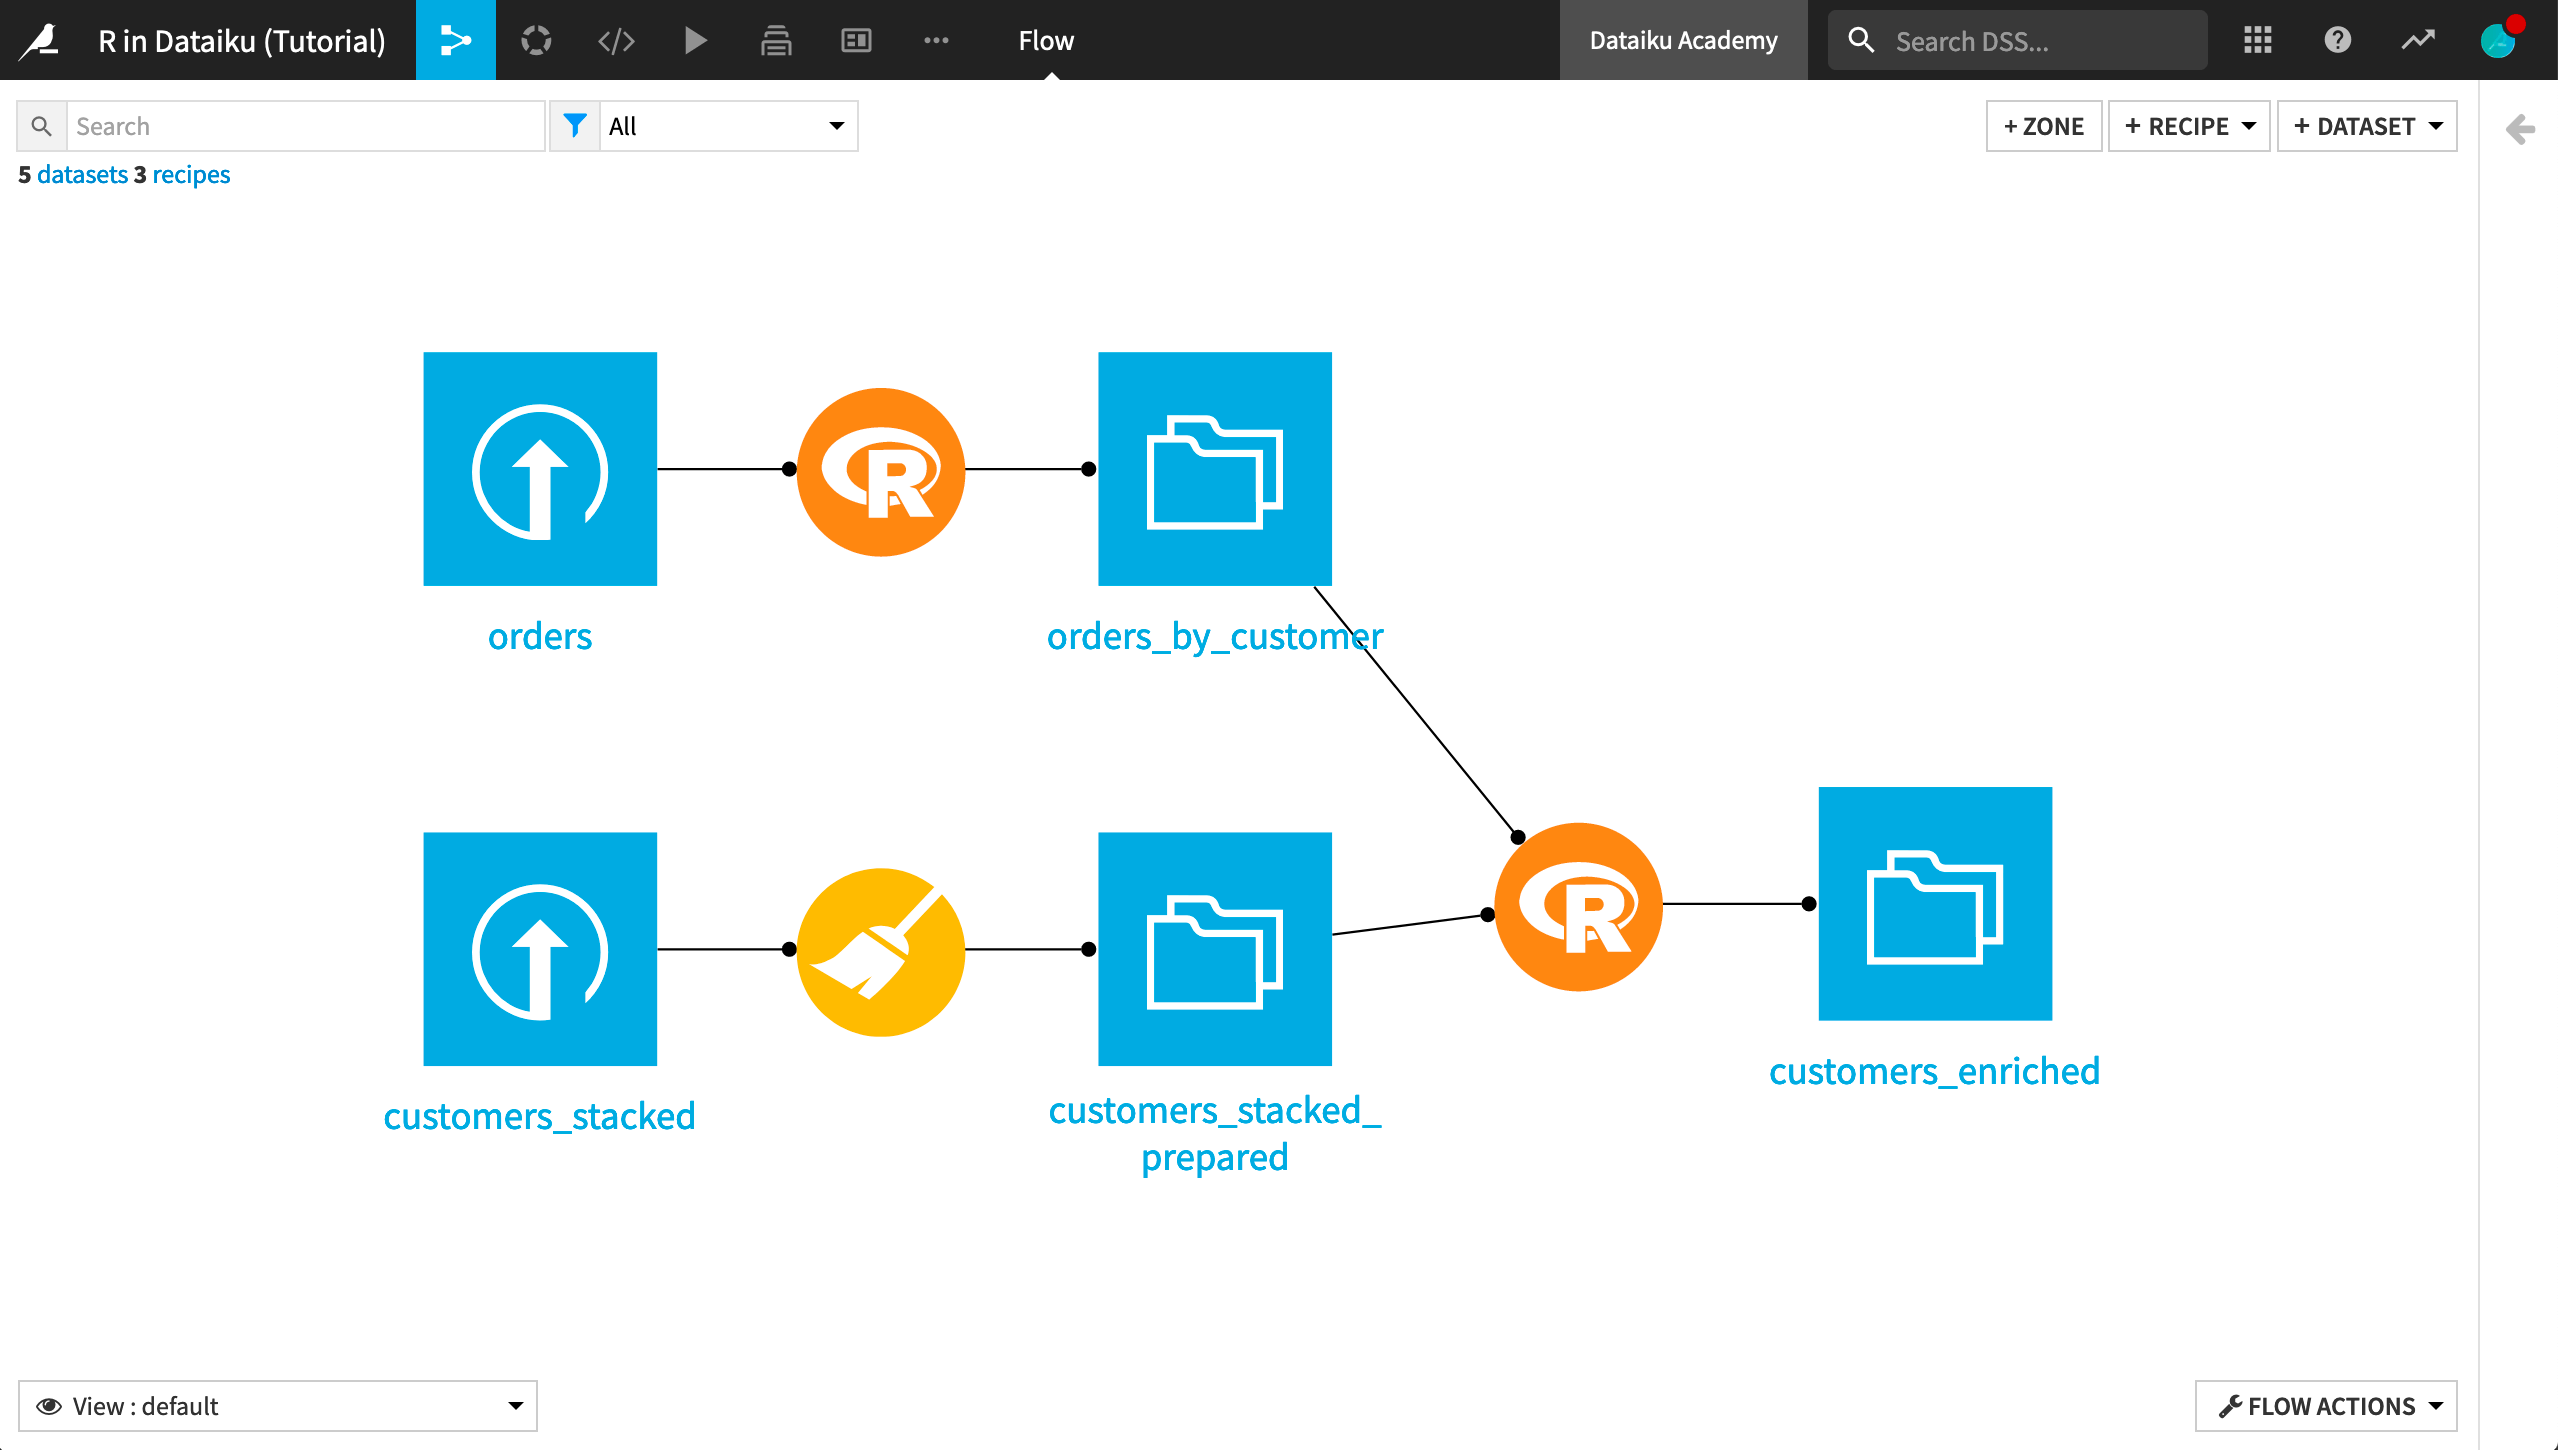
In the Flow, you see the Haiku T-Shirt orders and customers_stacked data uploaded into Dataiku DSS. Further, the customers_stacked data has been prepared with a visual Prepare recipe.
Your First R Recipe
Our current goal is to group past orders by customer, aggregating their past interactions. In the Basics courses, we accomplished this with a visual Group recipe, but it can also be easily accomplished with R code.
With the orders dataset selected, choose Actions > Code Recipes > R.
Add a new output dataset named
orders_by_customer.Click Create Recipe.
The recipe is now populated with the following code, which reads the orders dataset into an R dataframe named orders, passes it unchanged to a new dataframe named orders_by_customer, and writes that new dataframe out to the orders_by_customer dataset.
library(dataiku)

# Recipe inputs
orders <- dkuReadDataset("orders", samplingMethod="head", nbRows=100000)

# Compute recipe outputs from inputs
# TODO: Replace this part by your actual code that computes the output, as a R dataframe or data table
orders_by_customer <- orders # For this sample code, simply copy input to output


# Recipe outputs
dkuWriteDataset(orders_by_customer,"orders_by_customer")
As the commented TODO says, we’ll need to provide the code that aggregates the orders by customer. Dataiku DSS provides a number of code samples to help get us started.
Search for “Group By” in the code samples.
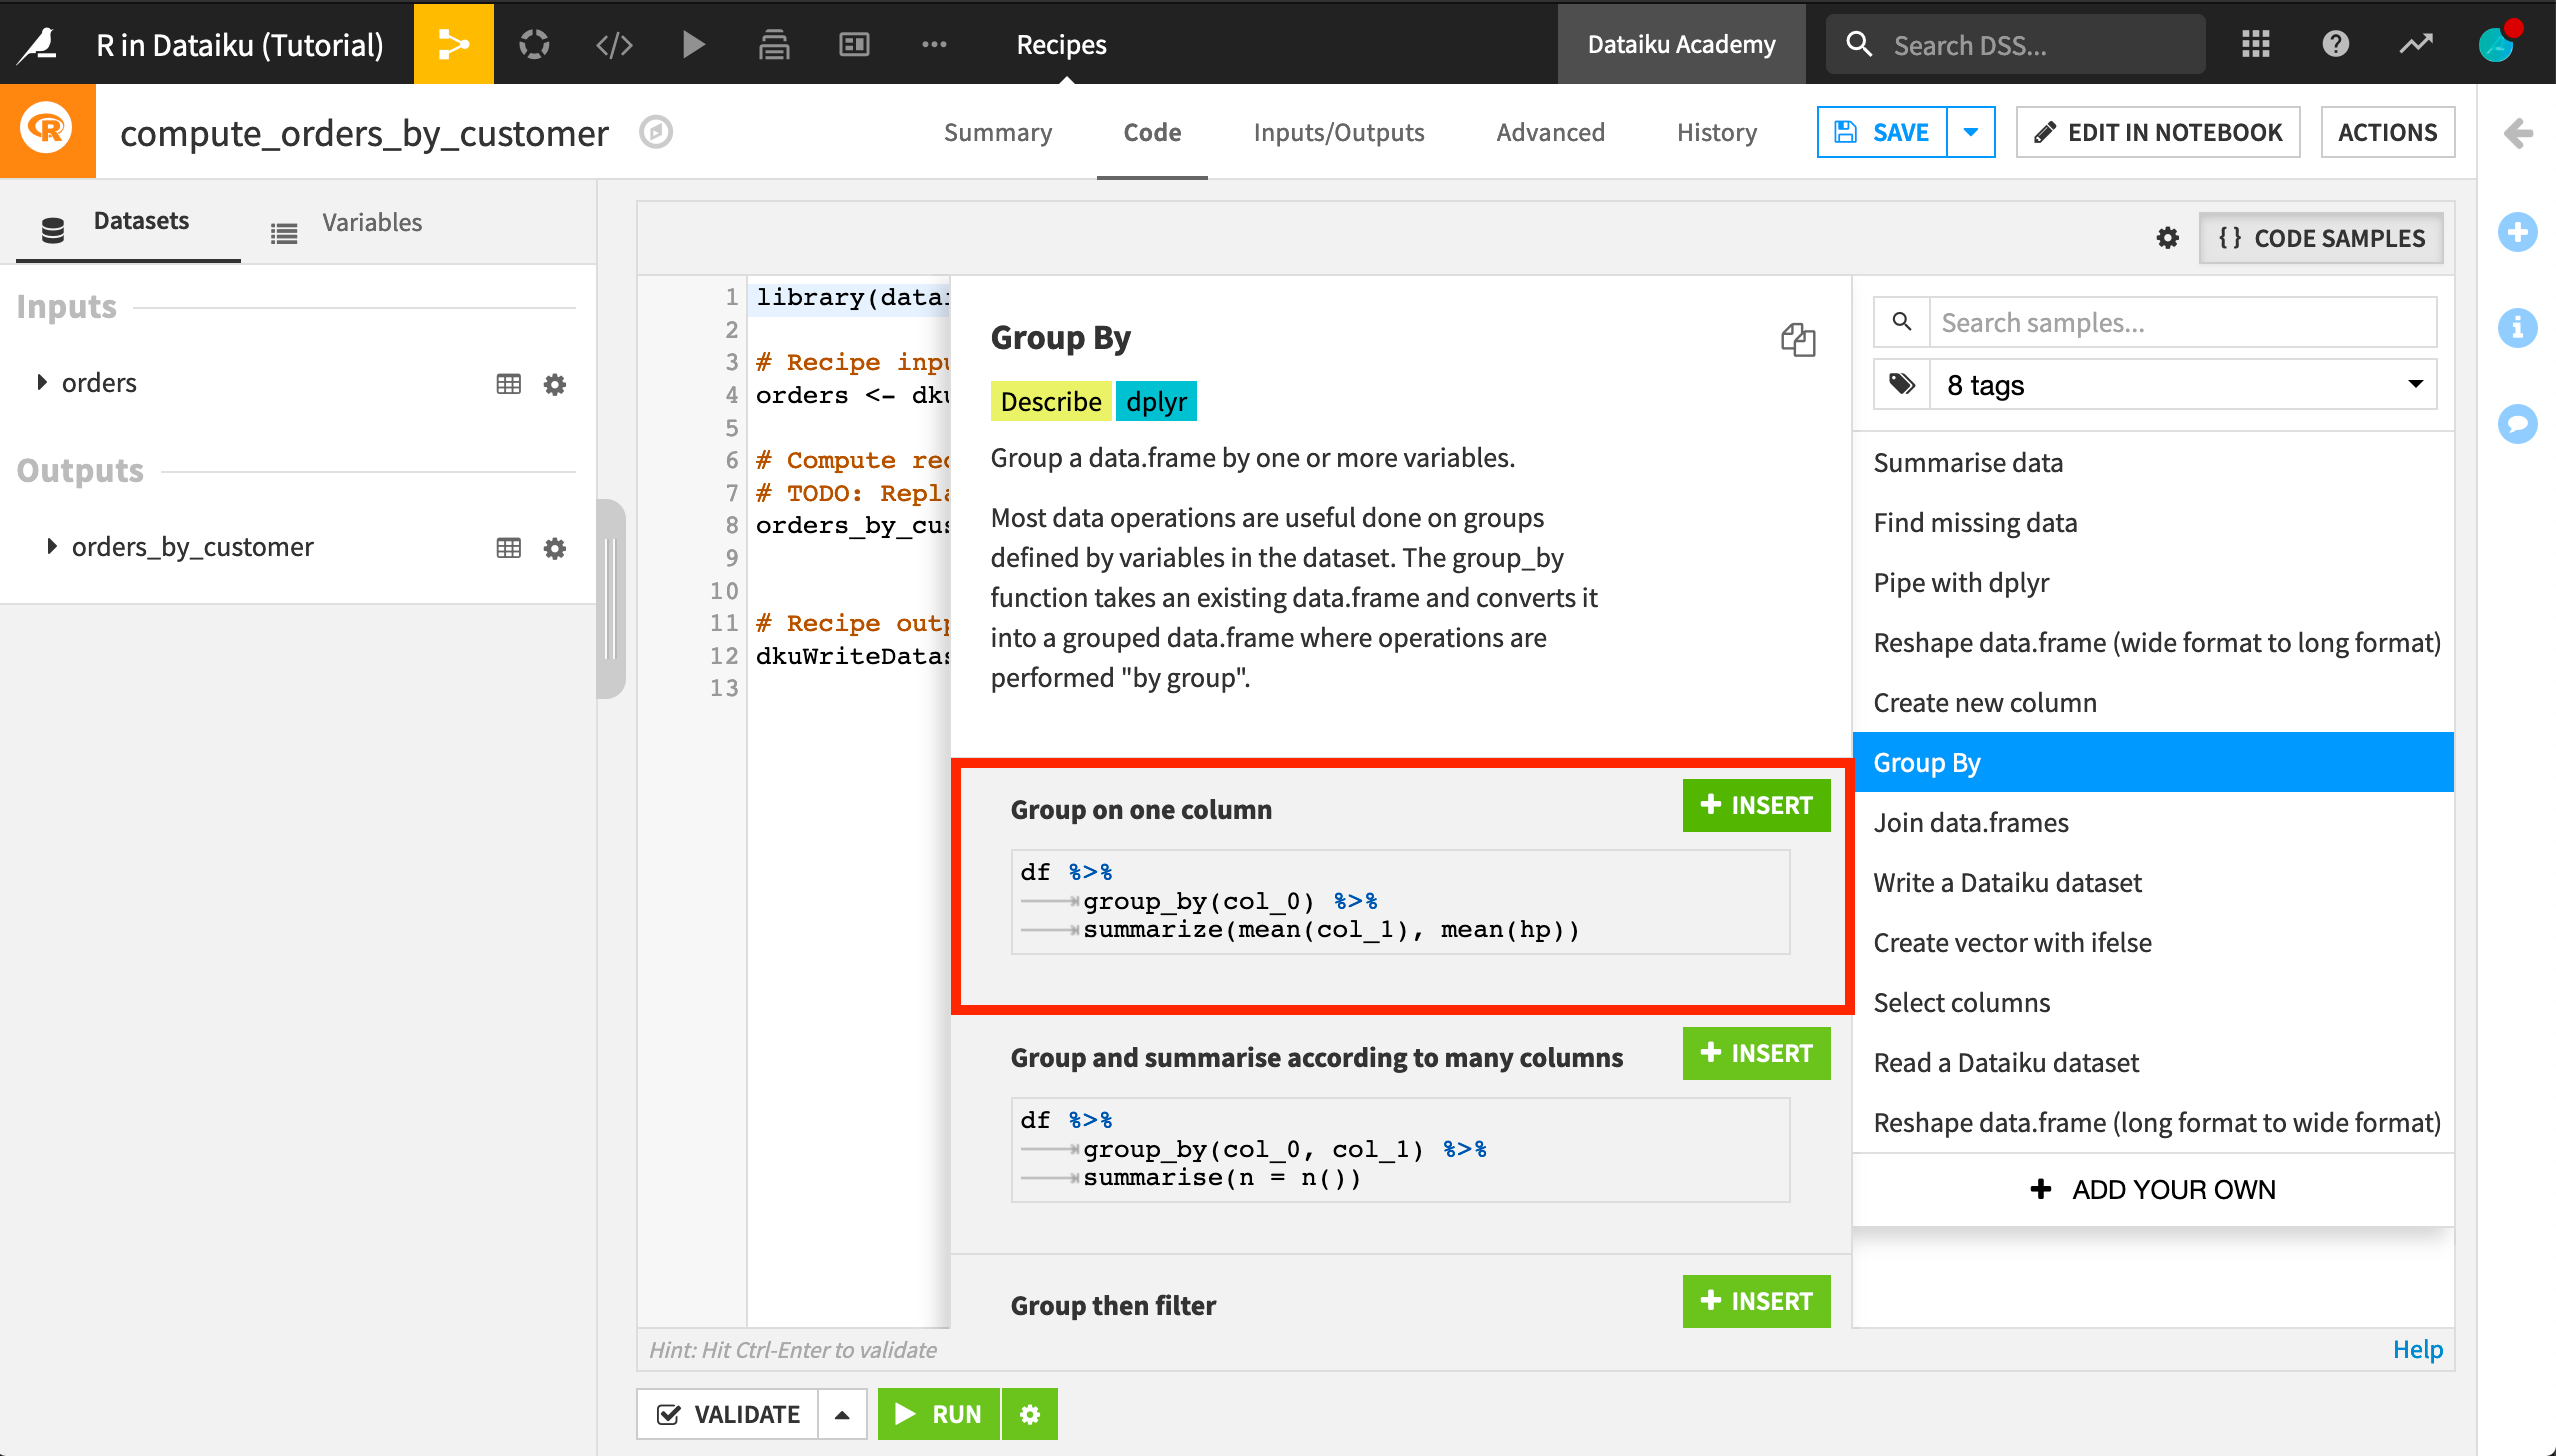
Click +Insert on the “Group on one column” sample to replace the line where
orders_by_customeris defined.Edit the code to apply to our data:
orders %>%
  group_by(customer_id) %>%
  summarize(mean(pages_visited), sum(tshirt_quantity*tshirt_price)) ->
  orders_by_customer
This creates a dataframe named orders_by_customer with rows grouped by customer_id. For each customer, we’ve computed the average number of pages on the Haiku T-shirt website visited by the customer during orders, and the sum total of the value of orders made by the customer, where the value of each order is the price of each t-shirt multiplied by the number of t-shirts purchased.
An important thing to note about this code is that it uses functions from the dplyr package.
Add a
library(dplyr)statement at the top of the recipe.Run the recipe and explore the output dataset.
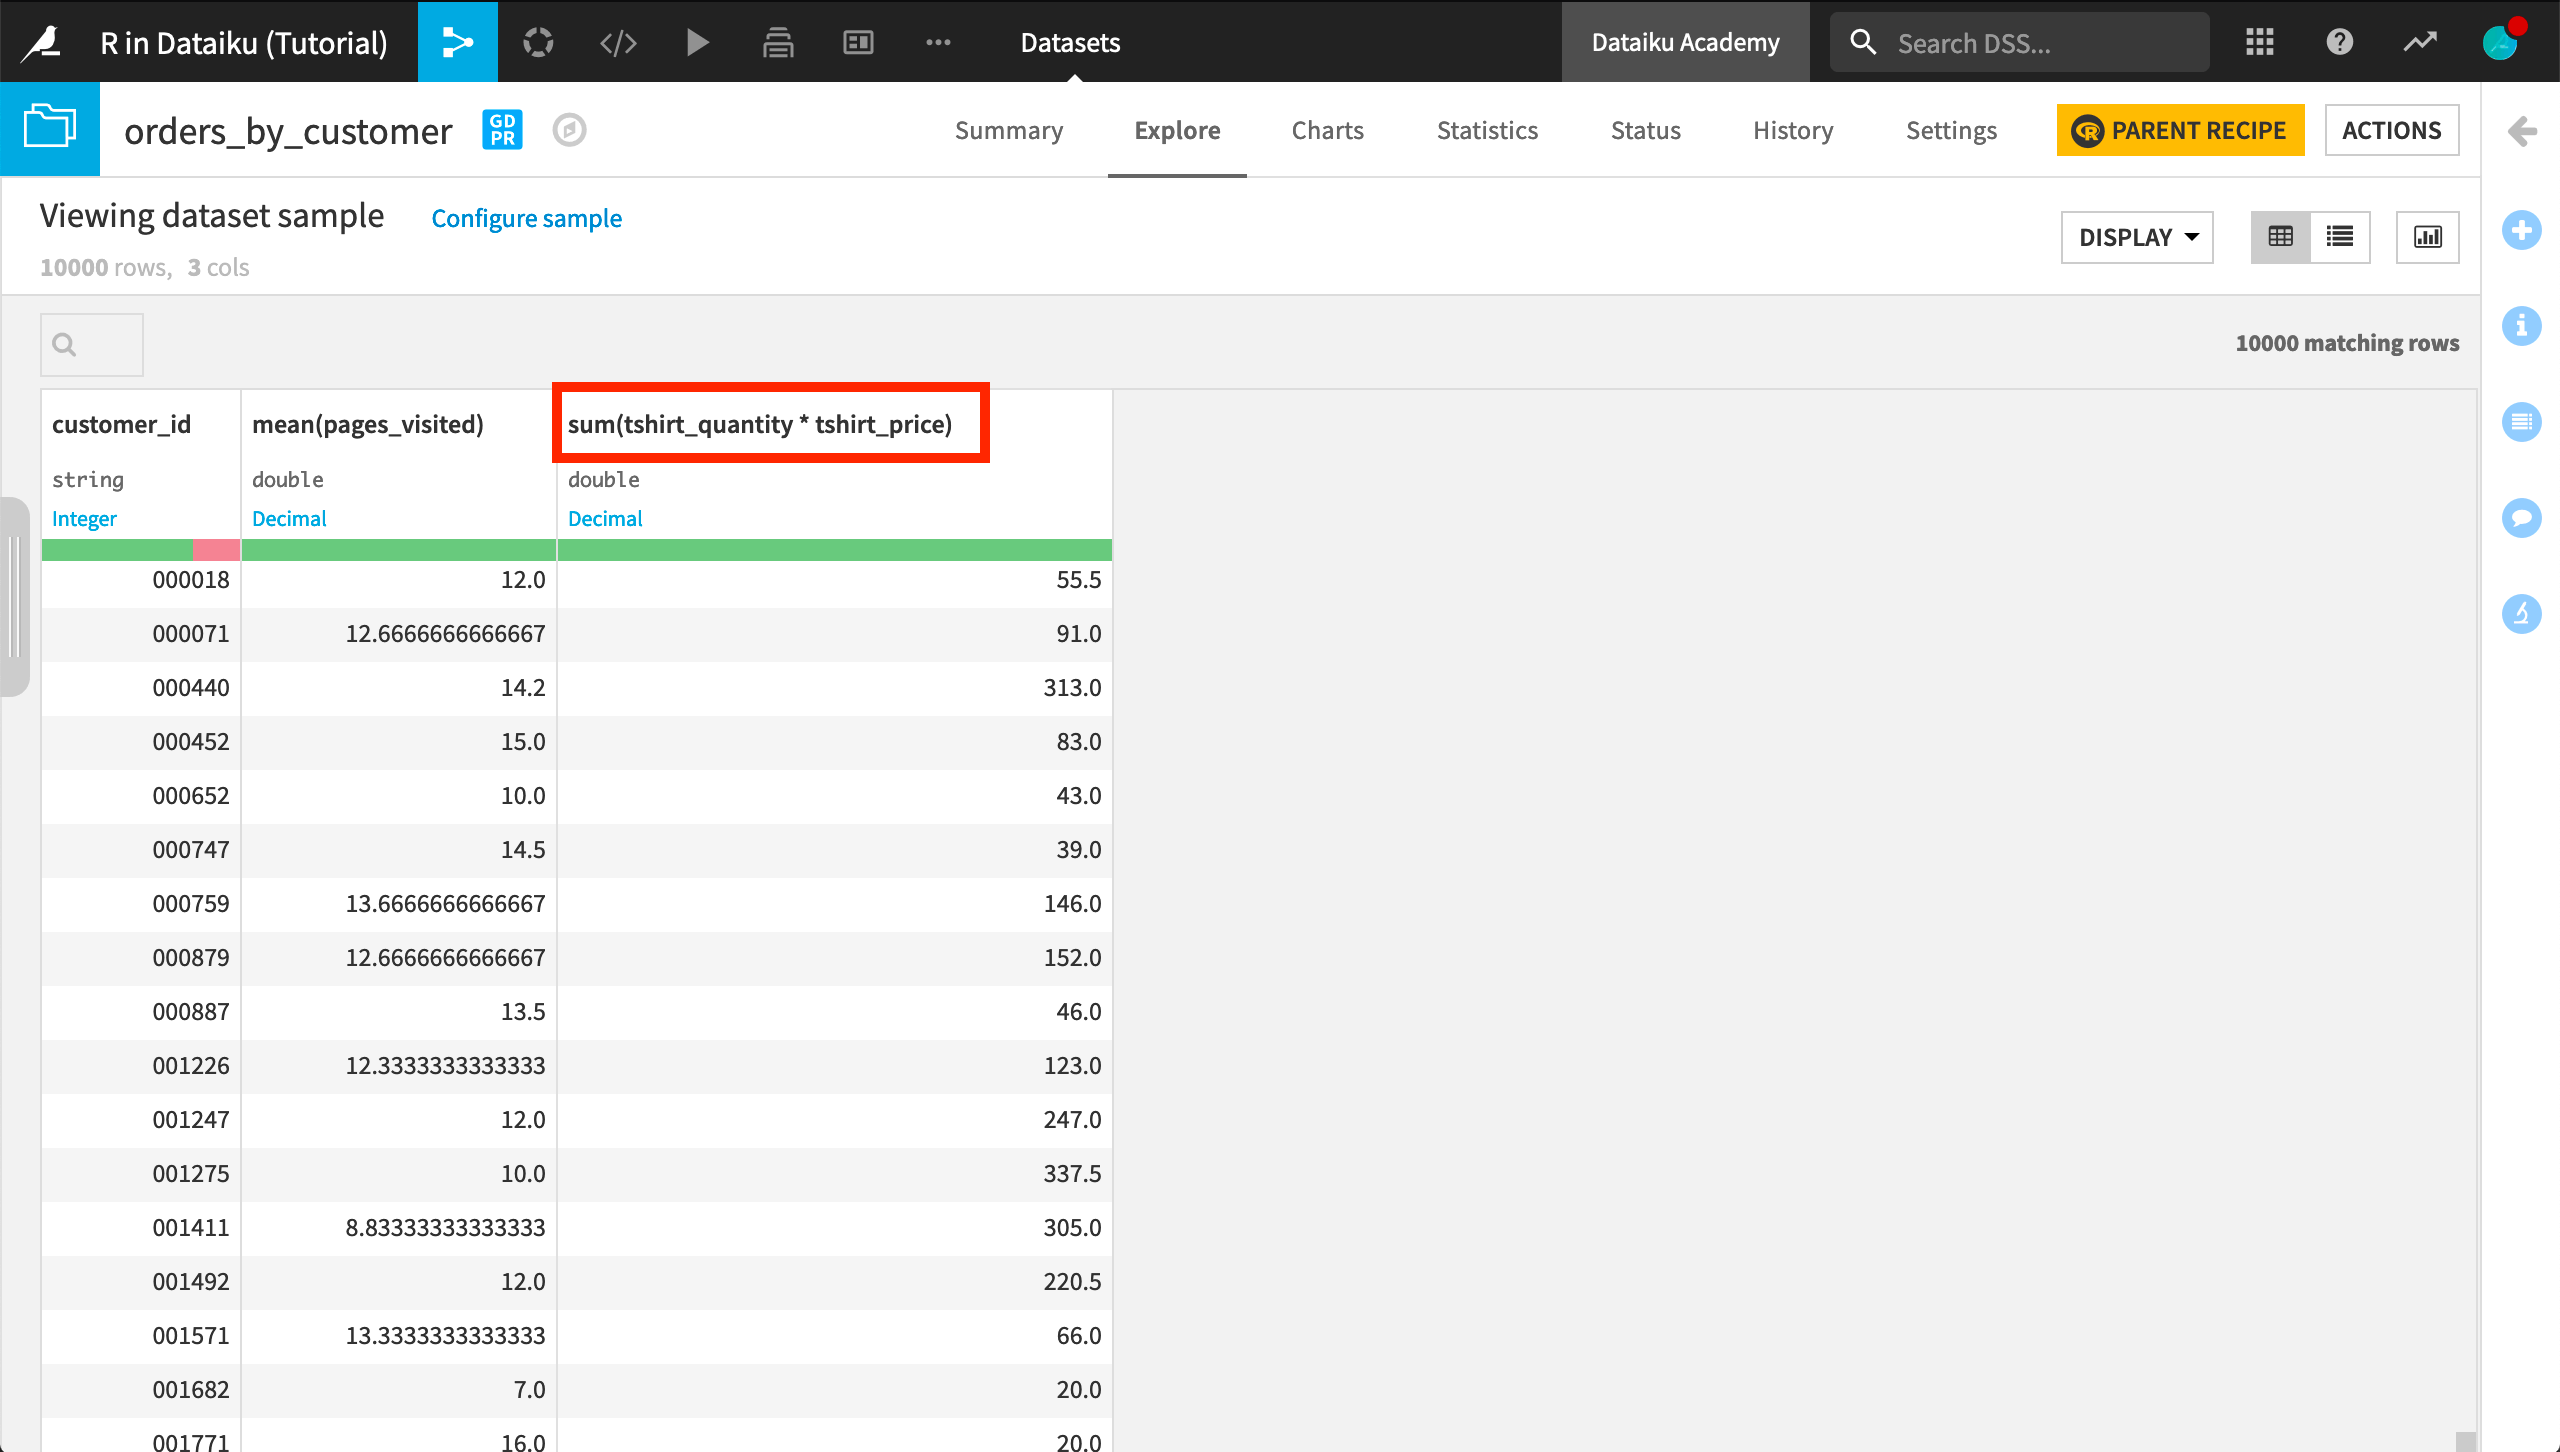
The names for the computed columns are descriptive, but sum(tshirt_quantity * tshirt_price) could be simplified to total. Let’s fix this.
Click Parent Recipe in the orders_by_customer dataset to reopen the recipe.
Click Edit in Notebook to open a Jupyter notebook where we can interactively test the recipe code.
The recipe code begins in a single cell.
Split the cell so that the code to write recipe outputs is in a separate cell.
Add a cell between the two existing cells, and put the following code in it.
head(orders_by_customer)
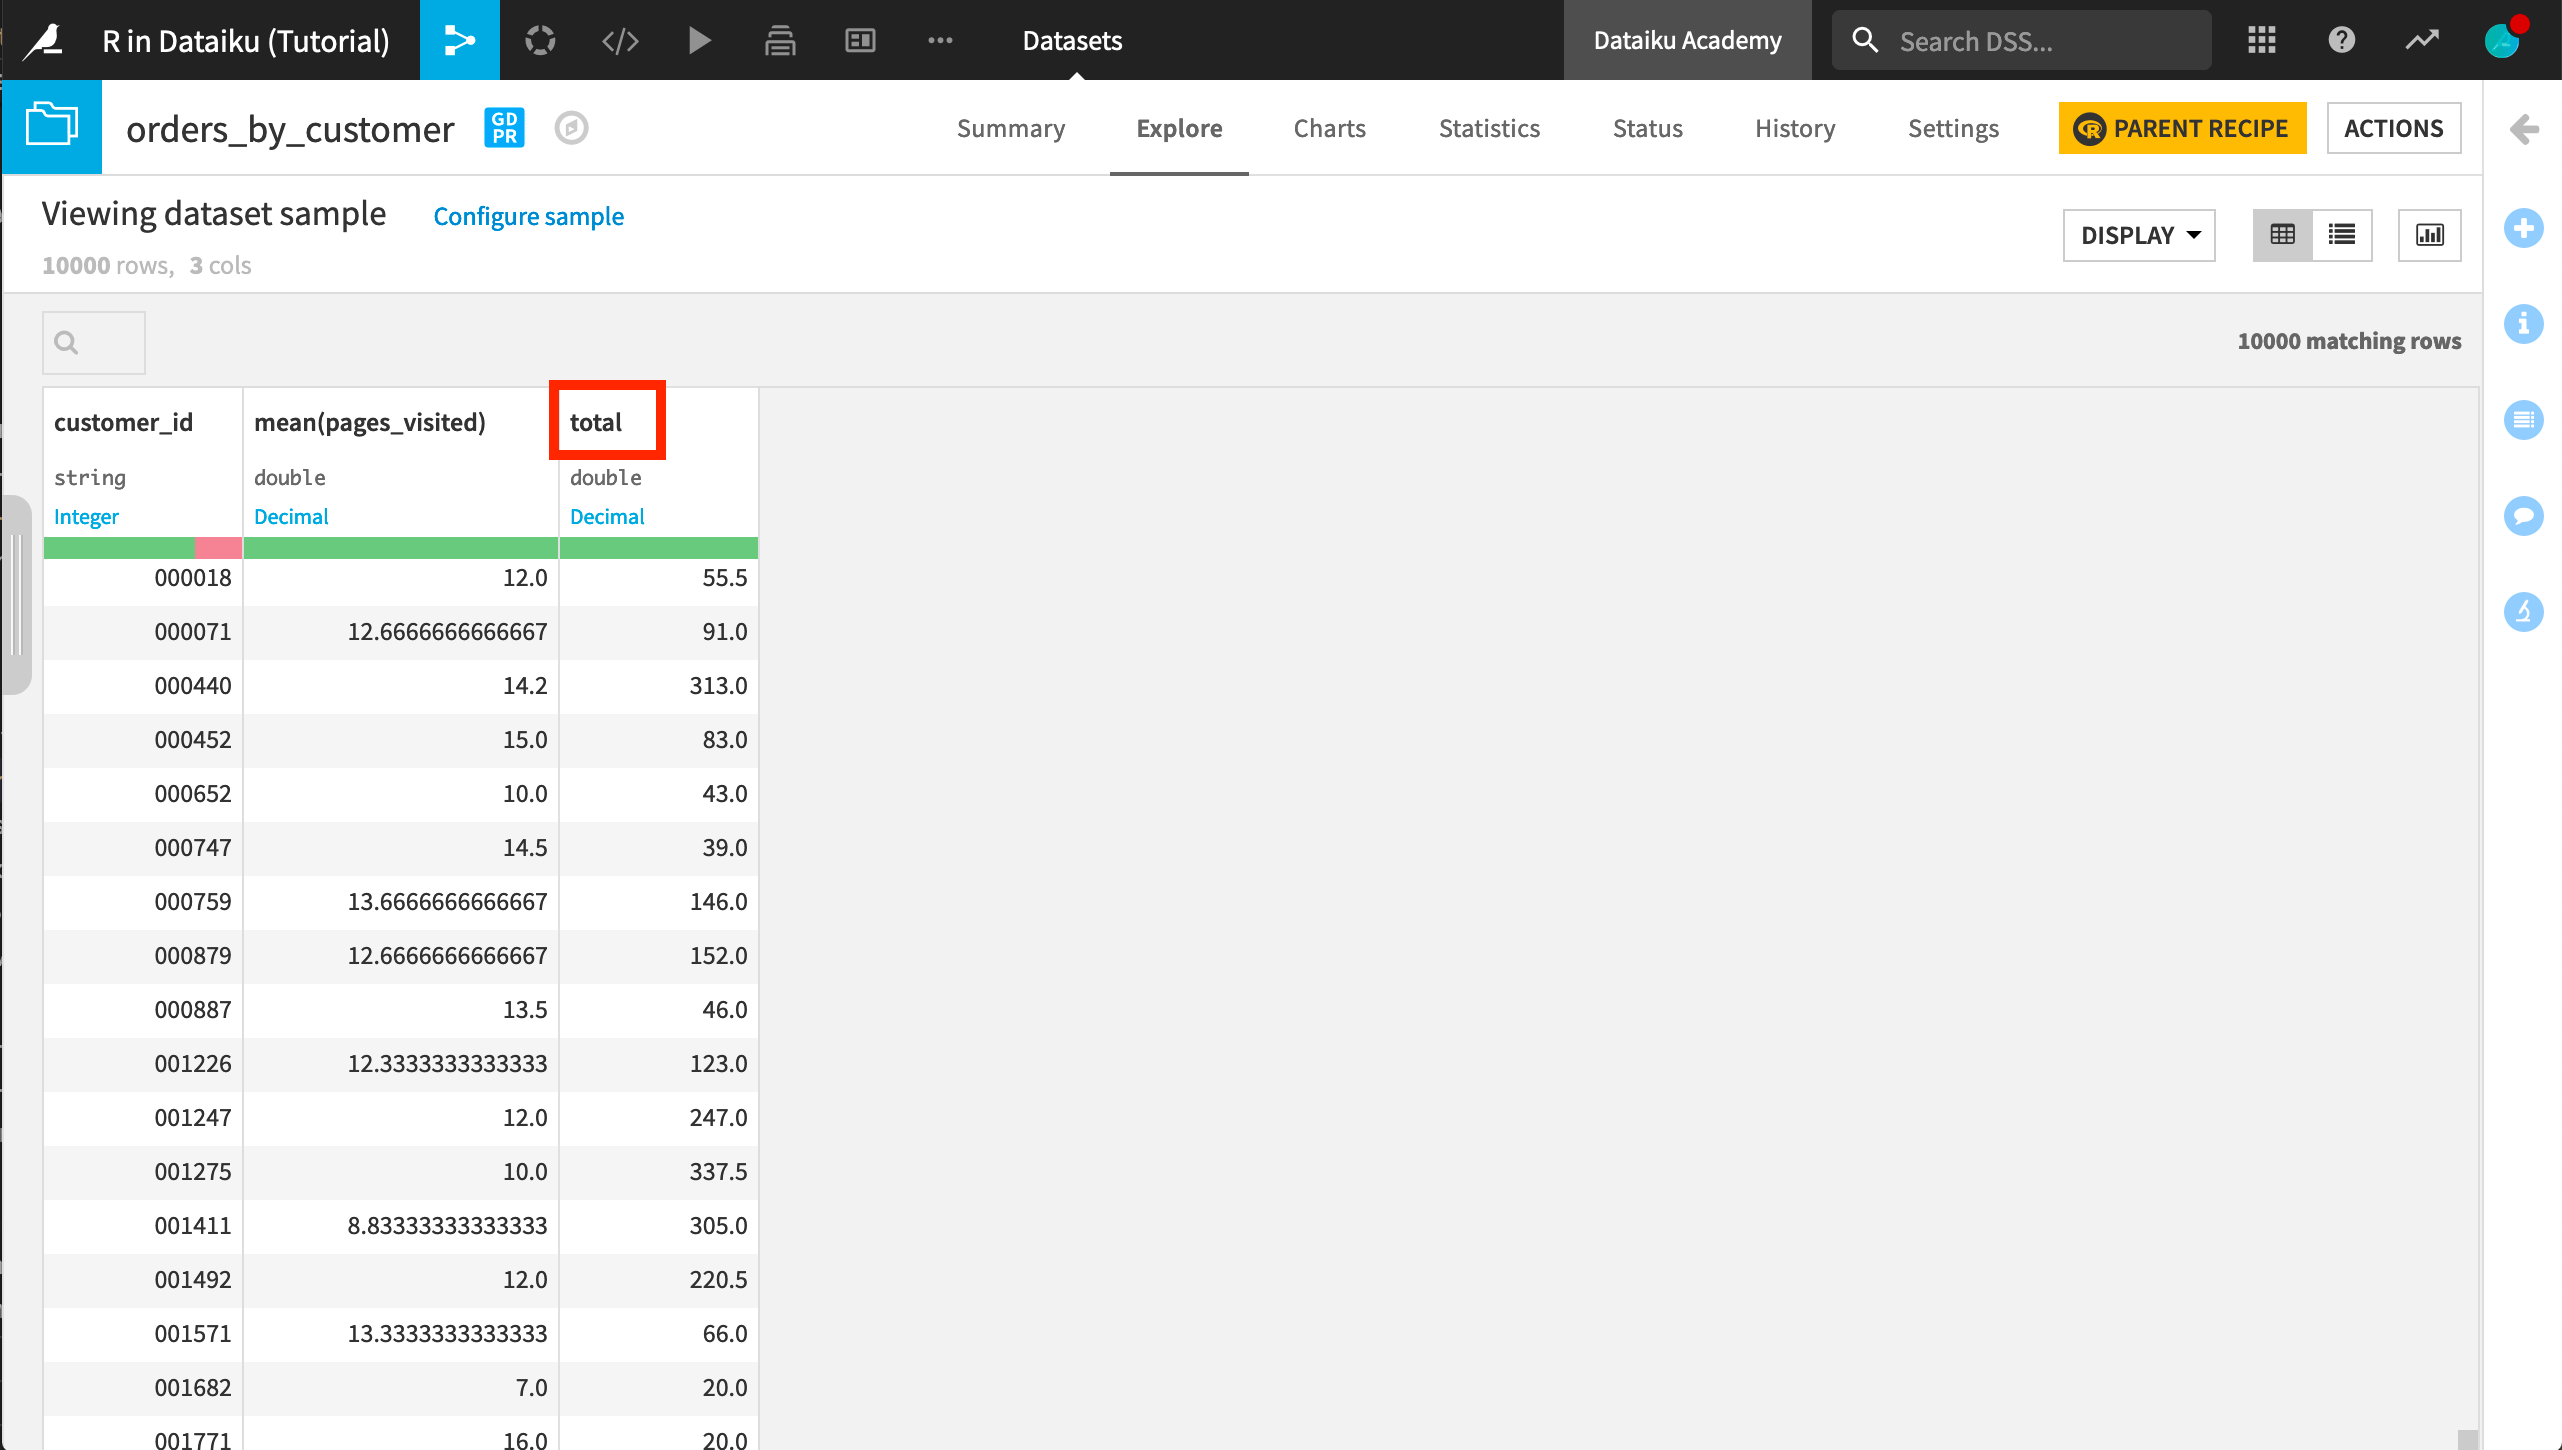
In order to change the name of the computed column, add
total=to the code that defines the dataframe so that it looks like the following.
orders %>%
  group_by(customer_id) %>%
  summarize(mean(pages_visited), total=sum(tshirt_quantity*tshirt_price)) ->
  orders_by_customer
Run the first two cells in the notebook to verify the new column name
Then click Save Back to Recipe and run the recipe again.
Now the output dataset contains a total column.
Explore with an R Notebook
Previously, we started with an R recipe because we had a specific goal of transforming the orders dataset. If we don’t have a dataset transformation goal in mind, we can explore the data using a notebook.
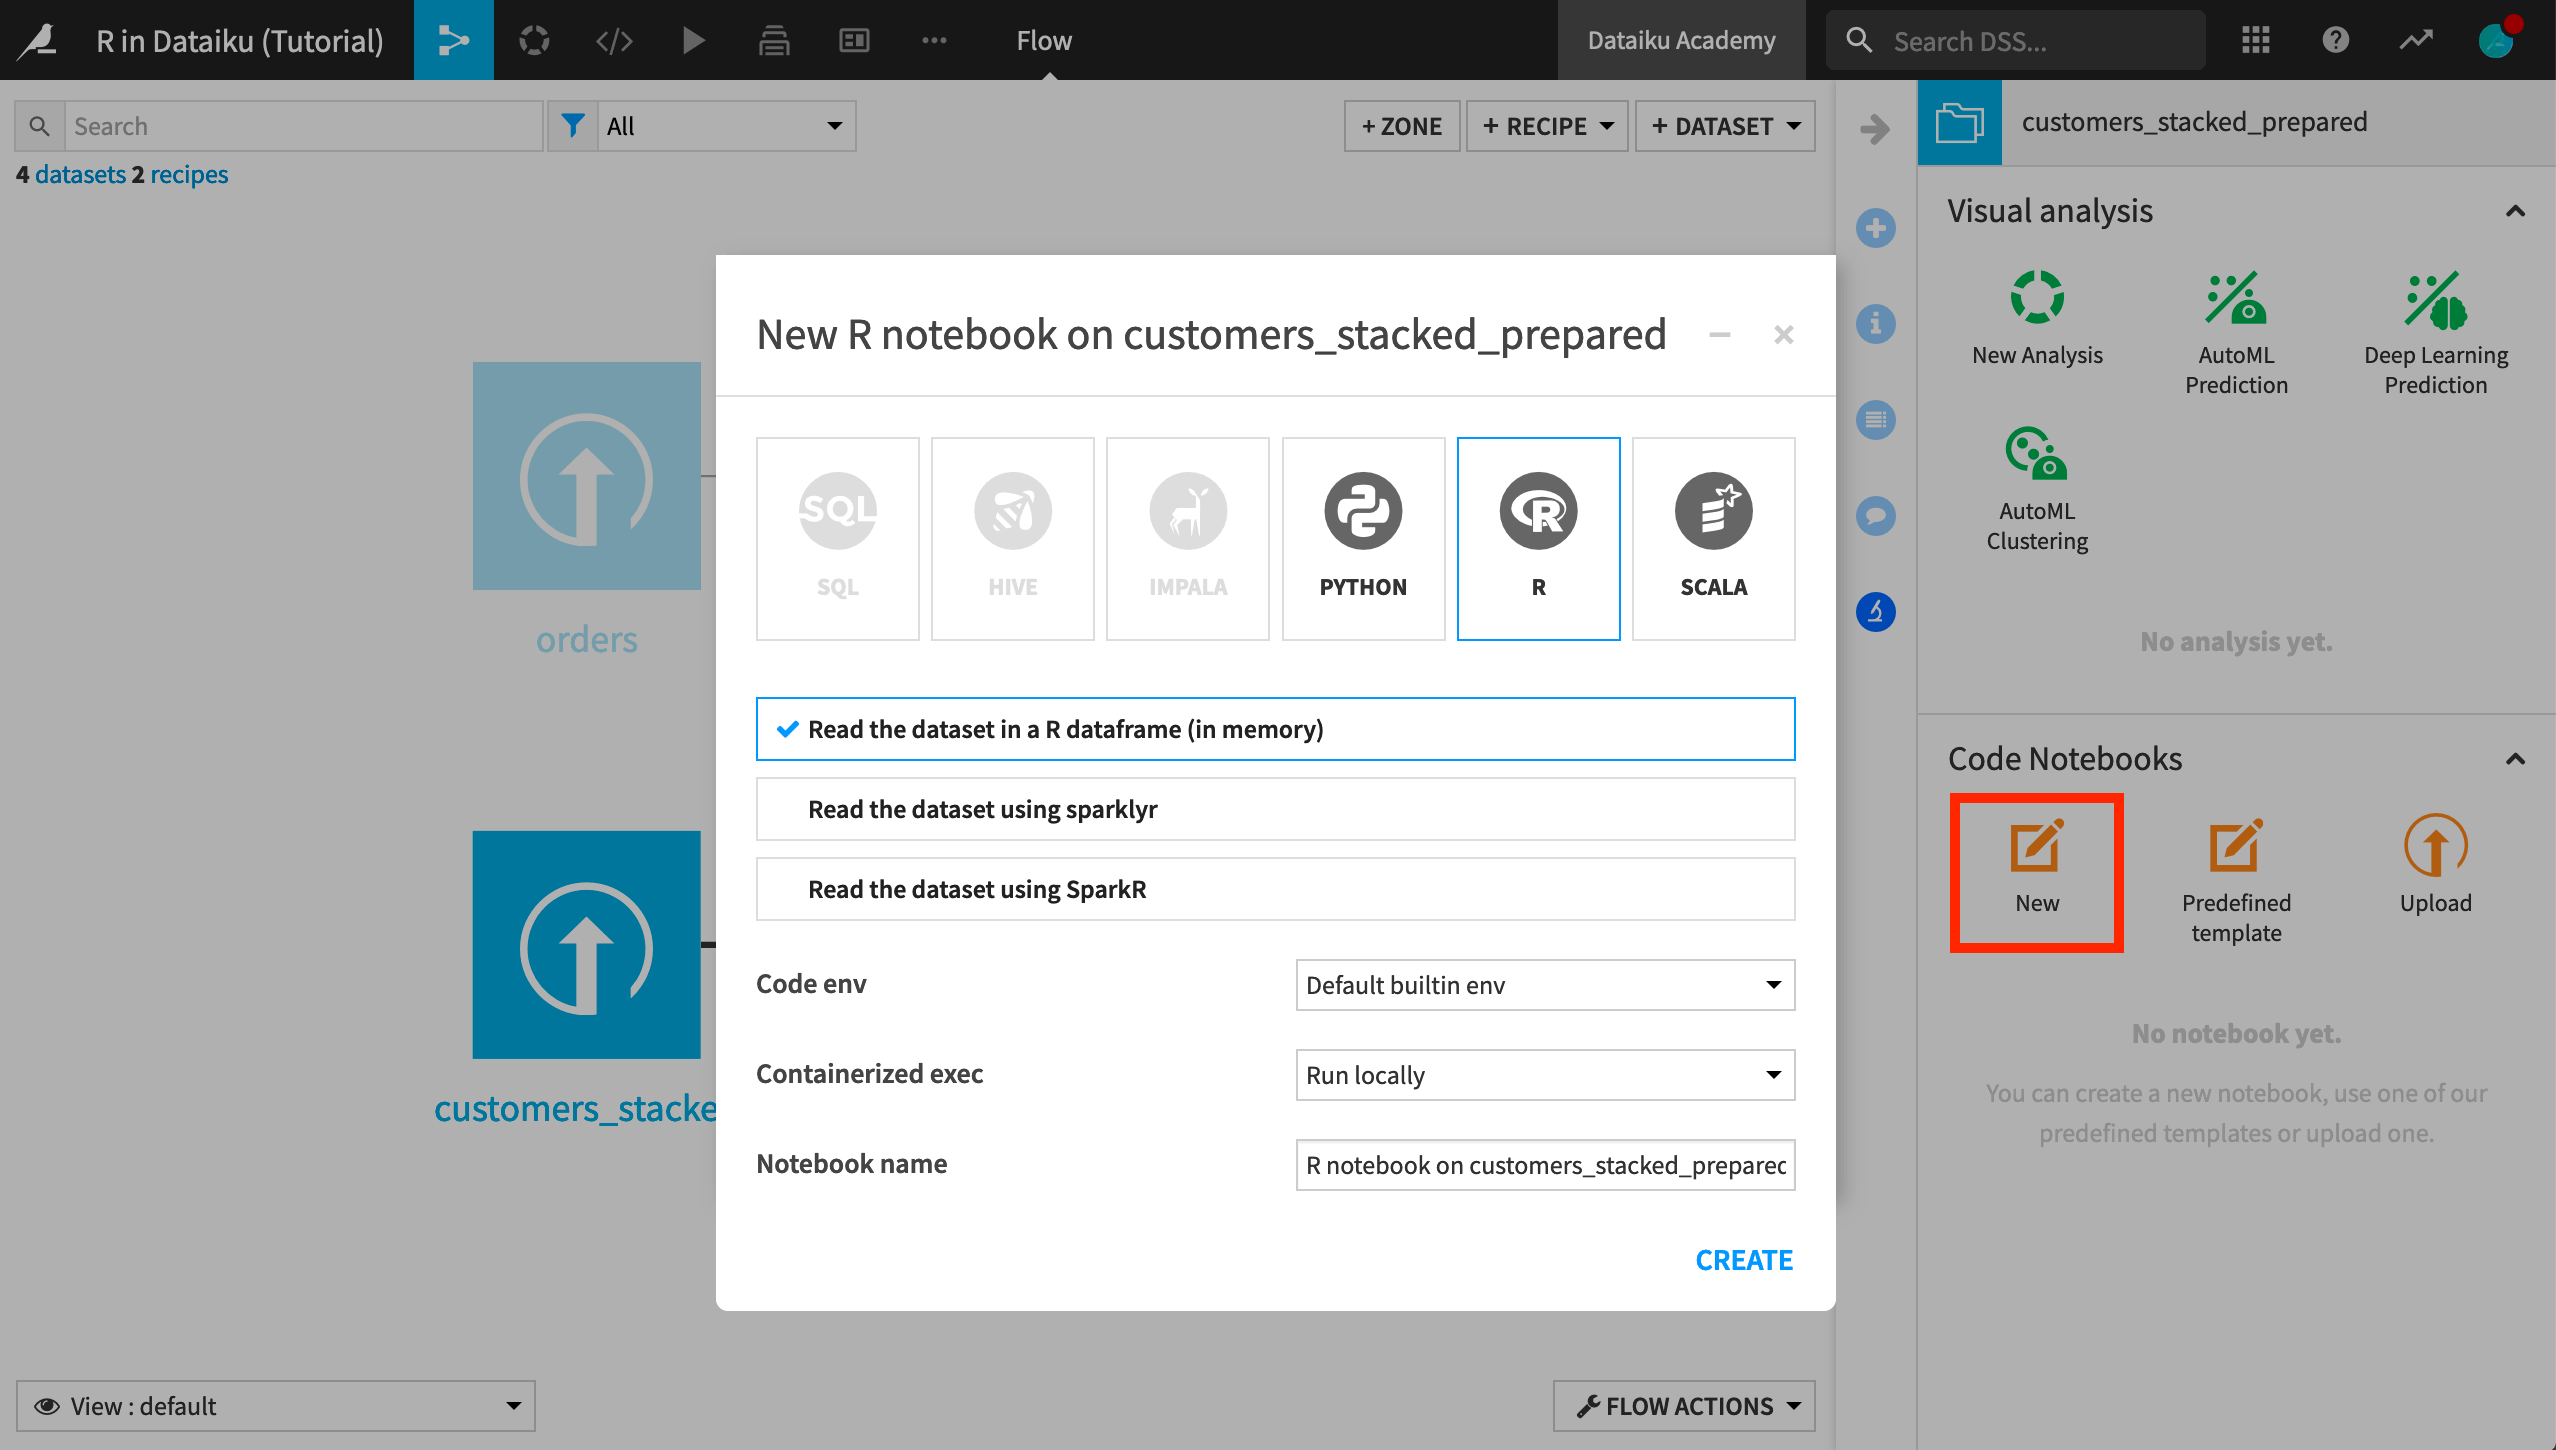
Select the customer_stacked_prepared dataset.
Click Lab > New Code Notebook > R.
Read the dataset in an R dataframe; click Create.
The notebook is automatically populated with two cells.
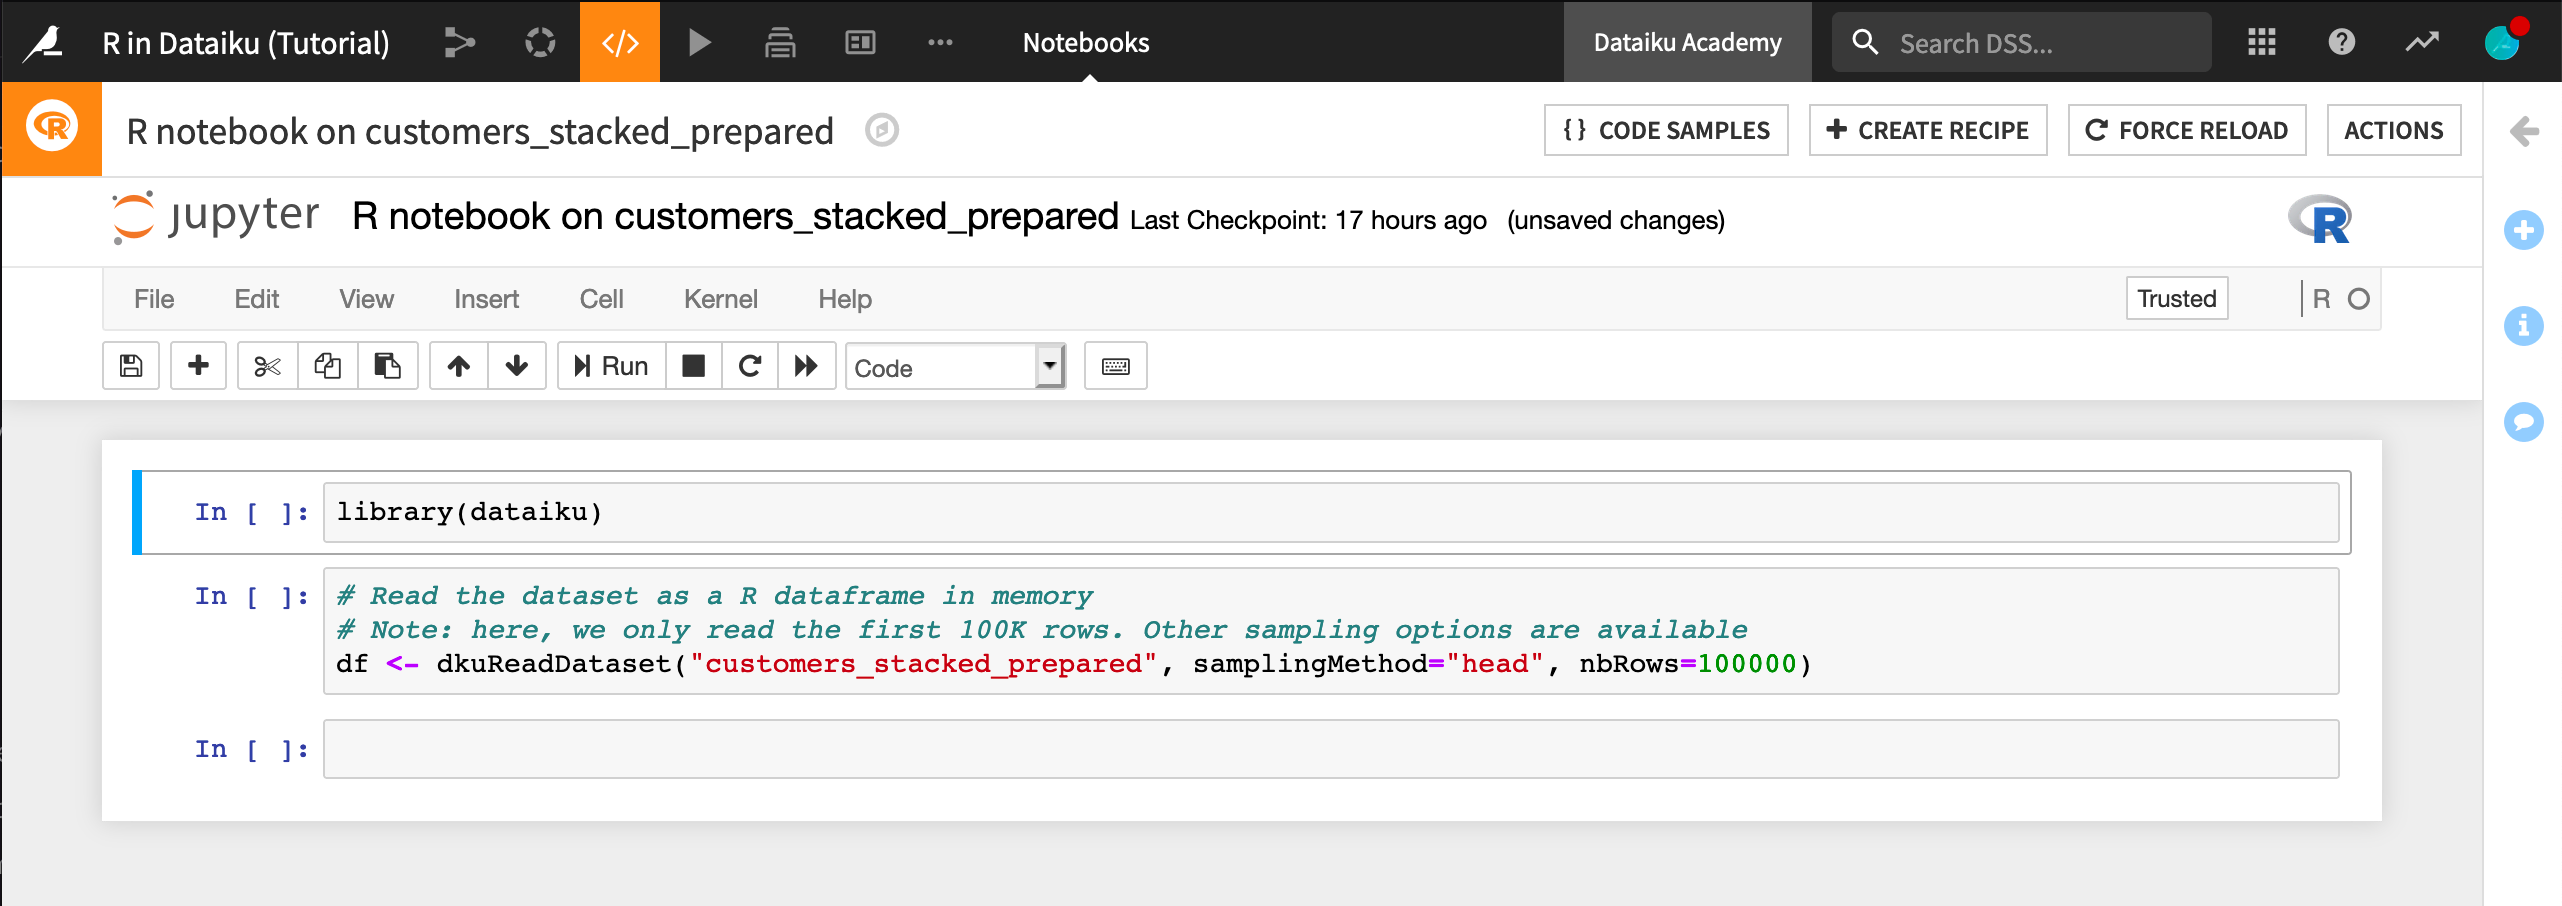
The first cell imports the dataiku package.
library(dataiku)
The second cell reads the customers_stacked_prepared dataset into a dataframe named df.
# Read the dataset as a R dataframe in memory
# Note: here, we only read the first 100K rows. Other sampling options are available
df <- dkuReadDataset("customers_stacked_prepared", samplingMethod="head", nbRows=100000)
Run each of the cells in order.
Note
The notebook now has the dataframe df ready in memory.
Copy and then run the following code in a new cell in the notebook.
library(dplyr)
count(df, campaign)
It returns the number of customers who are part of the marketing campaign and the number who aren’t.
Now we’d like to visualize the effect of campaign on the total amount a customer has spent. Since that information is in the orders_by_customer dataset, we’ll need to read that dataset into a new dataframe.
In a new cell, copy and run the following code.
df_orders <- dkuReadDataset("orders_by_customer")
Now join it with the df dataframe. As in the R recipe, Dataiku DSS provides helpful code samples.
Add a new cell.
Search the code samples for
Join data.frames.Copy the code for Conduct a left-join between two data.frames to the notebook cell.
Modify it to apply to our data like the code below.
Run the cell.
    df %>%
left_join(df_orders, by = c("customerID" = "customer_id")) ->
customers_enriched
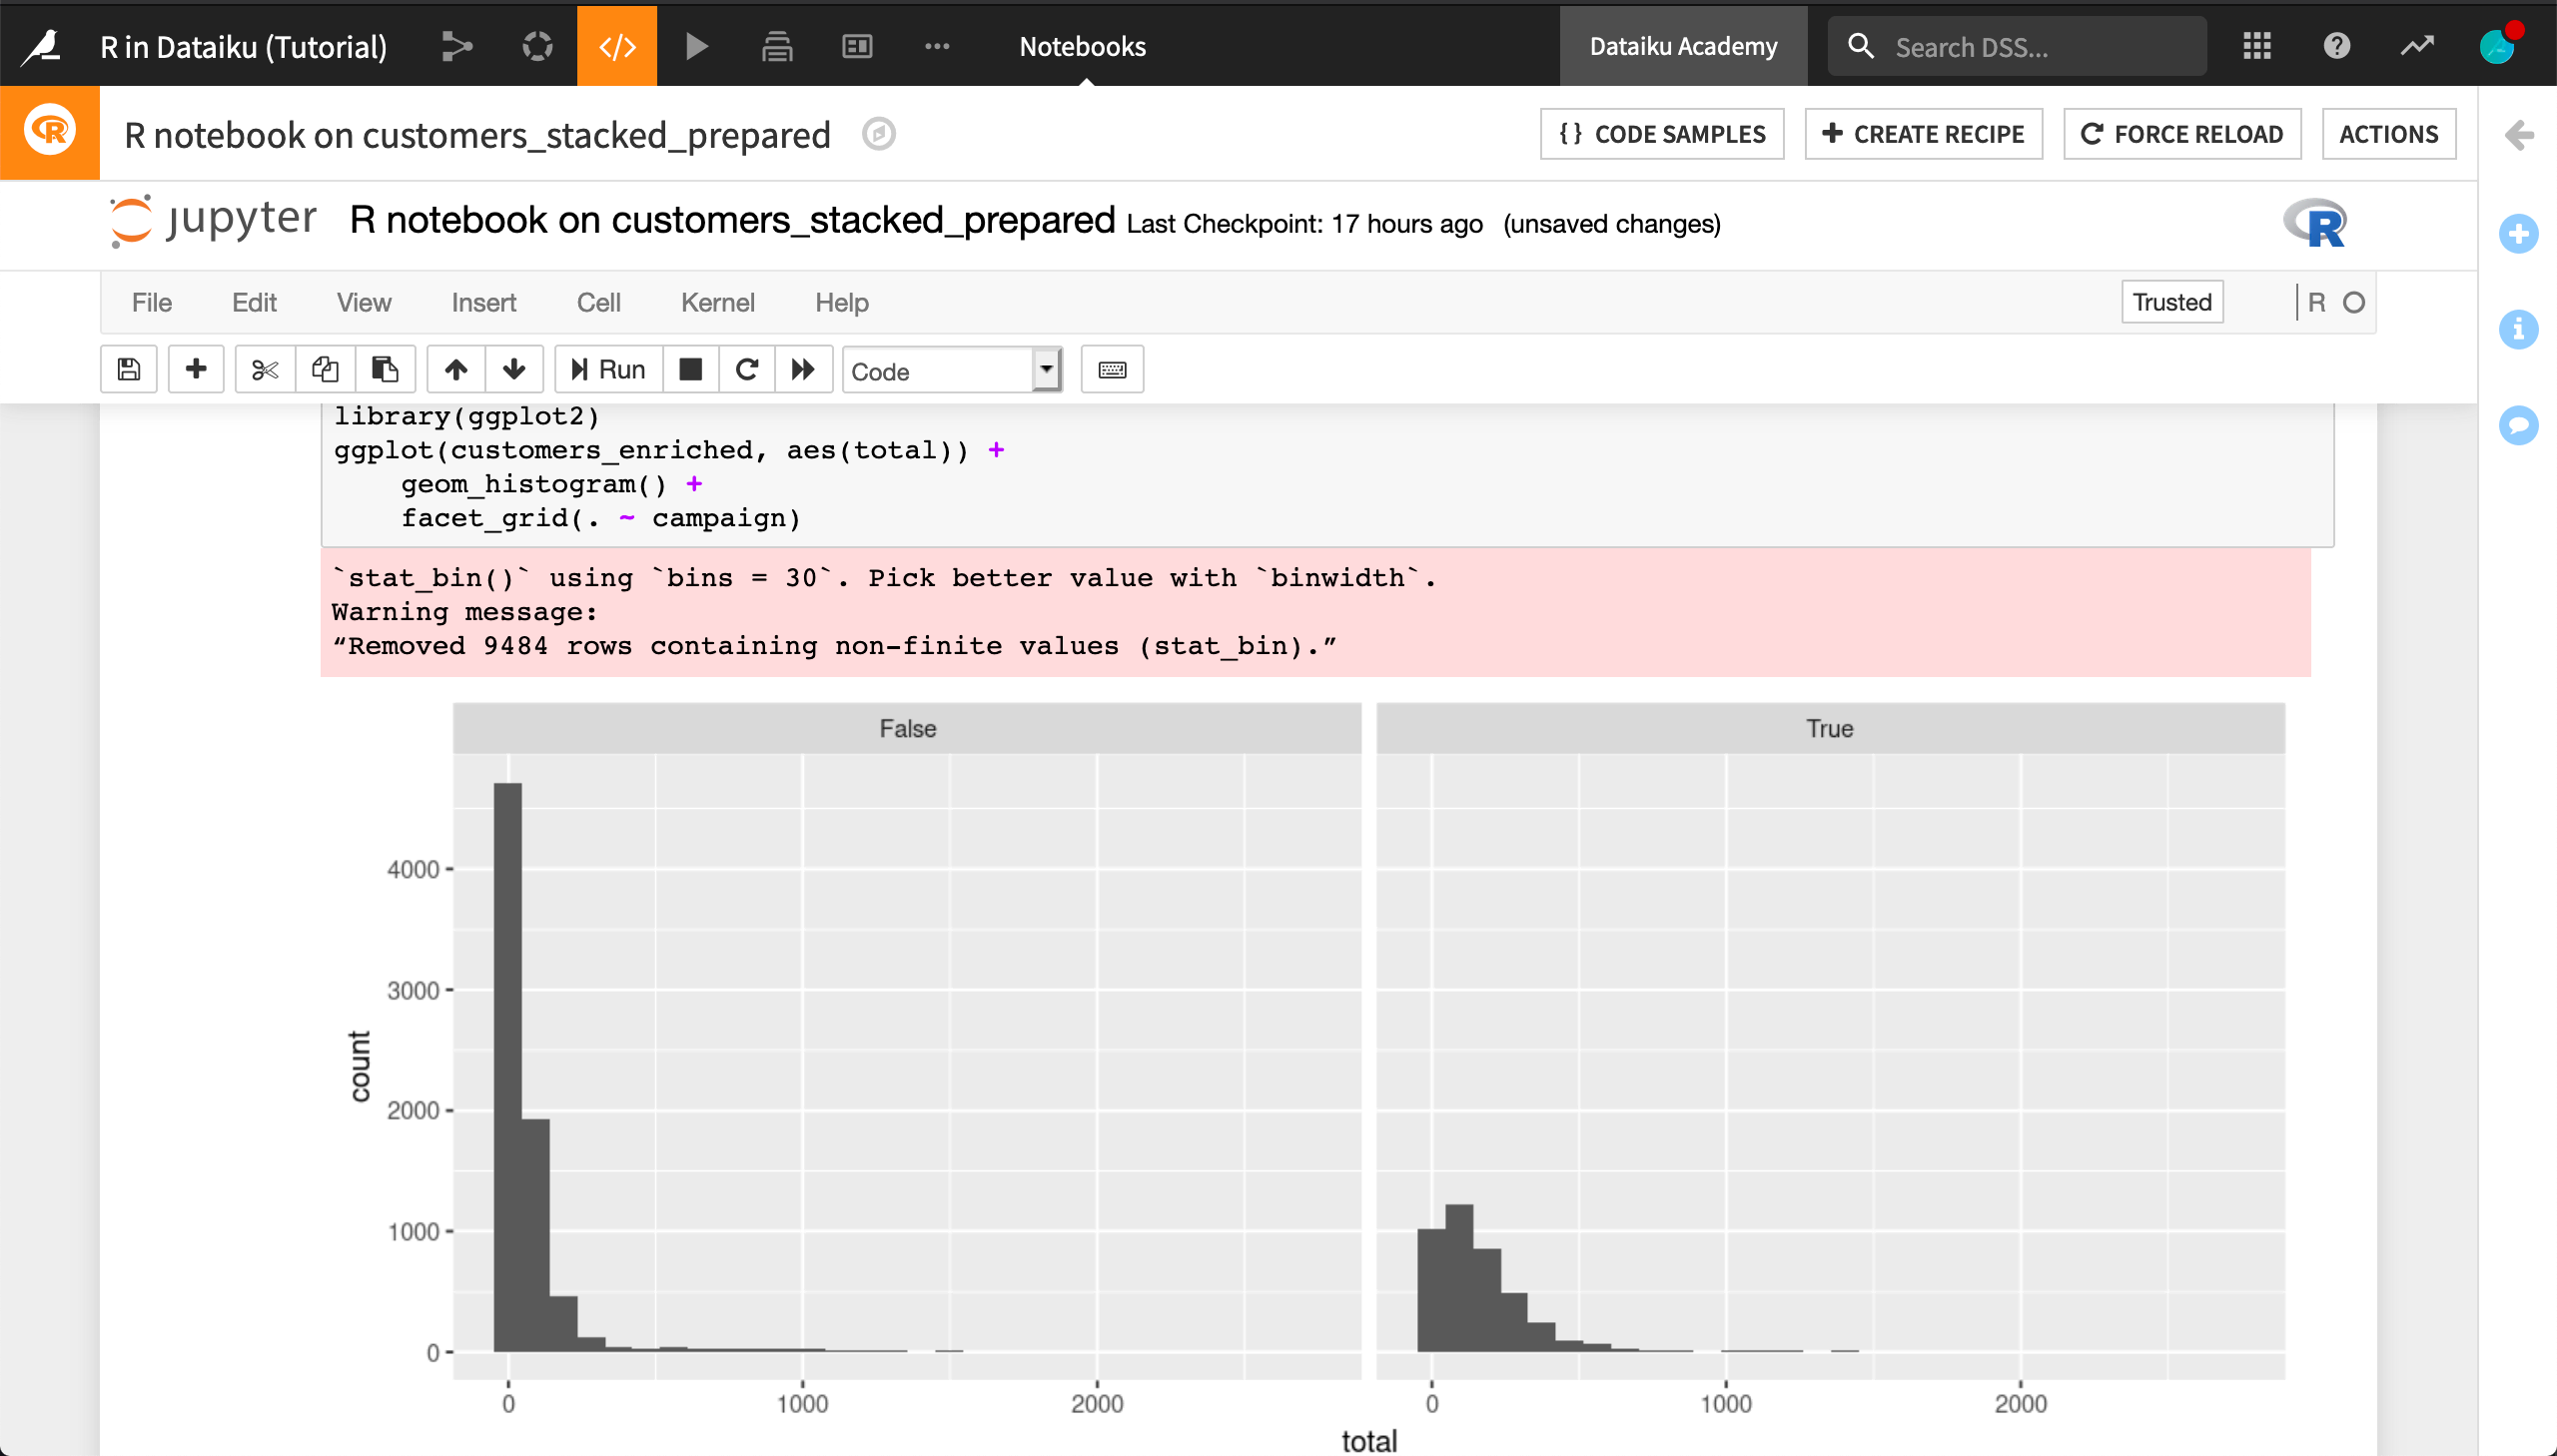
Finally, the following code produces a paneled histogram with the bar heights normalized so that it’s easier to compare across values of campaign.
Add a new cell.
Copy the contents below and run the cell.
library(ggplot2)
ggplot(customers_enriched, aes(total)) +
  geom_histogram() +
  facet_grid(. ~ campaign)
Note
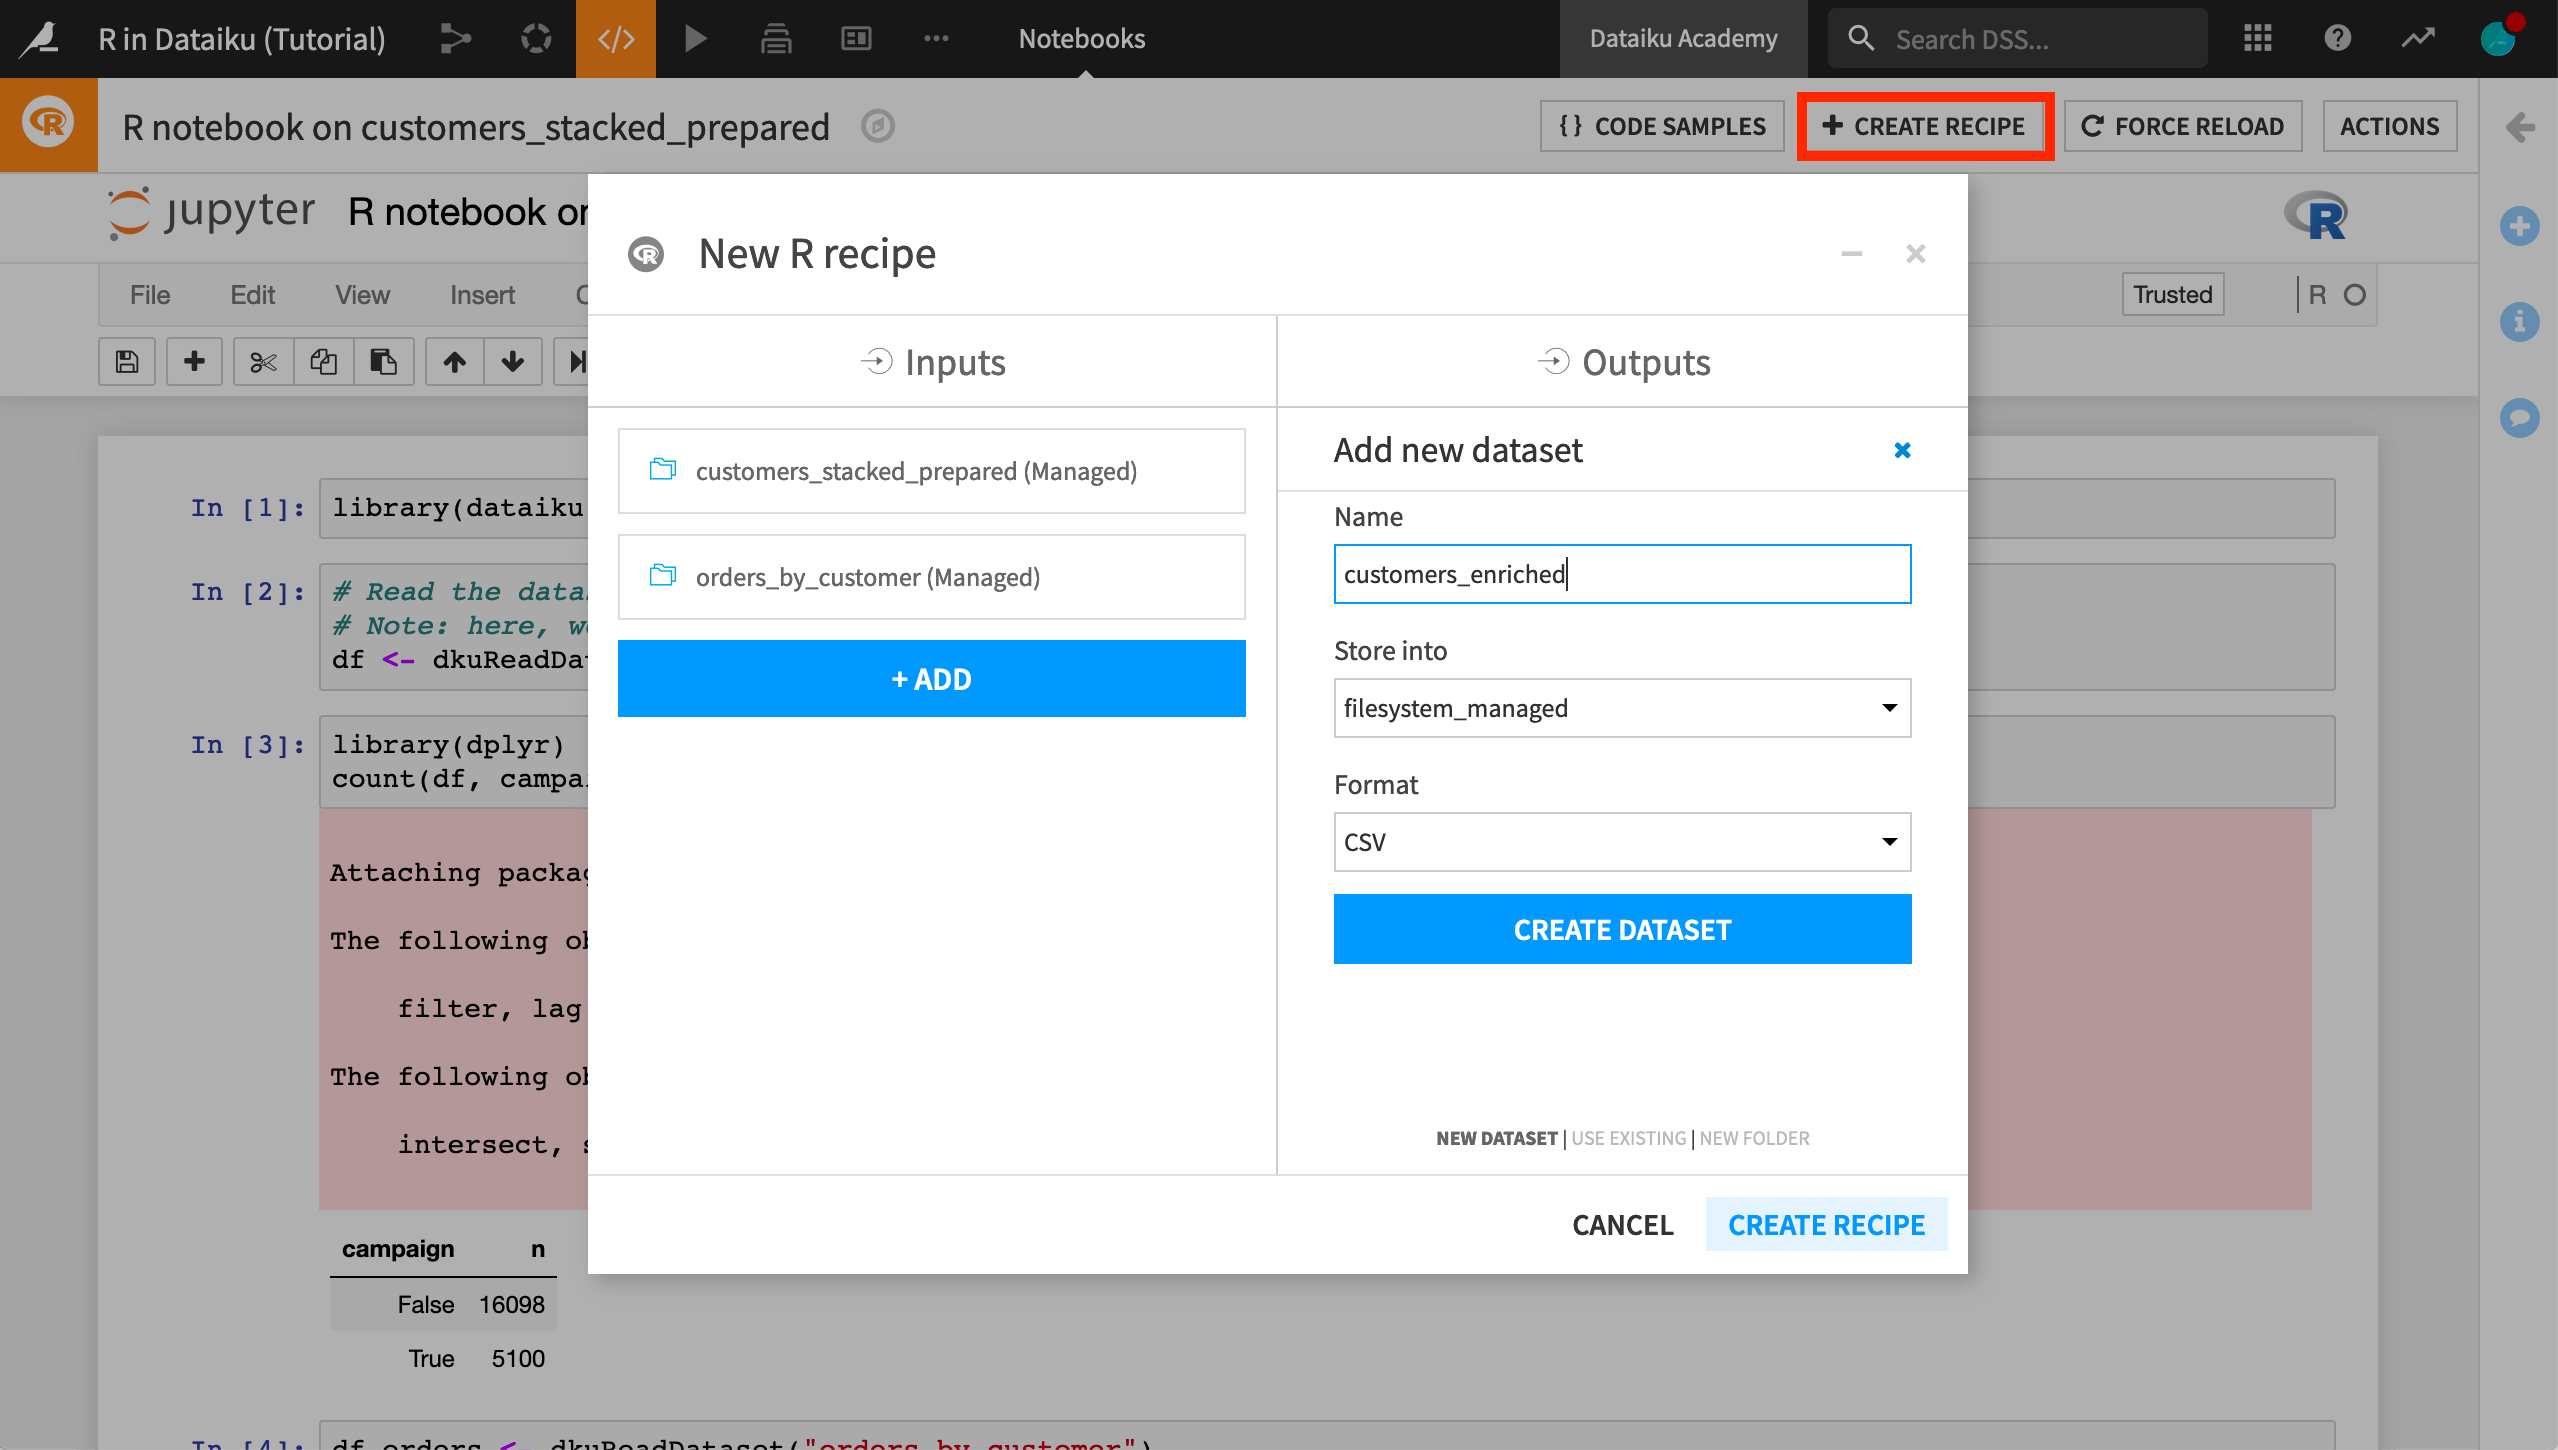
Recall that the notebook is a lab environment, and so the join we performed between the dataframes isn’t reflected in the Flow until we create a recipe.
From within the notebook, click Create Recipe > R recipe.
Add orders_by_customer as an input.
Create a new output dataset called
customers_enriched.
Run the resulting recipe and see how the Flow is affected.
What’s next?
Congratulations! You’ve taken the first steps on R integration in Dataiku. As you progress, you’ll find that the use of R in Dataiku is extensible. You can create:
Code environments to manage package dependencies and versions for your projects
Custom R libraries: reuse code all over the place. Should connect in to the Git-based dev workflow.