Concept Summary: Partitioned Models
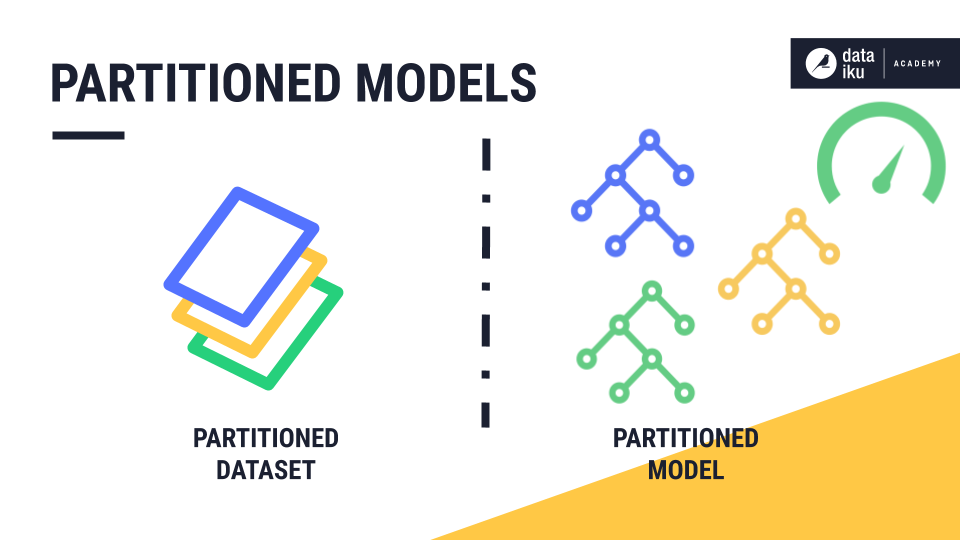
In Dataiku DSS, we can take our partitioned dataset and train a prediction model on each partition. Partitioned, or stratified, models can result in better predictions than a model trained on the whole dataset.
This is because subgroups related to a dataset’s partitions can sometimes have dissimilar behaviors. Therefore, they draw different patterns over the features.
Using a country as an example of a subgroup, customers in different countries could have different purchasing patterns impacting sales predictions. This could be due to differences in characteristics such as seasons.
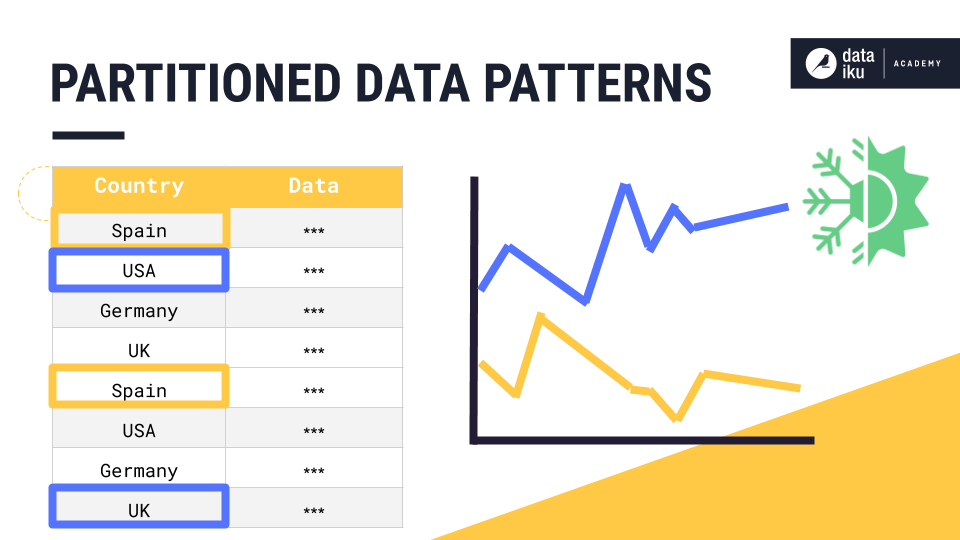
Therefore, partitioning our data by country, and training a machine learning model for each partition, could result in a higher-performing model. If we trained the model using the whole dataset, instead of the partitions, the model might not be able to capture all of the nuances for each country, or subgroup.
Let’s test our hypothesis in Dataiku DSS. In this example, we’ve trained and deployed two machine learning models to predict flight arrival delay time. The flight arrival dataset has two partitions, Florida and California. “Random_forest” has been trained over the whole data, and “random_forest_partitioned” has been trained over the partitioned data.
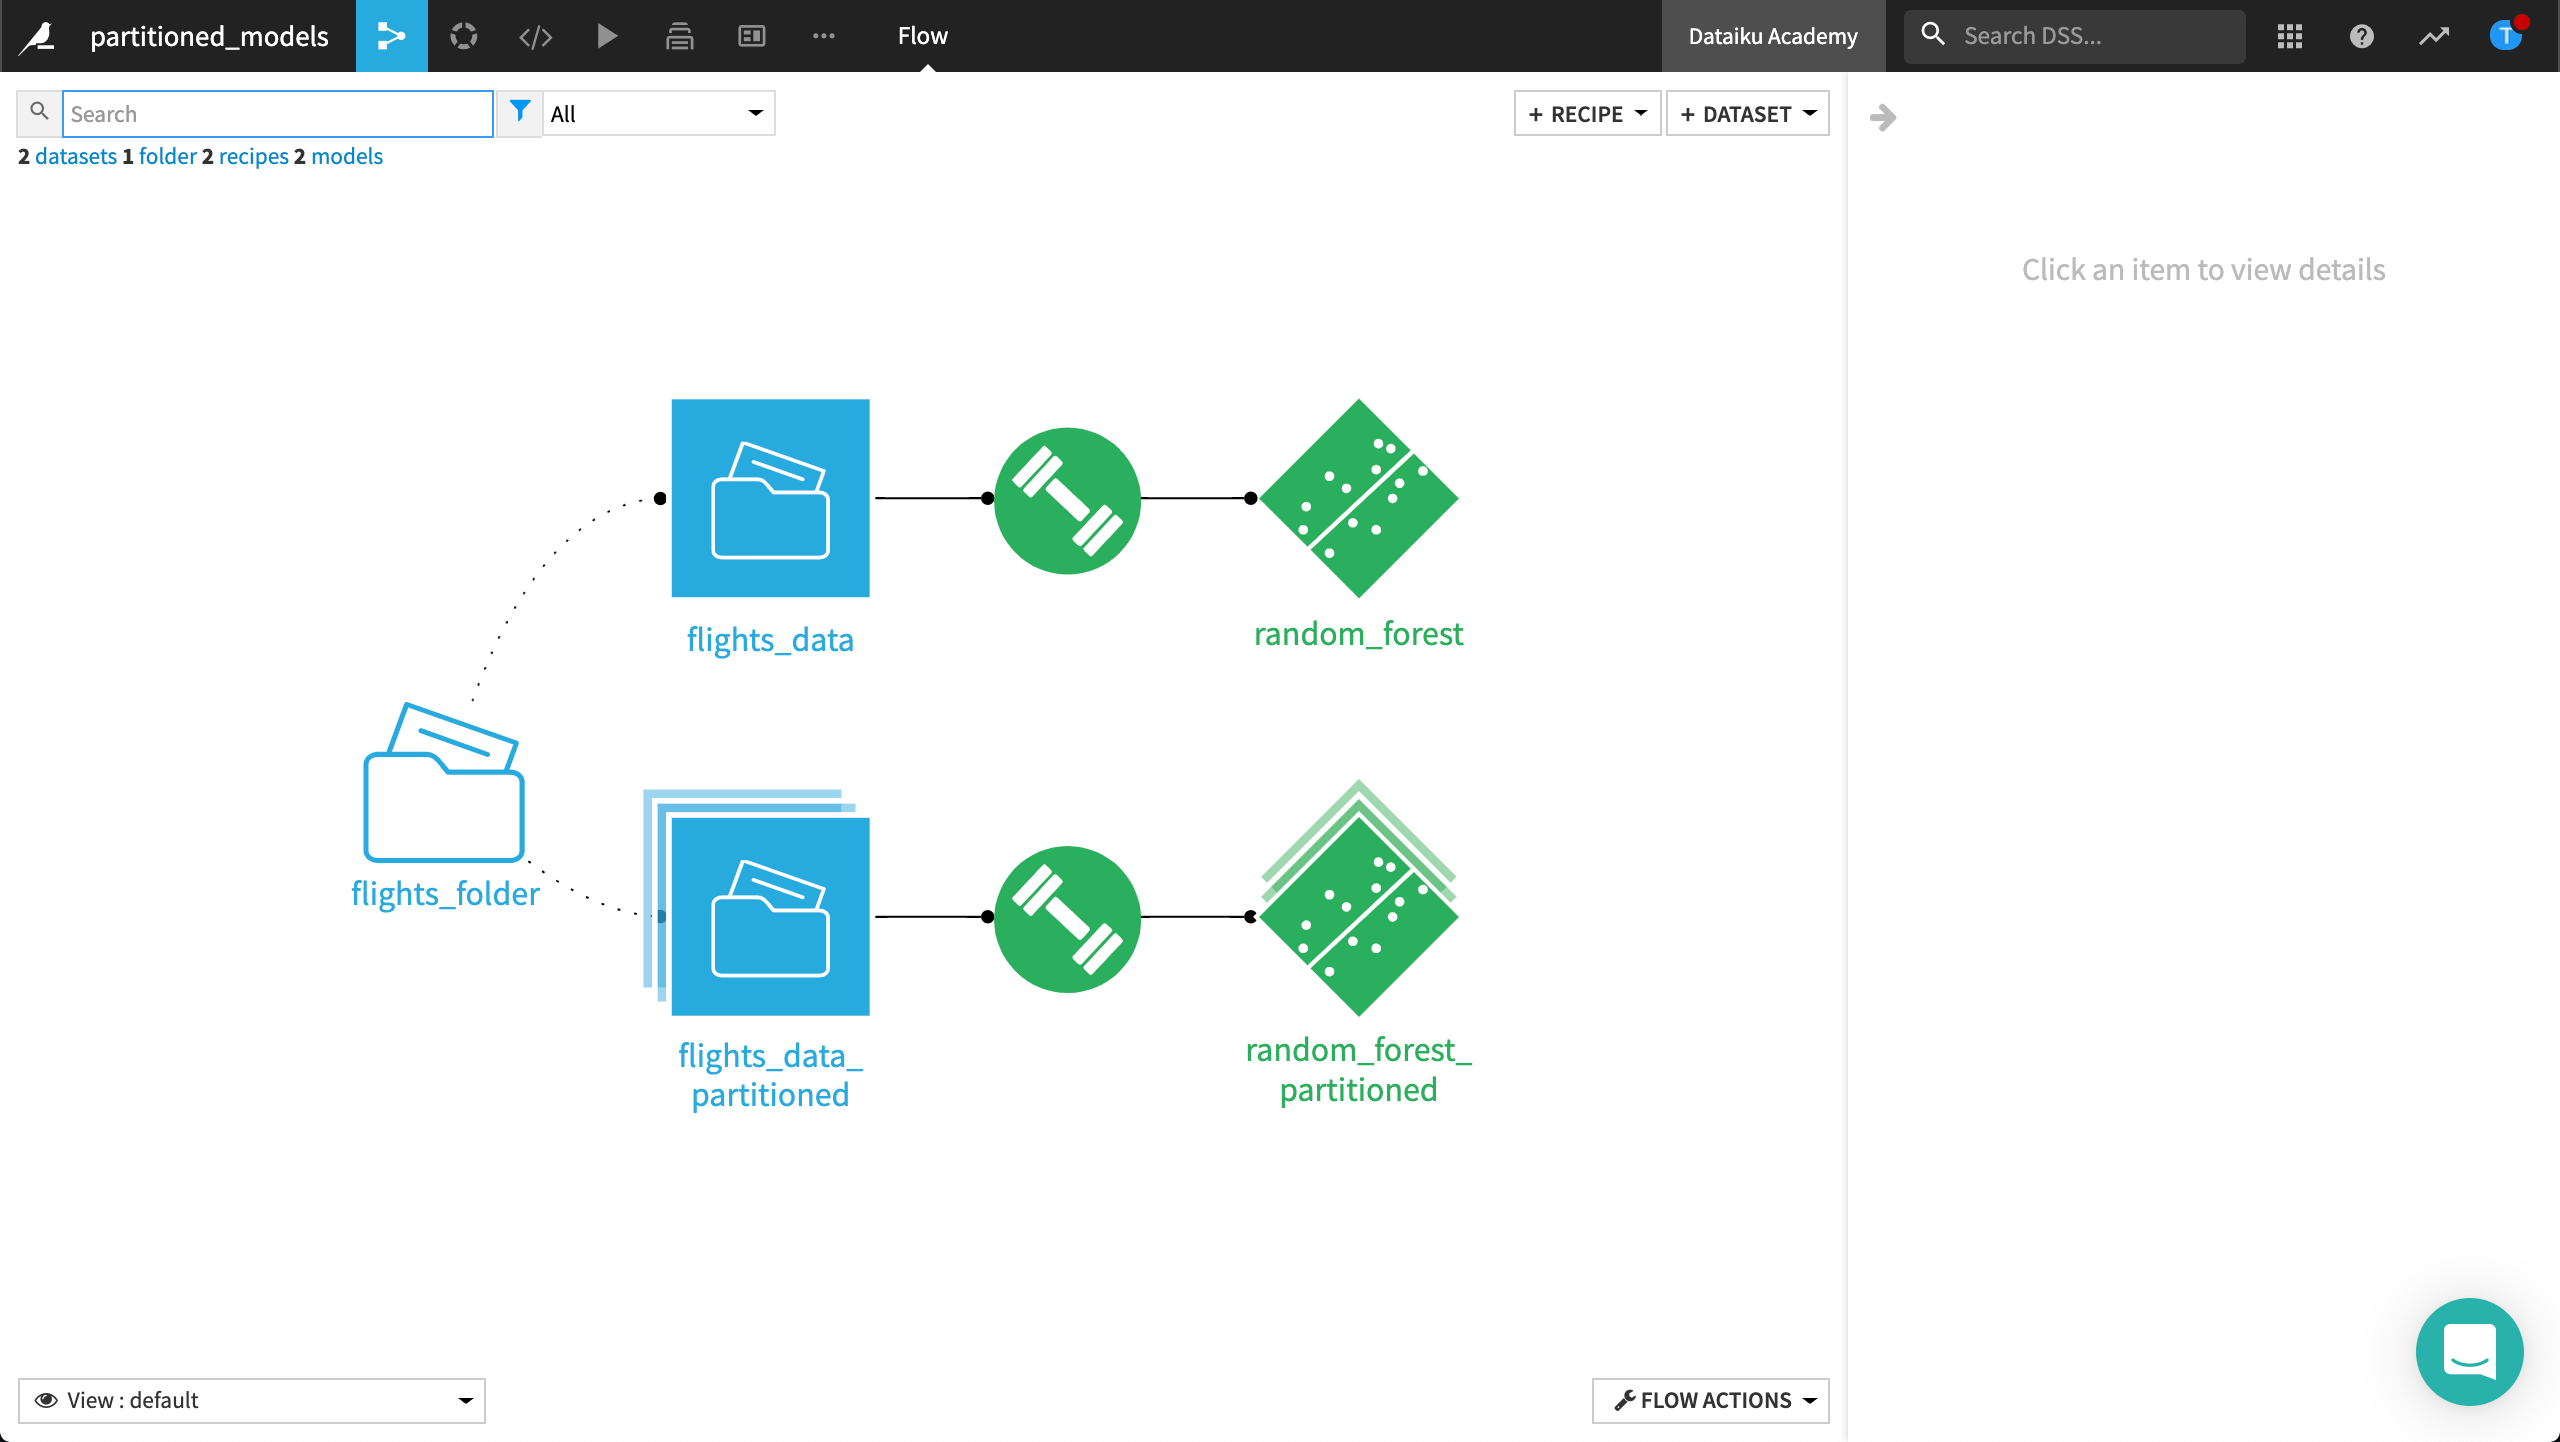
Let’s compare the difference between our two deployed models and observe the results.
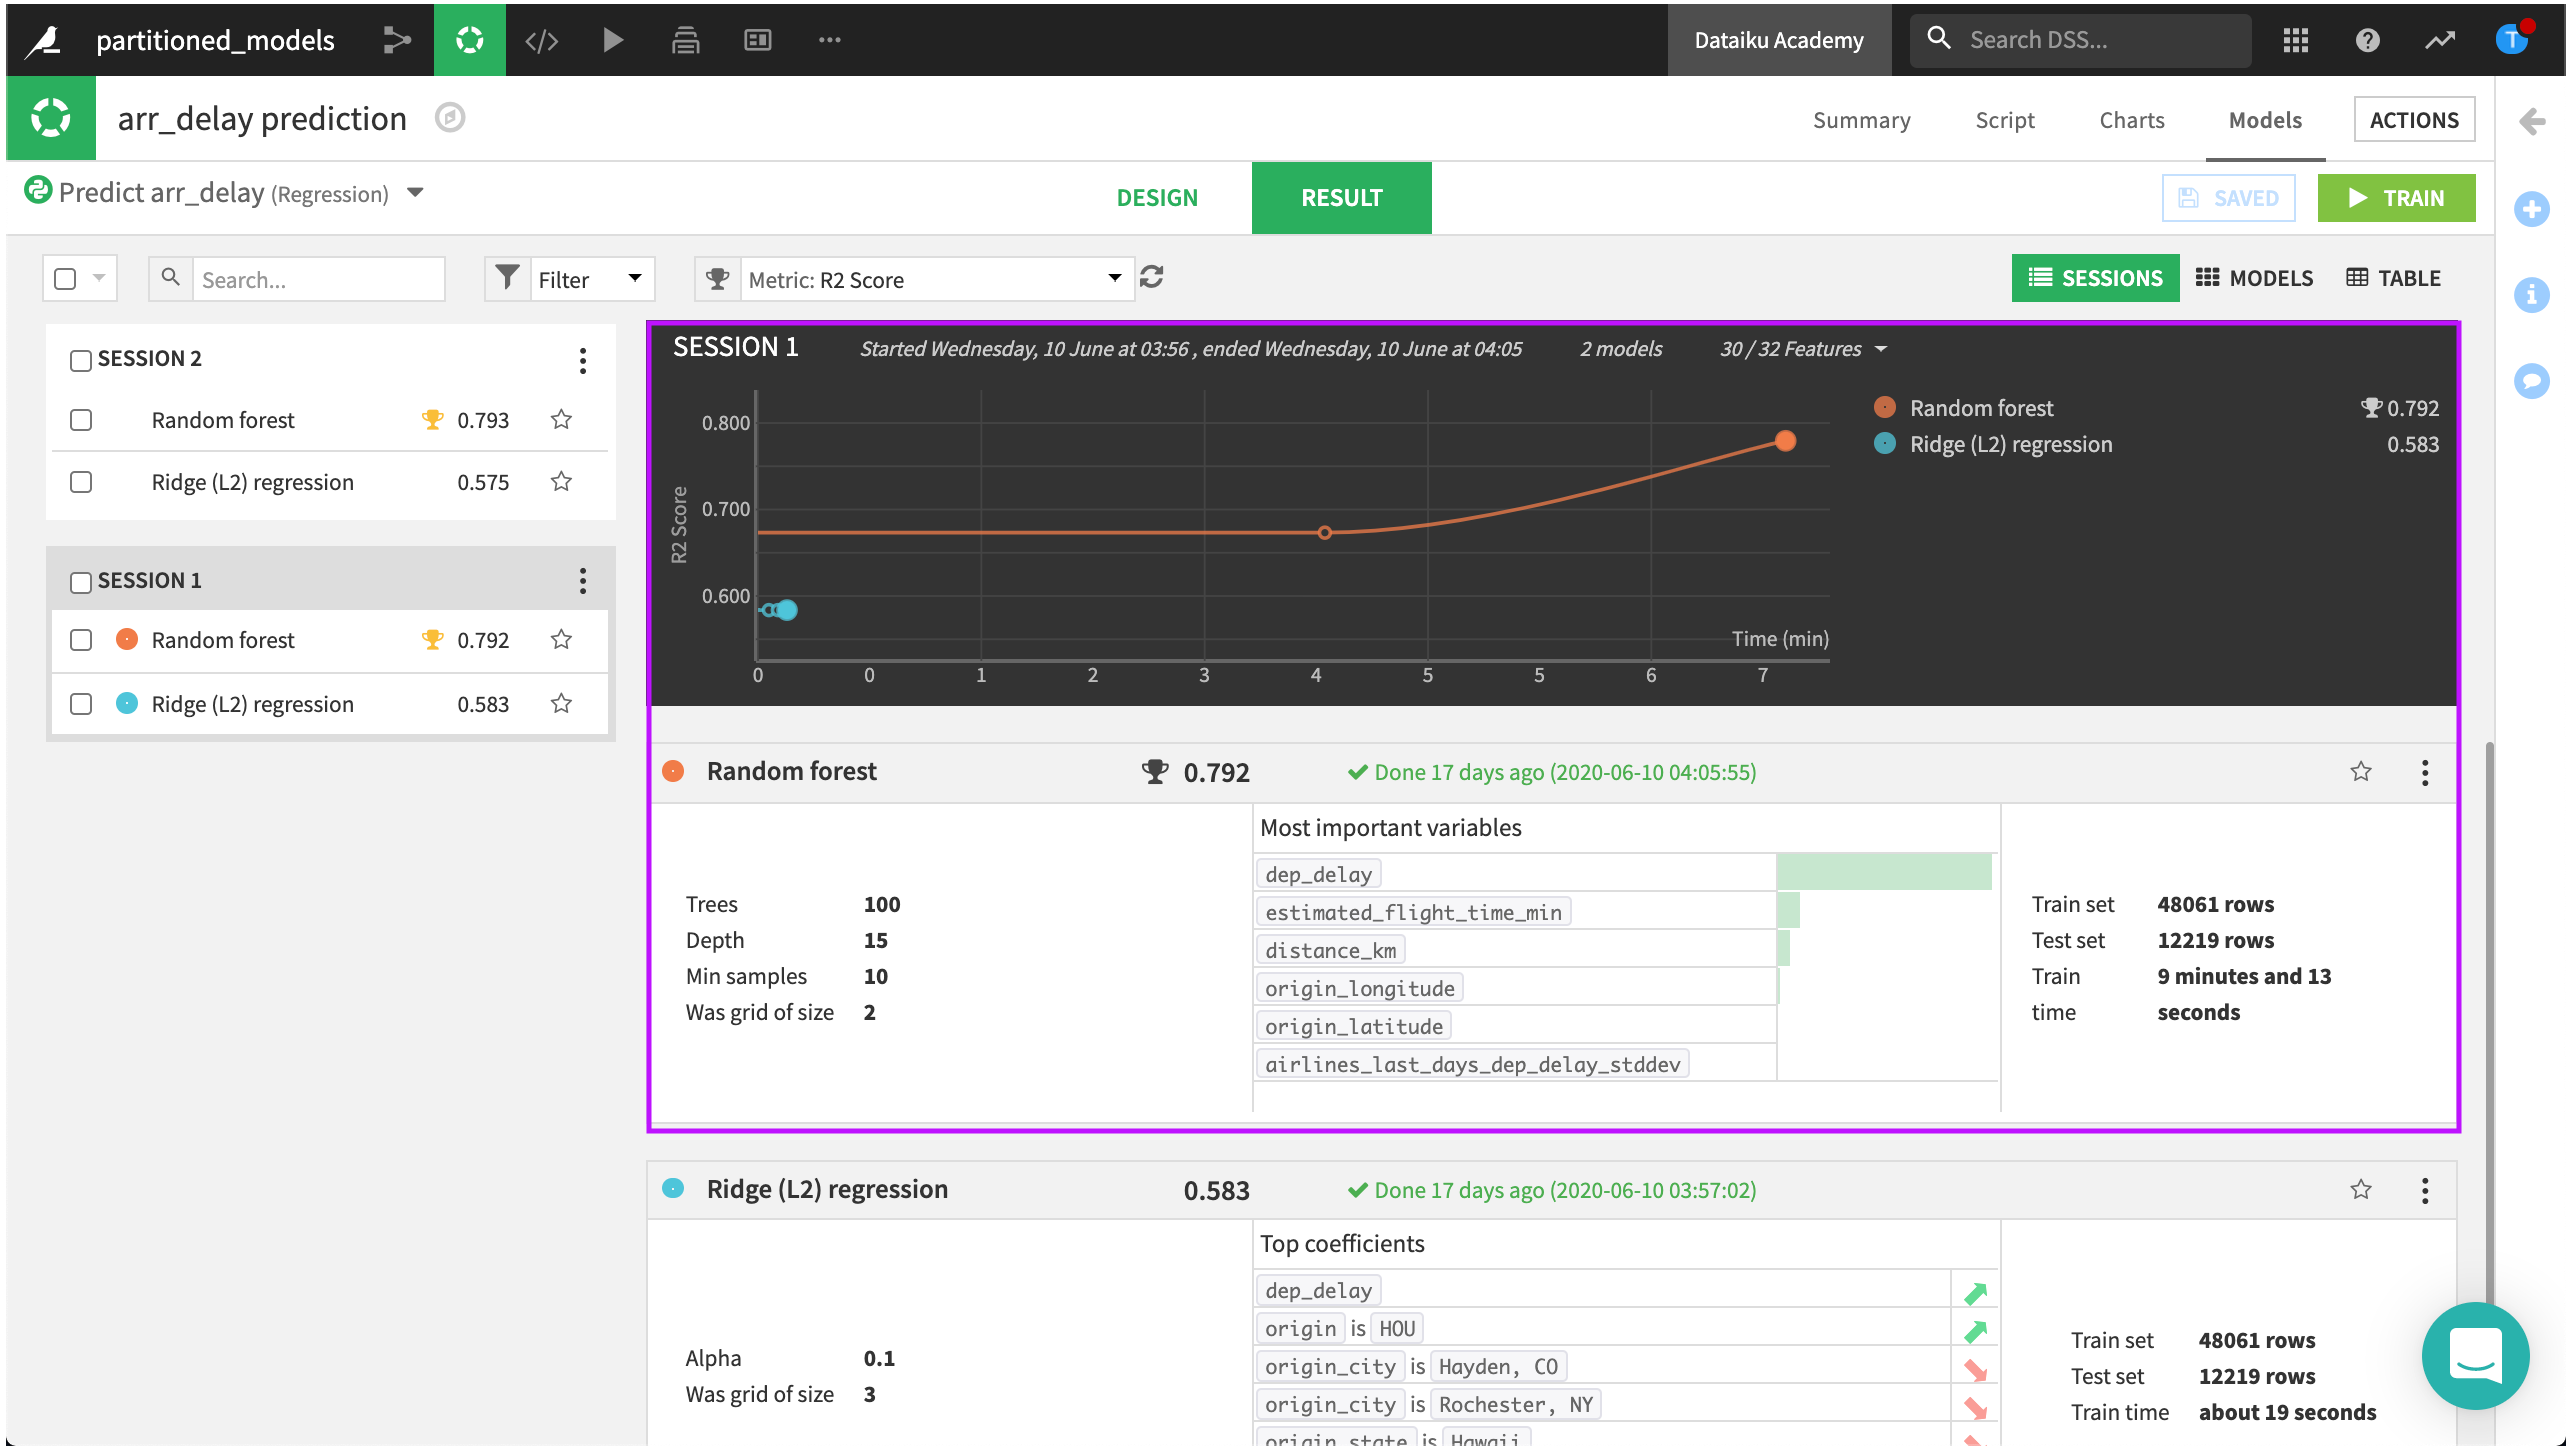
We’ll look at the non-partitioned model first. In the performance summary, it looks like our best model is the random forest. Its R2 score is pretty good.
Let’s compare this with the results of the partitioned model. Once again, our best model is the random forest.
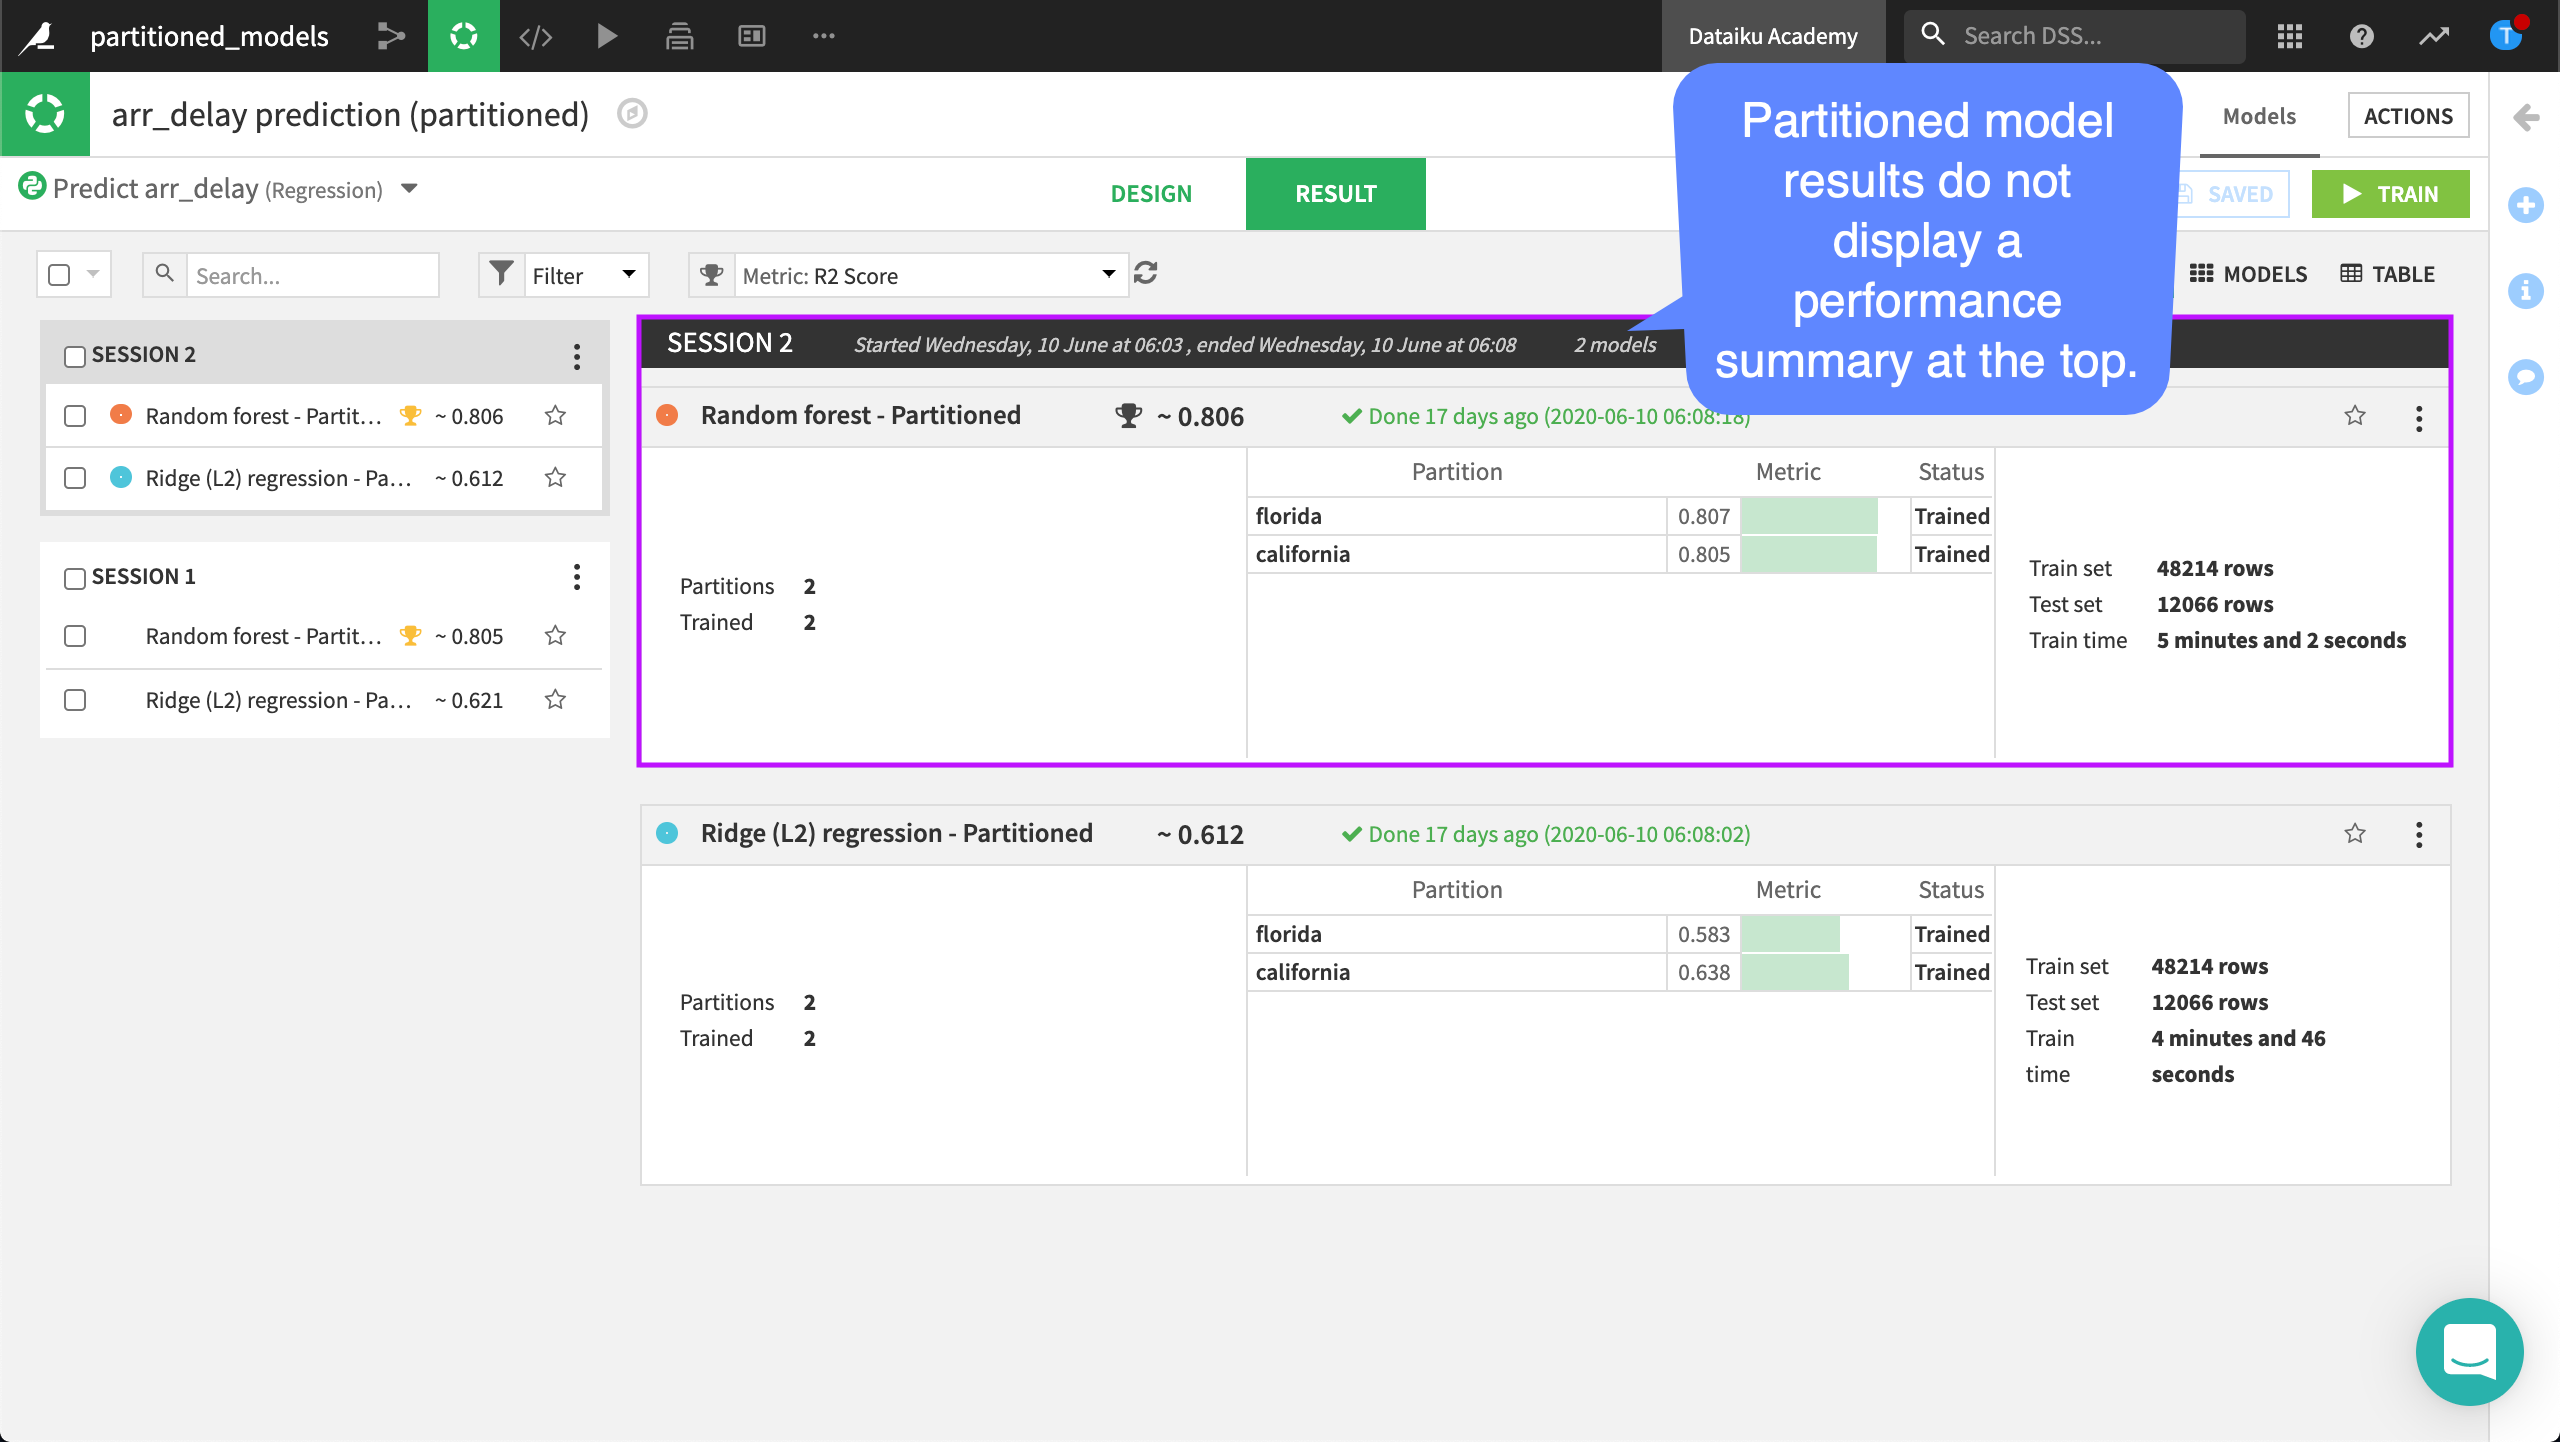
We notice that Dataiku DSS does not display the performance summary at the top. This is expected. We have trained not only one model, but as many models as partitions in our dataset times the number of algorithms. The summary for all of these models would not be readable.
Furthermore, Dataiku DSS displays the R2 score as “approximate” because two random forests have been trained, one on the “florida” partition, and one on the “california” partition. This score is good news, partitioning our dataset by destination state has resulted in a higher prediction performance.
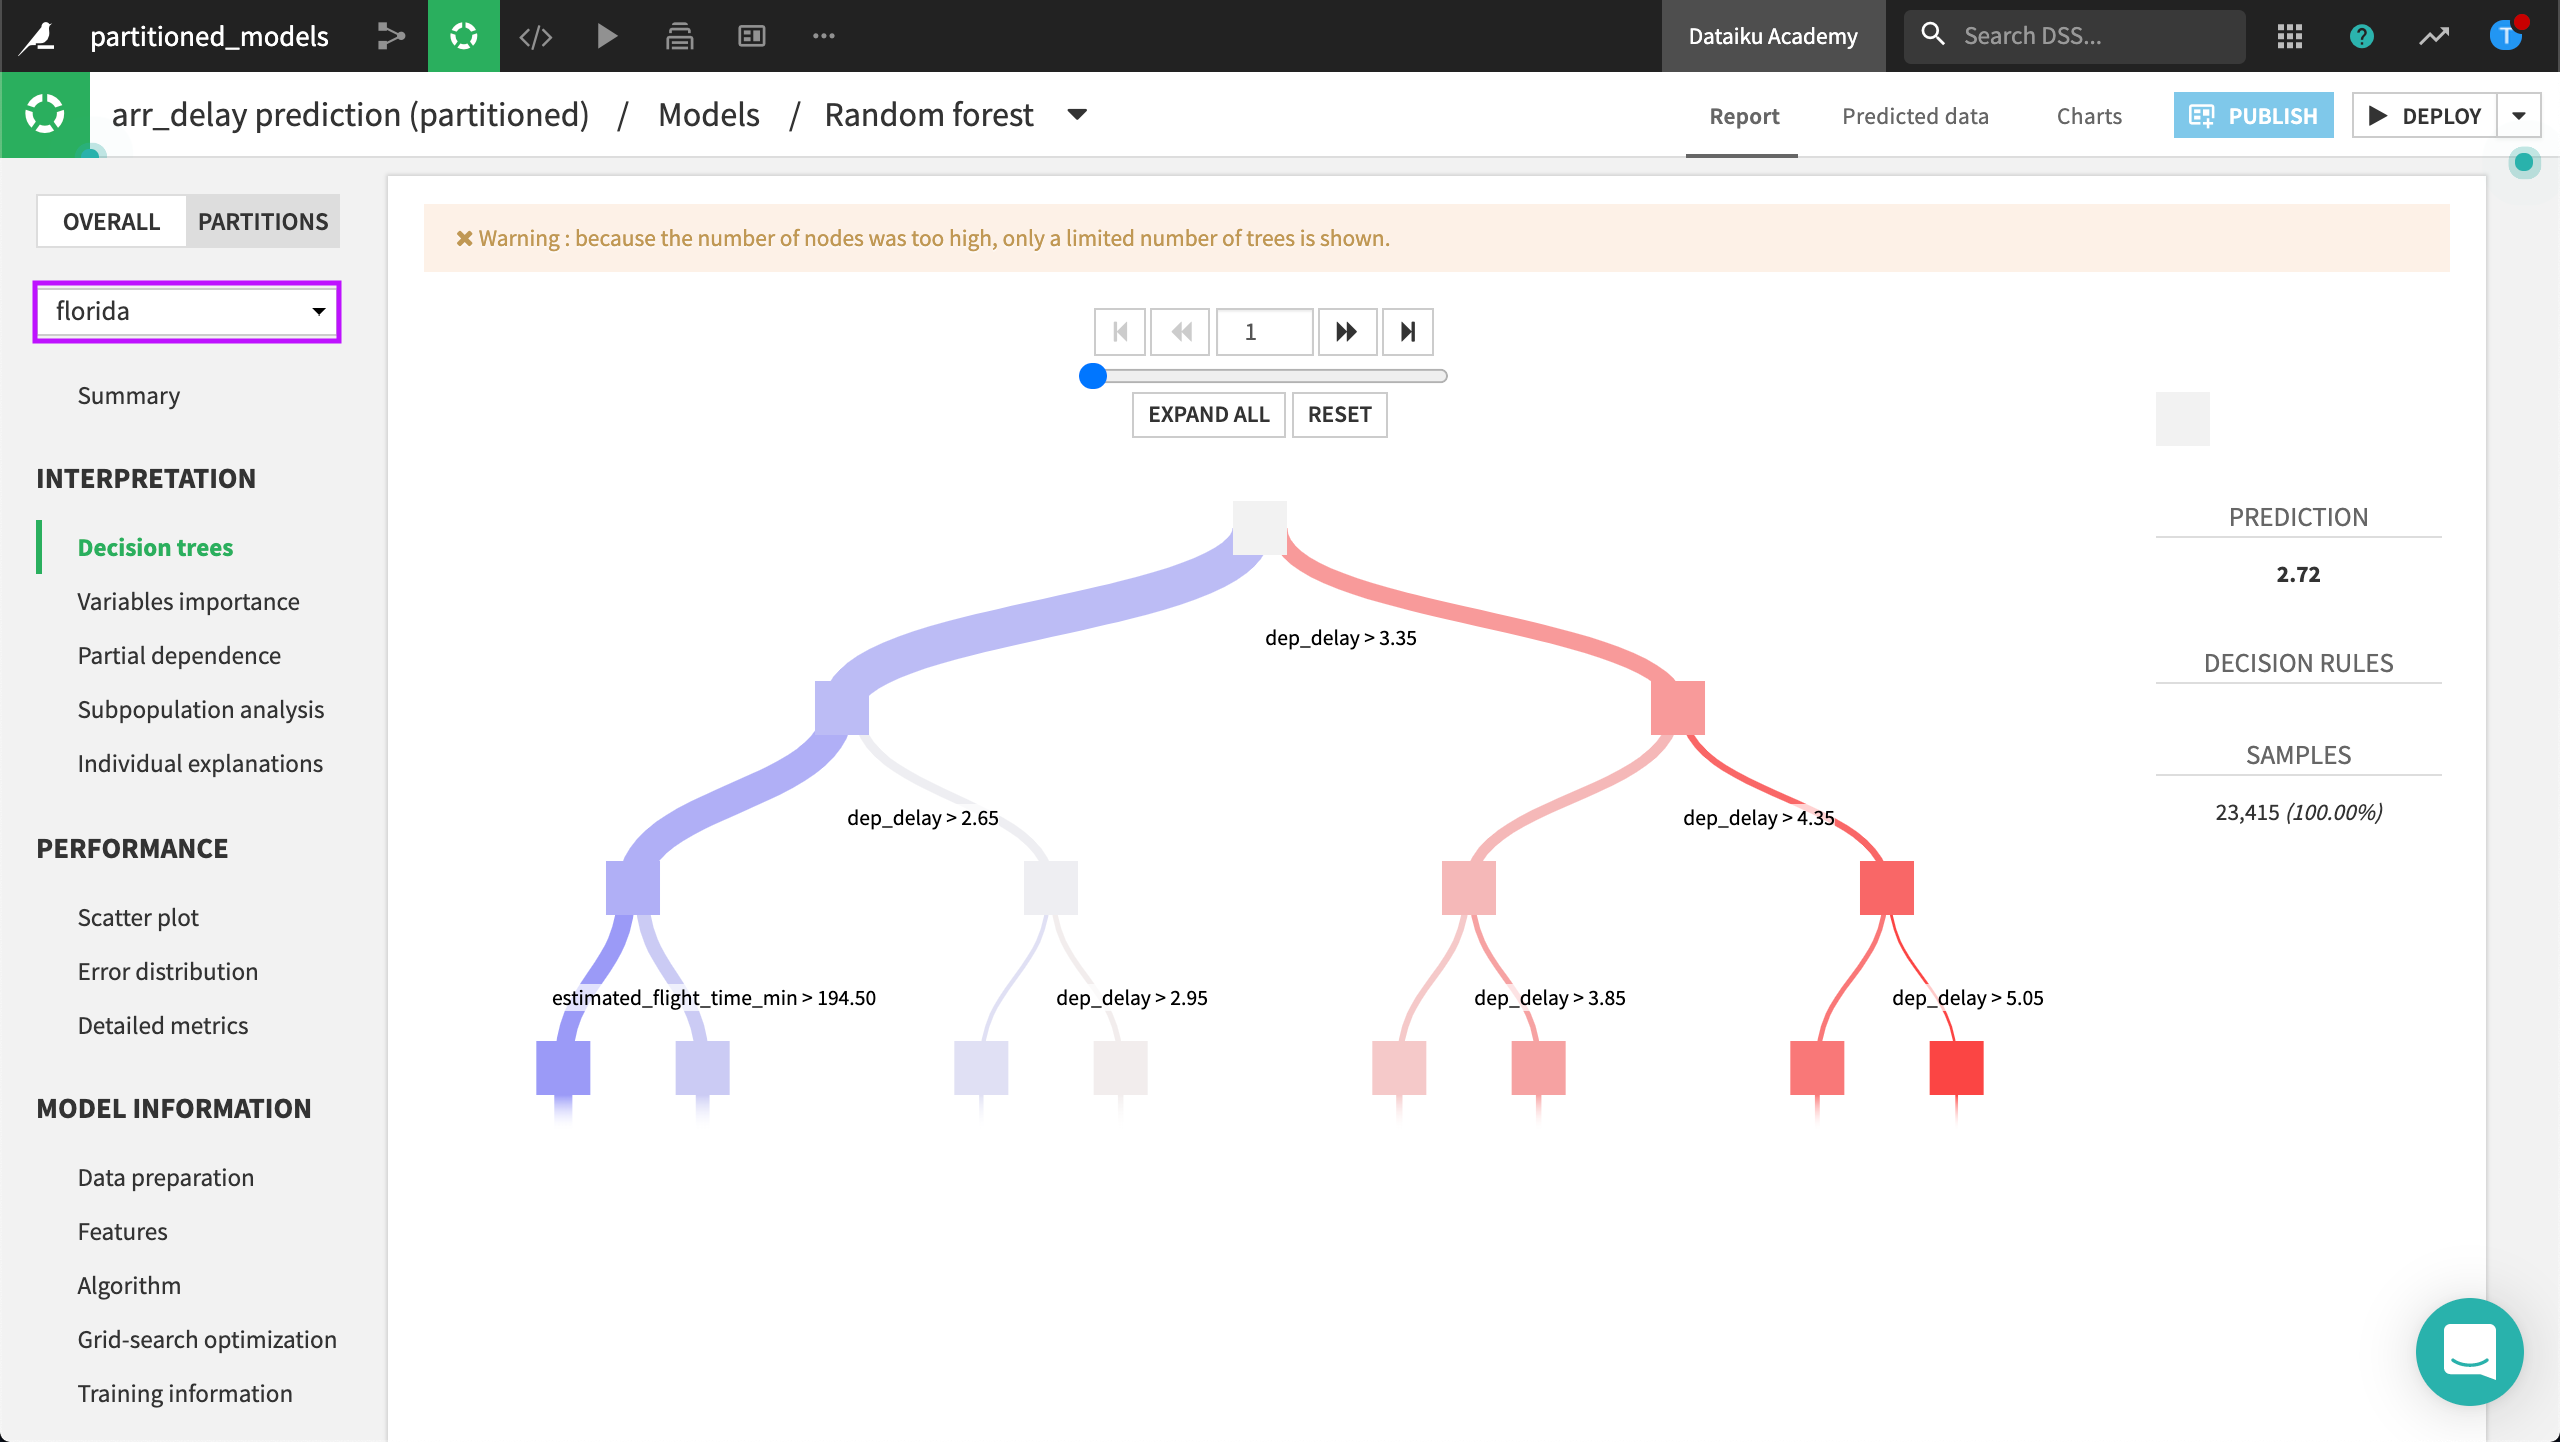
To compare results for the Partitions with the Overall results side-by-side, we can open the random forest model to look at a Summary page.
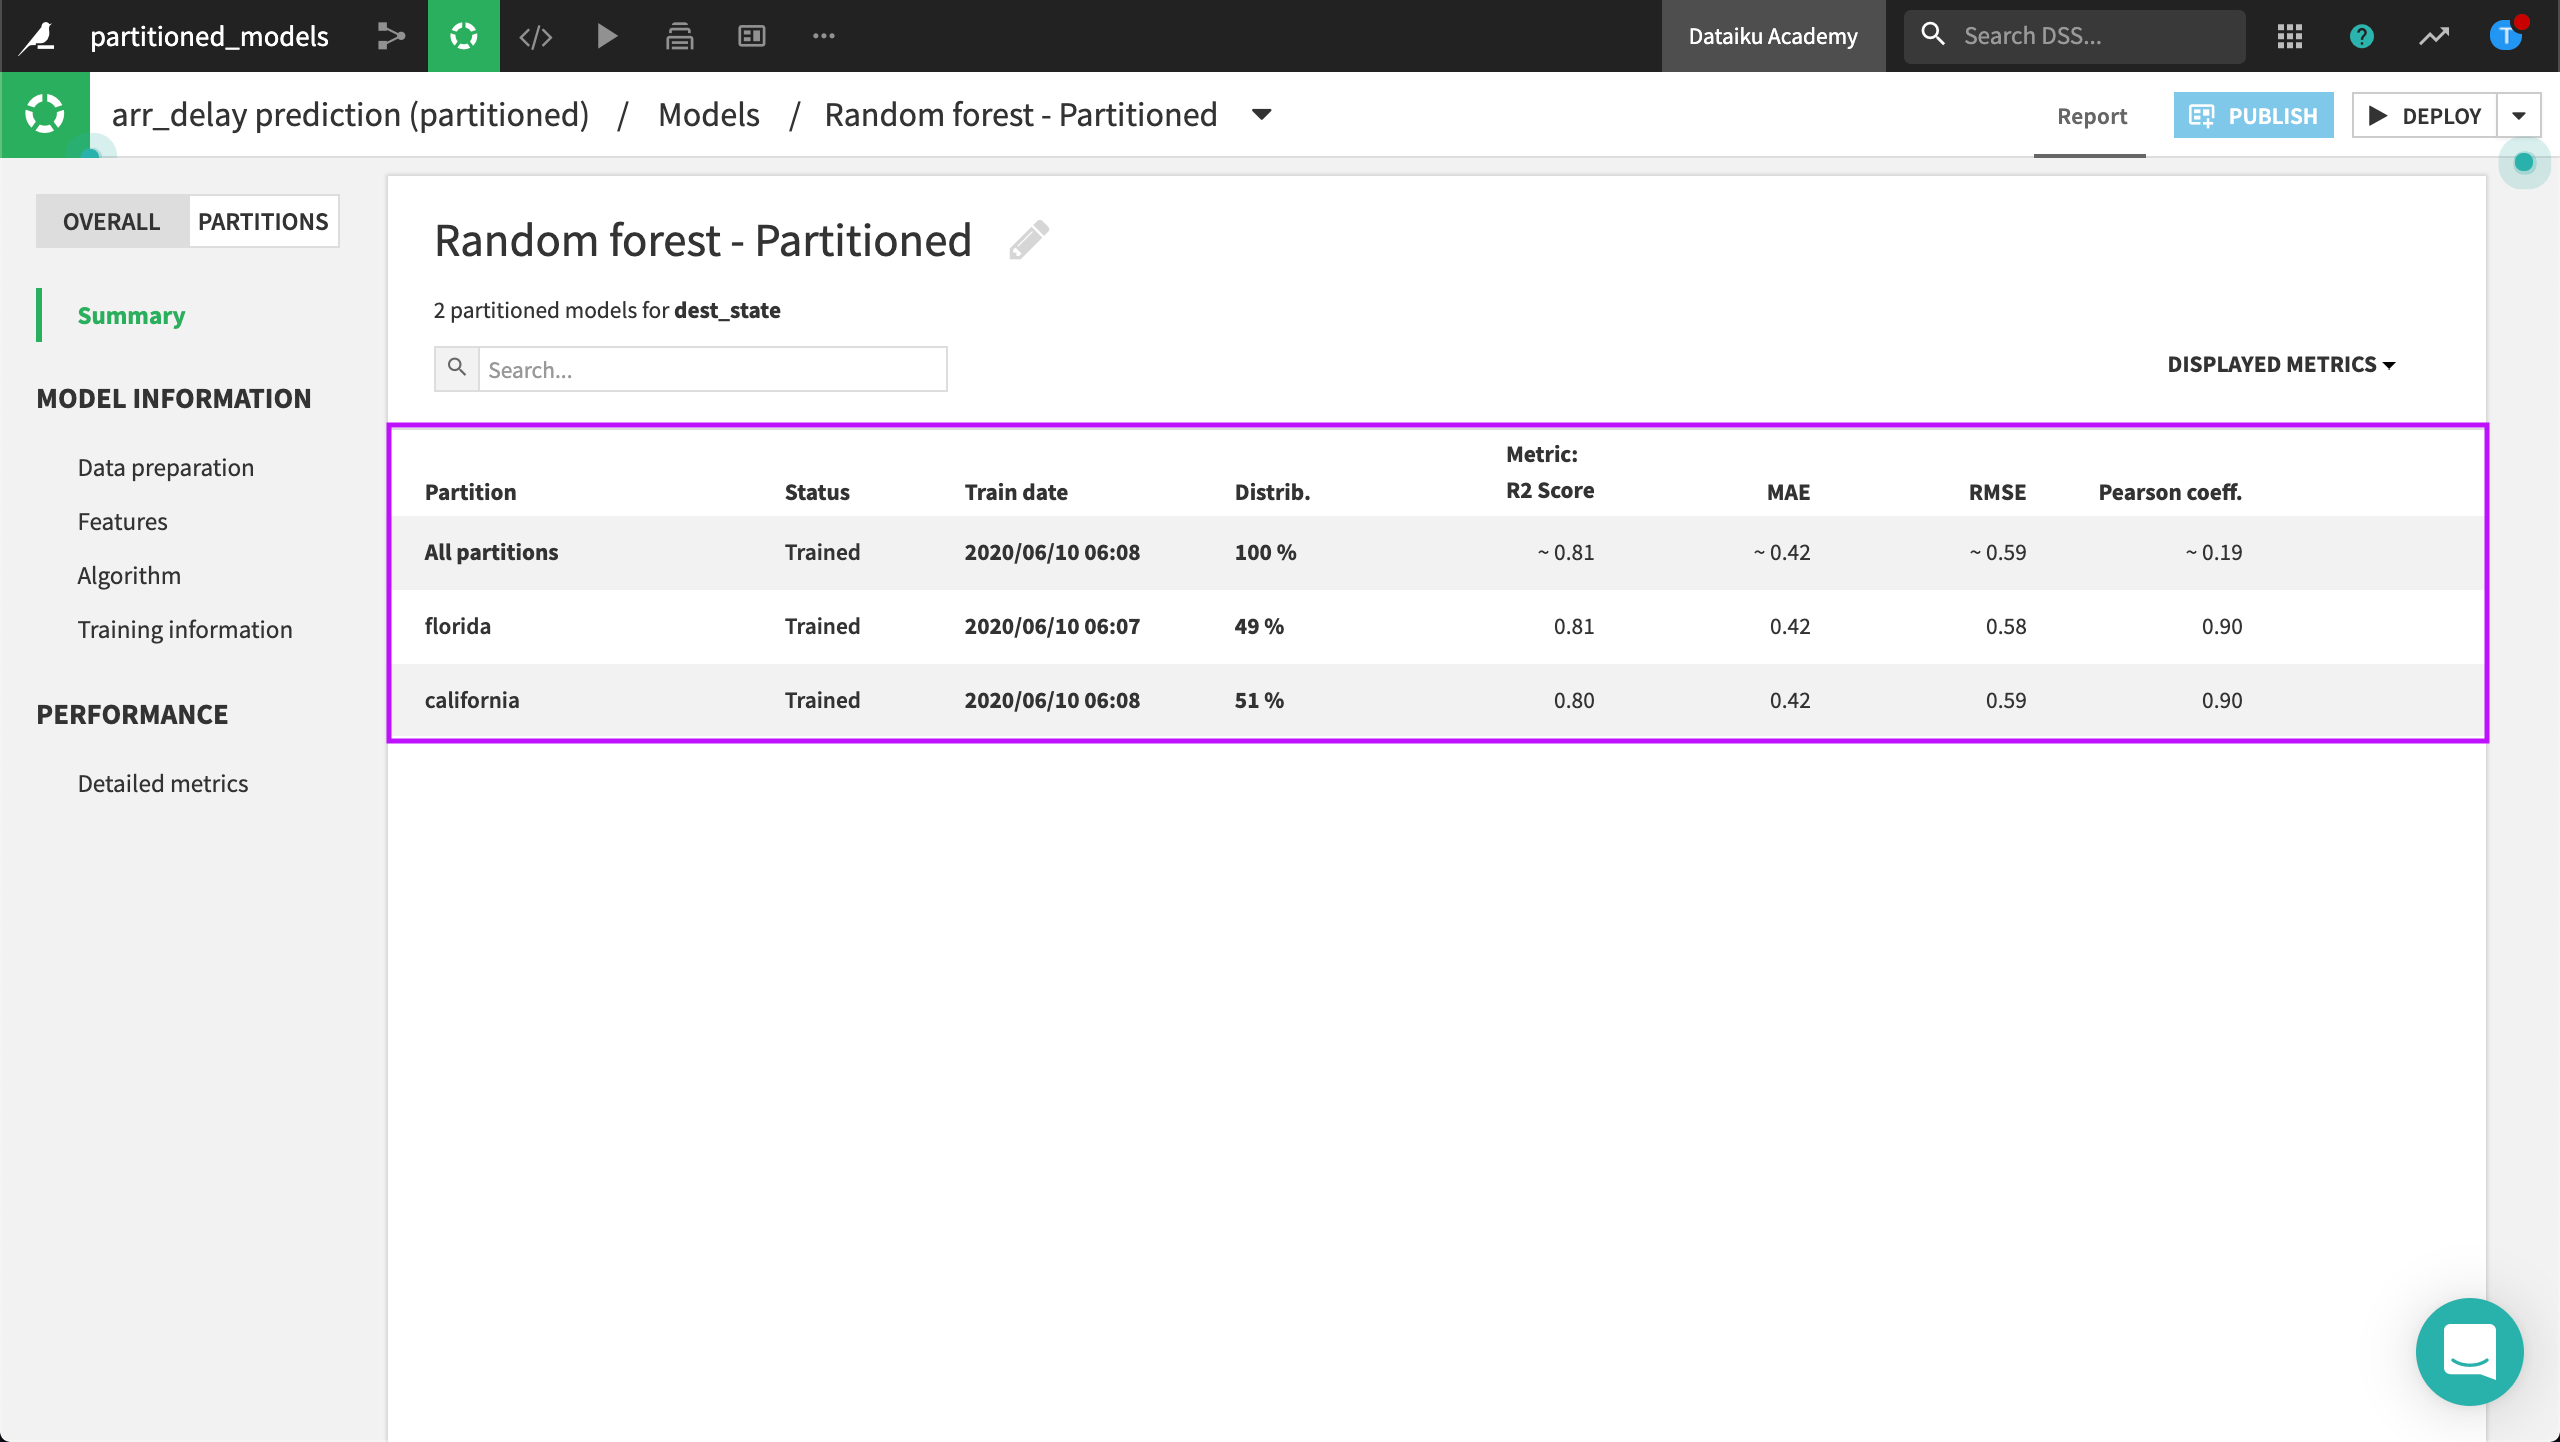
Interacting with the results of a model trained on a partition is the same as interacting with the overall results. The difference is the partitioned model is an expert of only its “learning partition”, providing specific details not available with the overall results.