The AI Lifecycle: Orchestrate
For an enterprise looking to scale, the ability to deploy a model into production is not enough. Realizing the full potential of a model requires orchestration — a repeatable, efficient process for creating and effectively deploying models into production.
In the case of the NY Taxi Fares project, we have deployed a model for real-time scoring, but managing the model lifecycle remains a manual process. How do we monitor its progress over time? When should the model be re-trained? When should a new version be deployed?
To effectively manage the process of deploying hundreds of models from development to testing to production environments, automation becomes a clear necessity.
DSS lets users establish validation feedback loops in order to automate the updating, monitoring, and quality control of a project’s Flow by continually pushing work from the Design node to the Automation node.
This stage of the AI lifecycle encompasses:
Scenarios to automate key processes like rebuilding, retraining, and deployment
Metrics and Checks to monitor model performance in production
Deploying projects to the Automation node
In addition to deploying models into production, another key aspect of orchestration is the automation of reporting. In order to make it easy to communicate real-time results, DSS provides users with drag-and-drop tools, such as dashboards, or code options, such as web apps and R Markdown reports.
Automation Scenarios
In DSS, the scenario is the place to begin automating tasks, such as rebuilding datasets, retraining models, or redeploying application bundles.
A scenario has two required components:
A trigger that activates a scenario and causes it to run
The steps, or actions, that a scenario takes when it runs
As in many other places in DSS, scenarios are a task that can be completed through a visual interface or entirely customized with code.
Triggers are typically time-bound (for example, run a scenario every day at a particular hour) or dataset-bound (run a scenario whenever a certain dataset is modified).
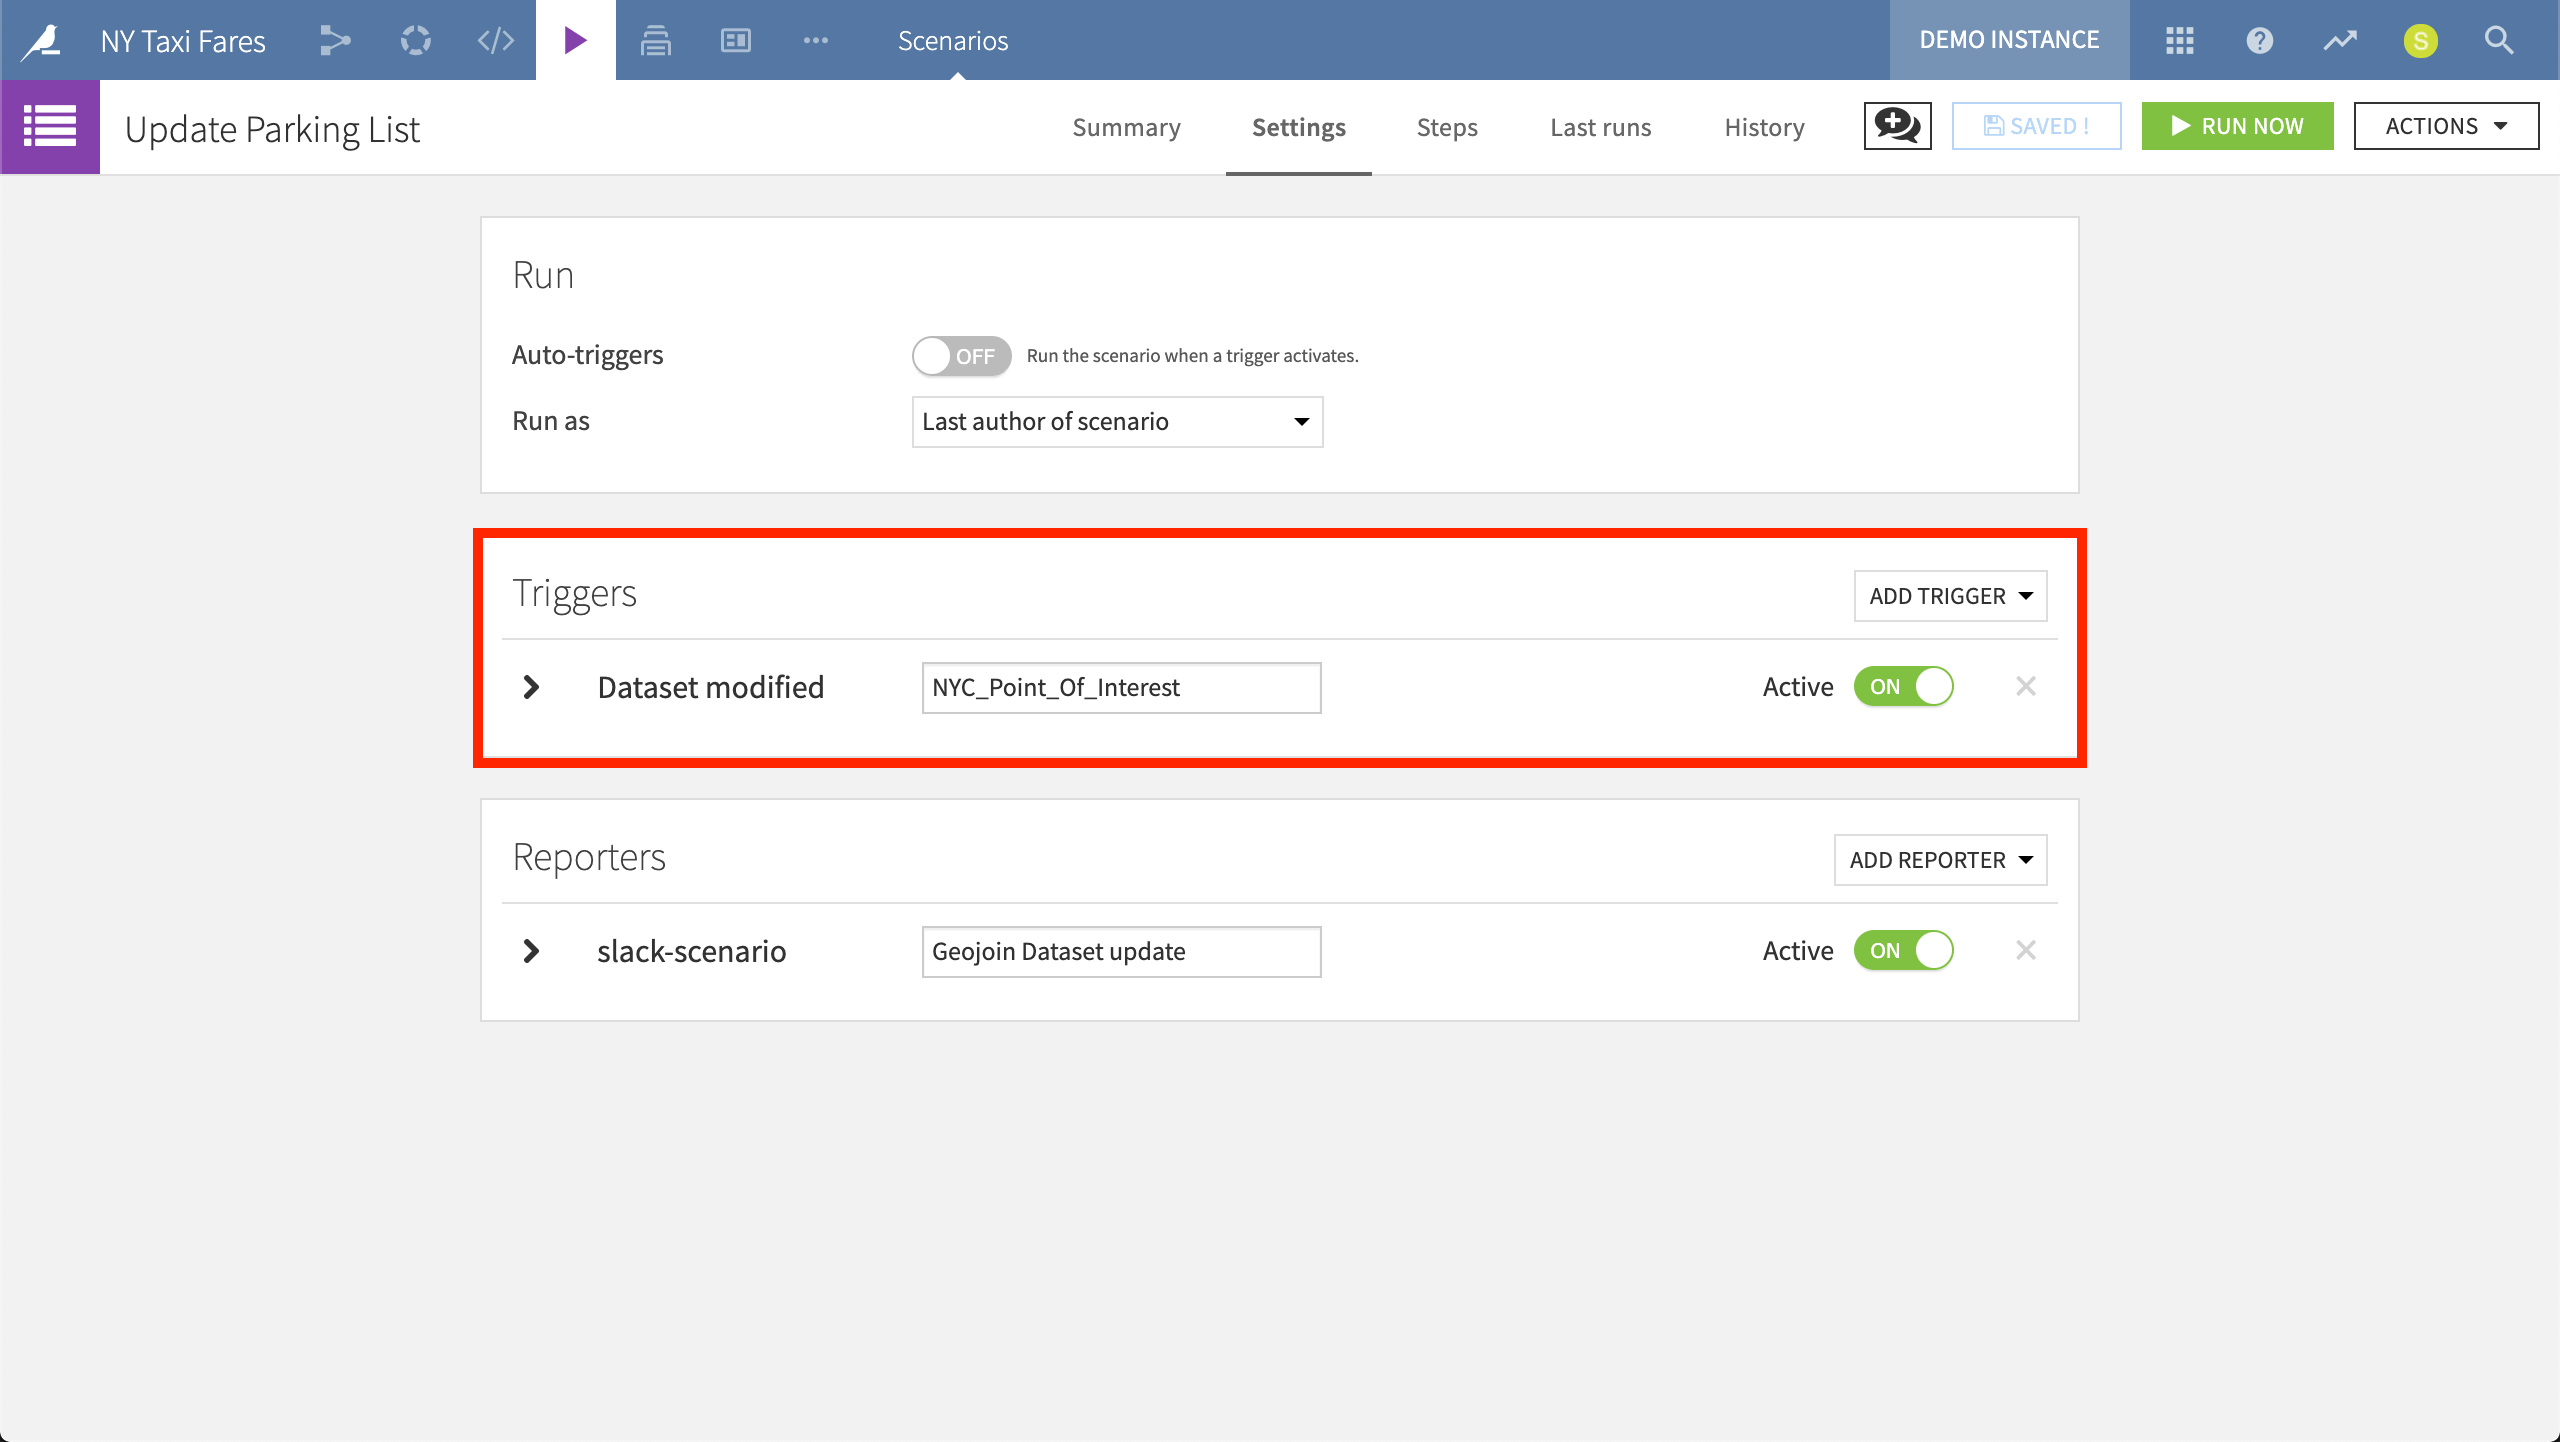
The “Update Parking List” scenario will run the job described in the Steps tab whenever its trigger is activated — in this case, whenever the NYC_Point_Of_Interest dataset is modified.
DSS includes a library of predefined steps, such as those for retraining a model, computing certain metrics, creating an export, or updating variables. At the same time, coders can devise their own custom scenarios, executing SQL or Python code.
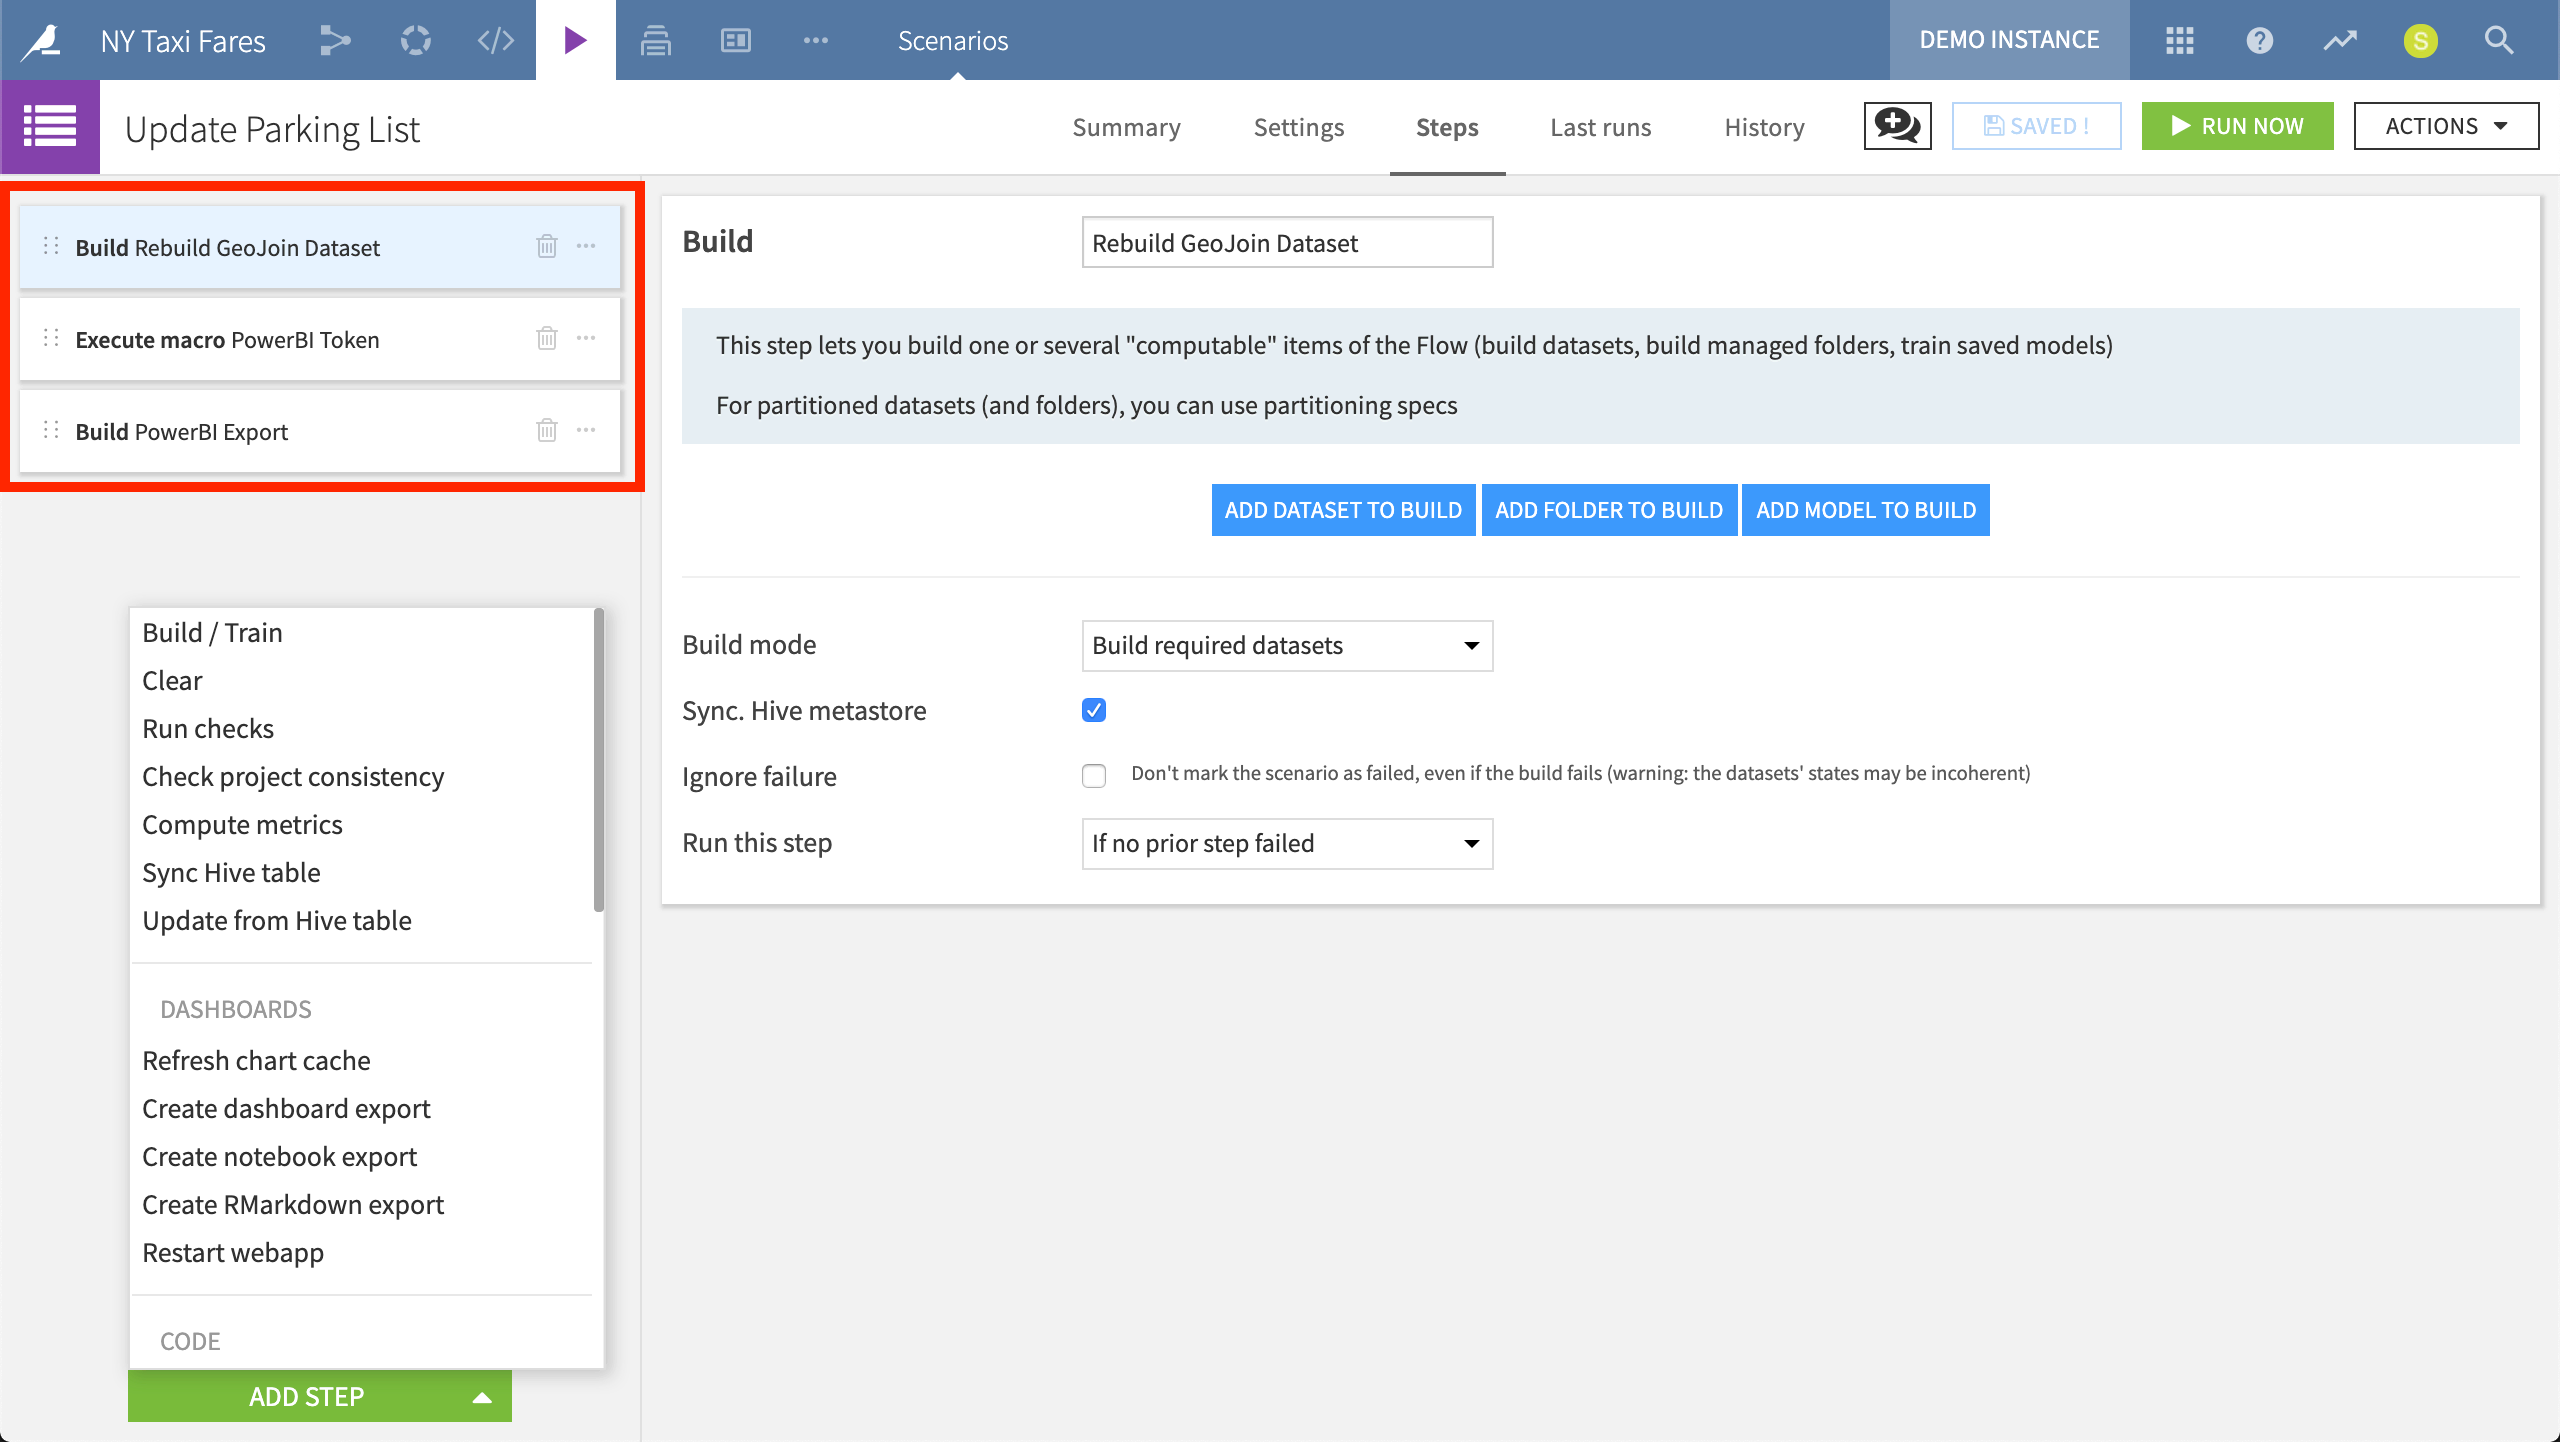
The “Update Parking List” scenario consists of three predefined steps: rebuilding a particular dataset, executing a macro, and building an export.
In order to keep all stakeholders informed of scenario activity, users can also attach reporters. Scenario reporters can be executed before, during or after the completion of a scenario run. Messages can be sent via email or integrated with services like Hipchat, Twilio, Webhook, Microsoft Teams, or Slack (as done for the “Update Parking List” scenario above). For greater customization, such as pulling less common variables from the DSS instance, a custom Python script can be used to generate messages.
Monitoring with Metrics and Checks
Having established scenarios to monitor the status of a project, it becomes important to be able to track patterns of success and failure over time. DSS provides a Monitoring menu, where users can examine which scenarios are currently running and the performance of past runs.
In addition to this dashboard, DSS provides two important monitoring tools, metrics and checks:
Metrics provide a way to compute various measurements on objects in the Flow, such as the number of records in a dataset or the time to train a model.
Checks allow users to establish conditions for monitoring metrics. For example, users can define a check that verifies that the number of records in a dataset never falls to zero. If the check condition is no longer true, the check will fail, and the scenario will fail too, triggering alerts.
Metrics for a dataset can be found on the Status tab. Common examples include the size of a dataset, the number of records, or basic statistics of a certain column. Metrics are automatically logged, which makes it easy to track the evolution of the status of a dataset.
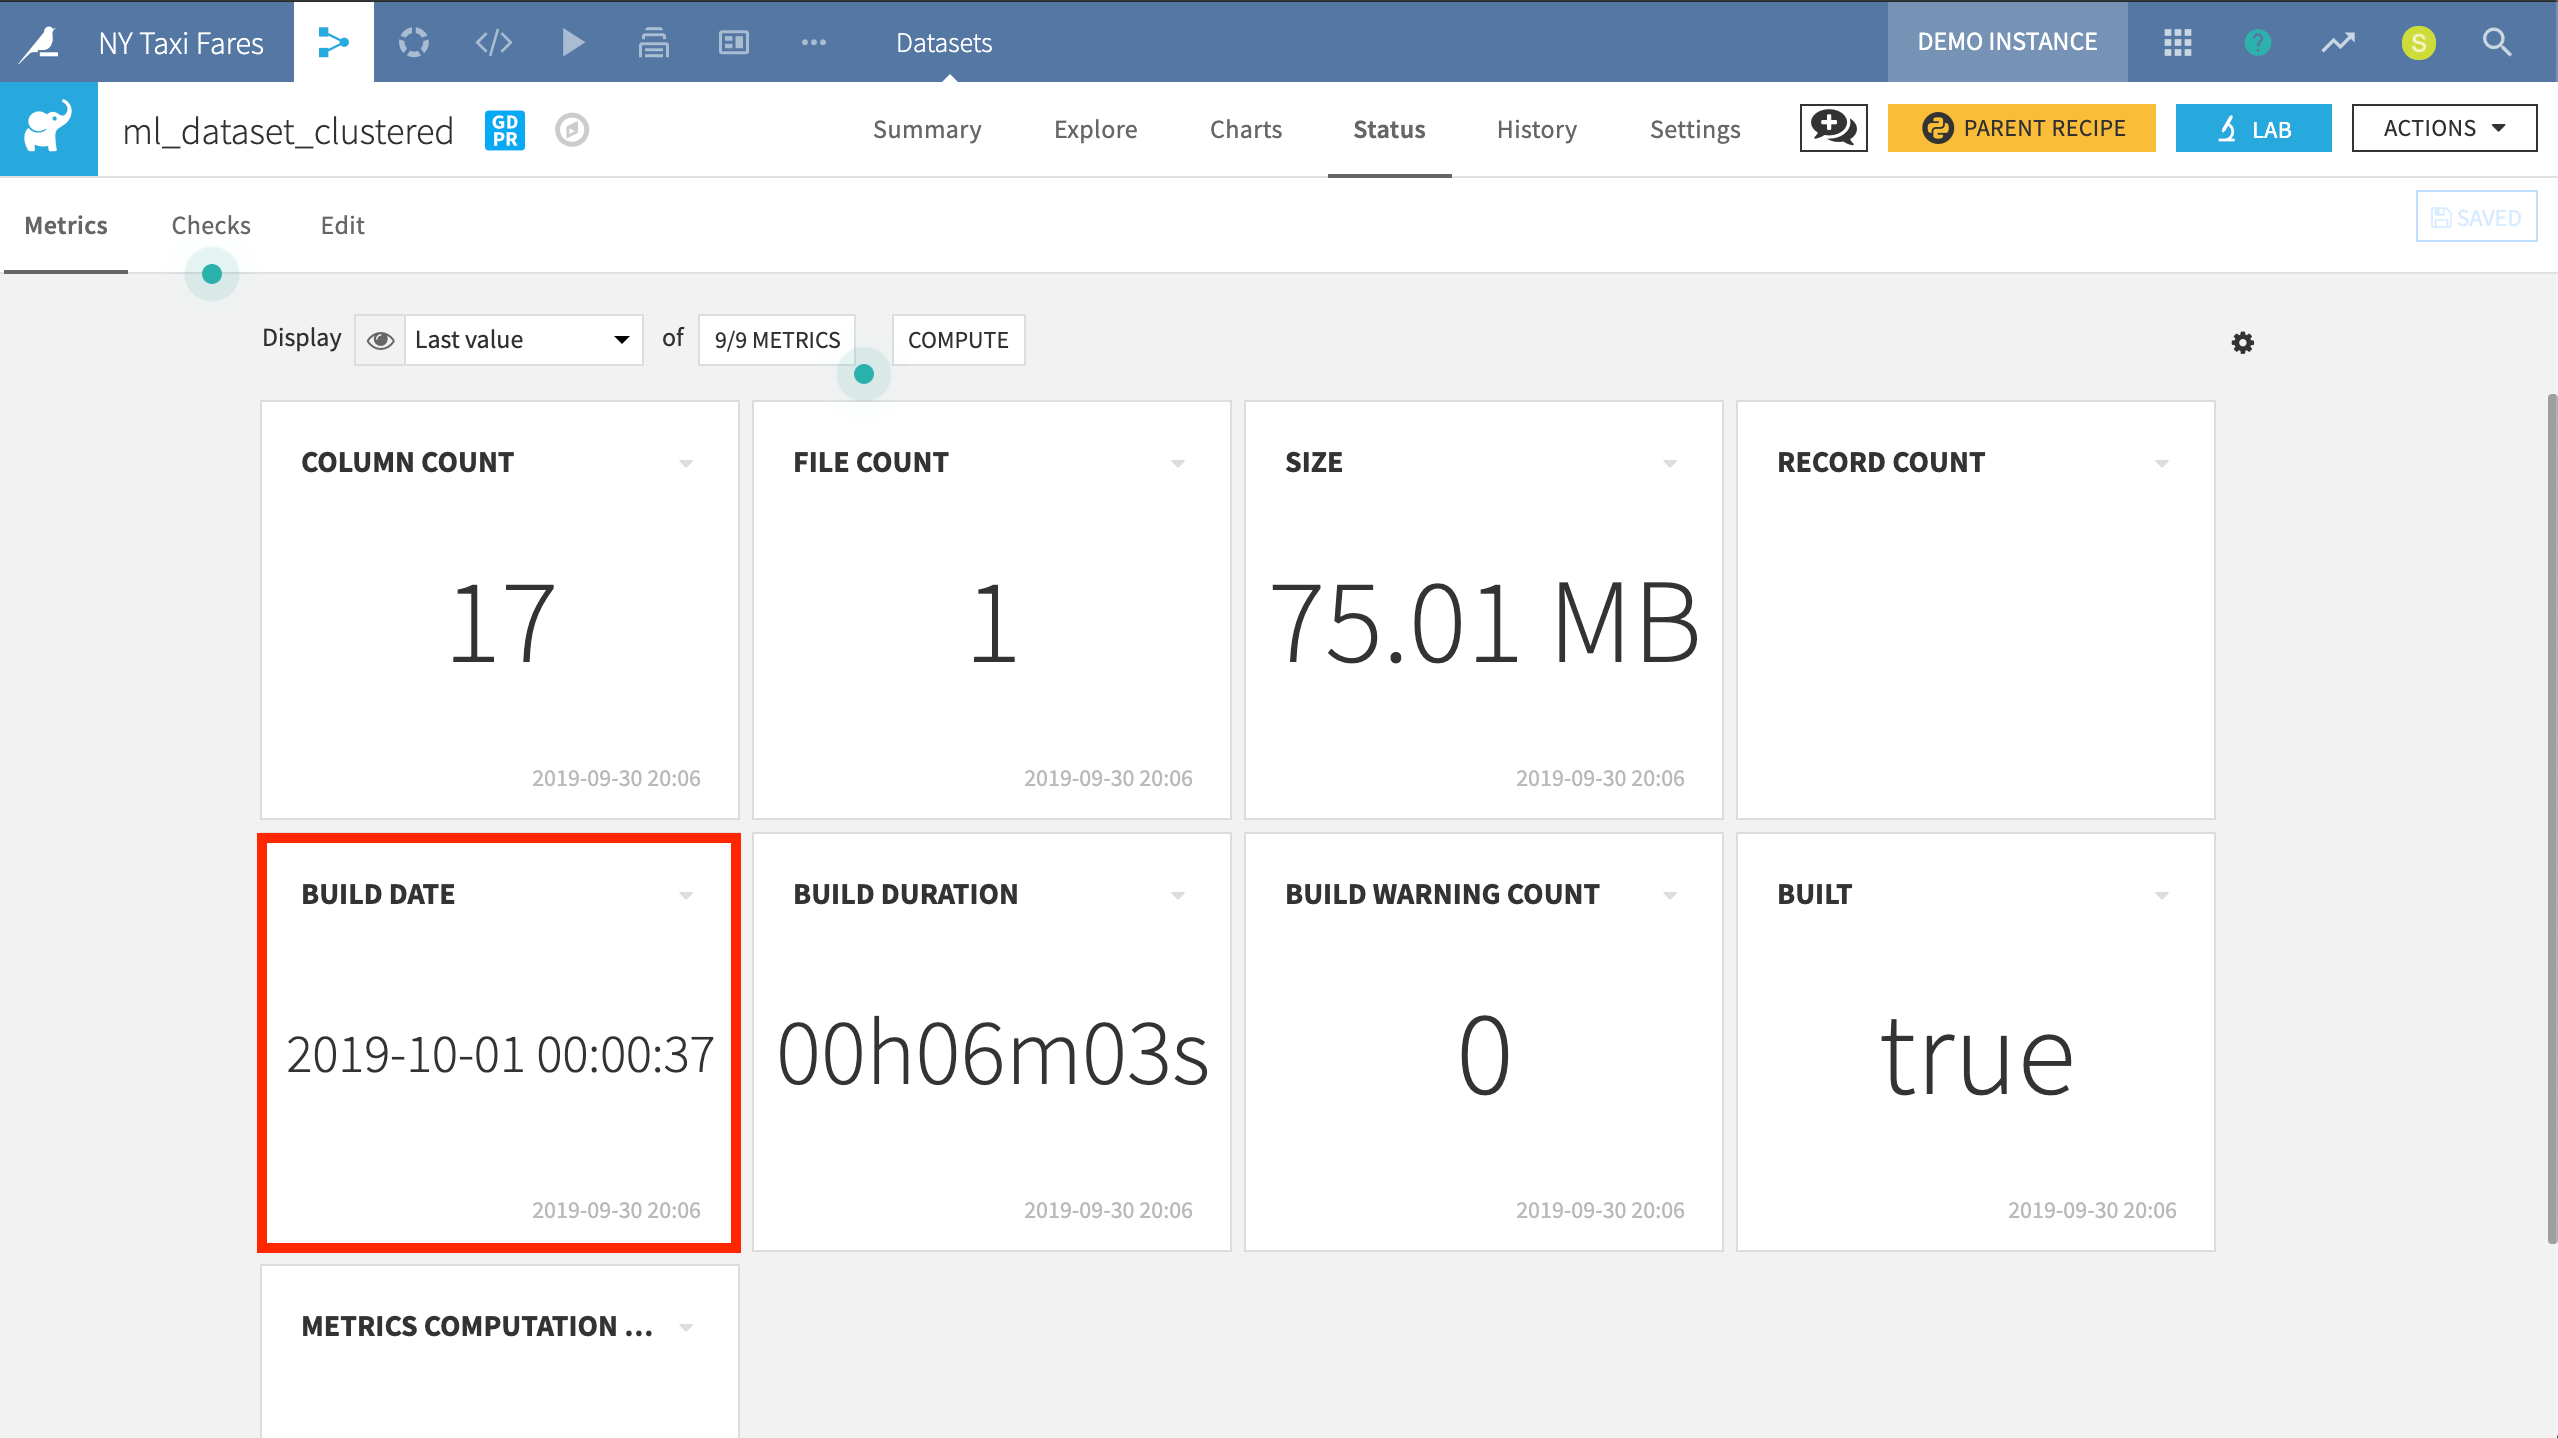
In this example, we have chosen to track metrics that are important to the project, such as the dataset’s last build date.
Once certain metrics have been identified, users can establish Checks on those metrics. By verifying a check is true, the system allows the user to attach hard or soft minimum or maximum values around key metrics to trigger warnings or failures.
For example, if the performance of a model is established as a metric, a check can be created to ensure a model is not put into production if it falls below a certain hard minimum. Similarly, the same tools can be used to perform data health checks, ensuring that the data meets certain standards before being used in reports or modeling tasks.
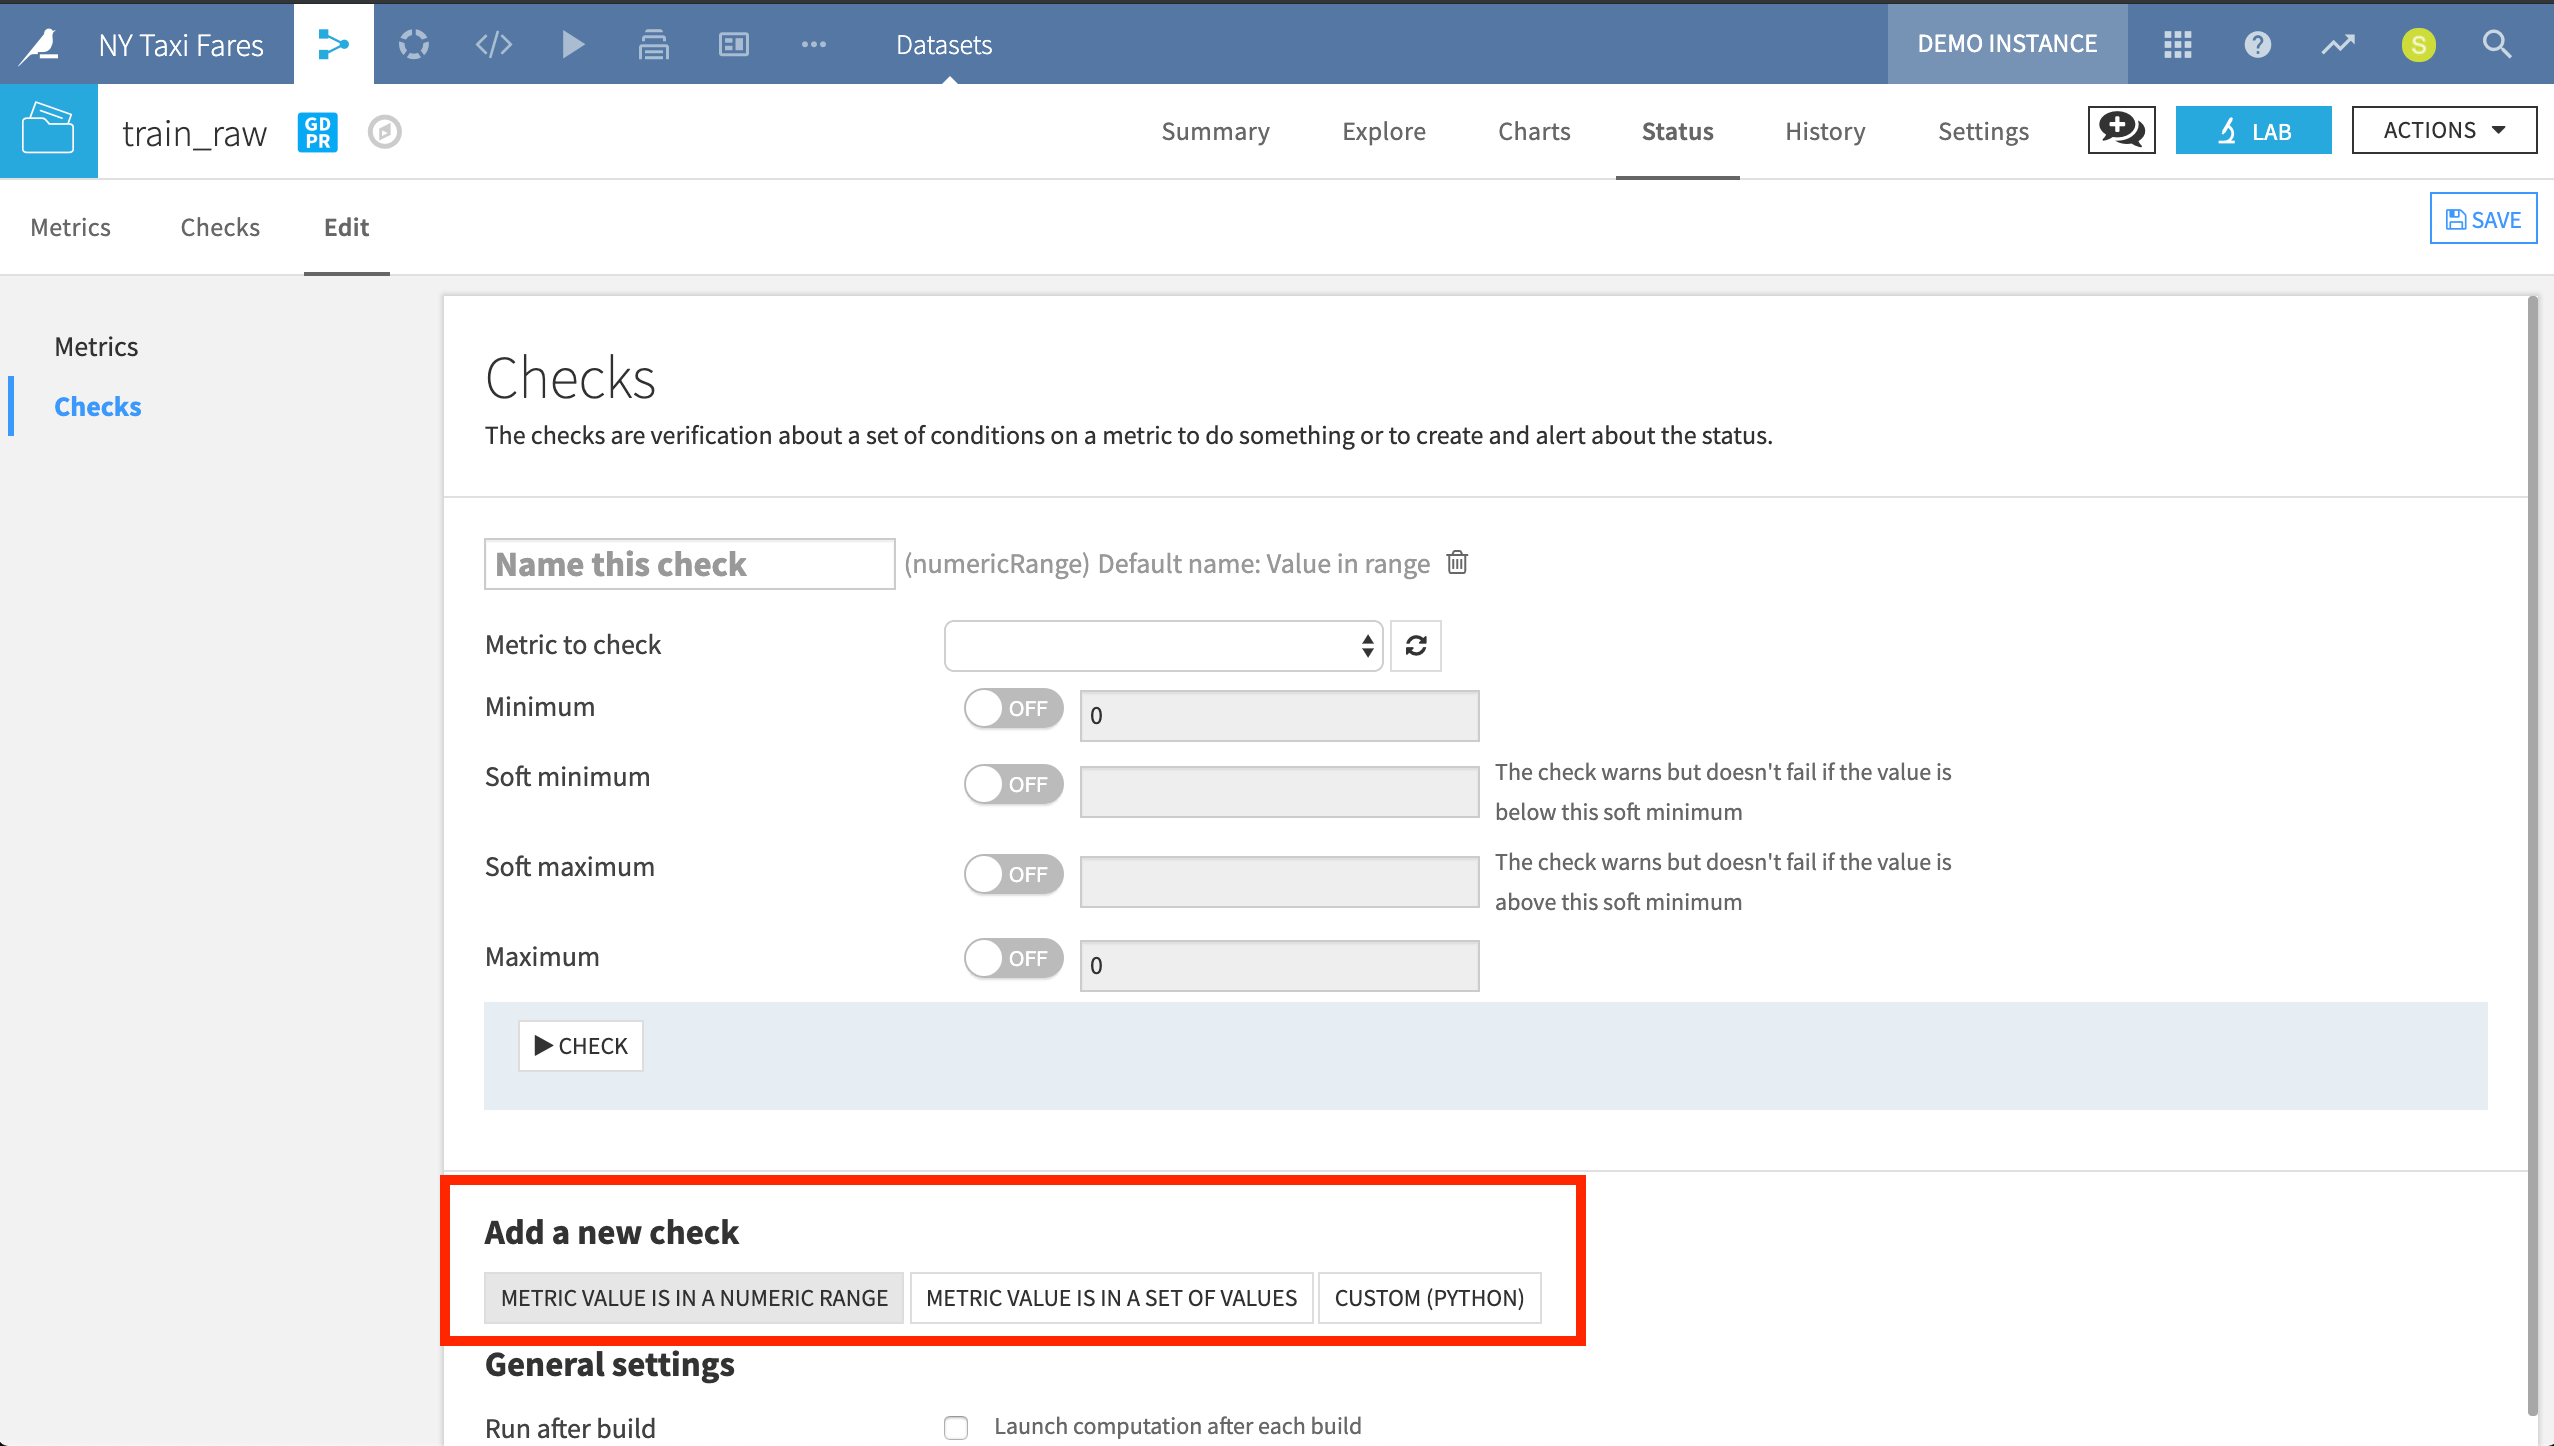
When creating a new Check, we can use a simple UI to monitor if a chosen metric is in a certain numeric range or in a particular set of values. Alternatively, we can entirely customize the Check with Python code.
Automation Node
Having created scenarios, metrics and checks in the Design node, one final step in the AI lifecycle of this project is to deploy the project to a production environment, in this case, the Automation node.
While the Design node is a development environment for testing new analyses, the Automation node is an isolated production environment for operational projects.
Starting from the Design node, projects are orchestrated by creating bundles, or complete snapshots of the project. A bundle includes the project configuration and possibly, selected data, folders and models. These bundles are then uploaded to the Automation node. Once activated on the Automation node, scenarios created in the Design node can be activated, and production data can now be used as inputs in the Flow.
With a project deployed in a separate production environment, it is essential to be able to monitor performance. DSS makes it easy to maintain version control over bundles deployed in production through a simple UI. Whenever updates are made in the Design node, a new project bundle can be uploaded and activated on the Automation node. Moreover, the bundle currently in production can easily be rolled back to a previous version whenever necessary so that end users never experience failure.
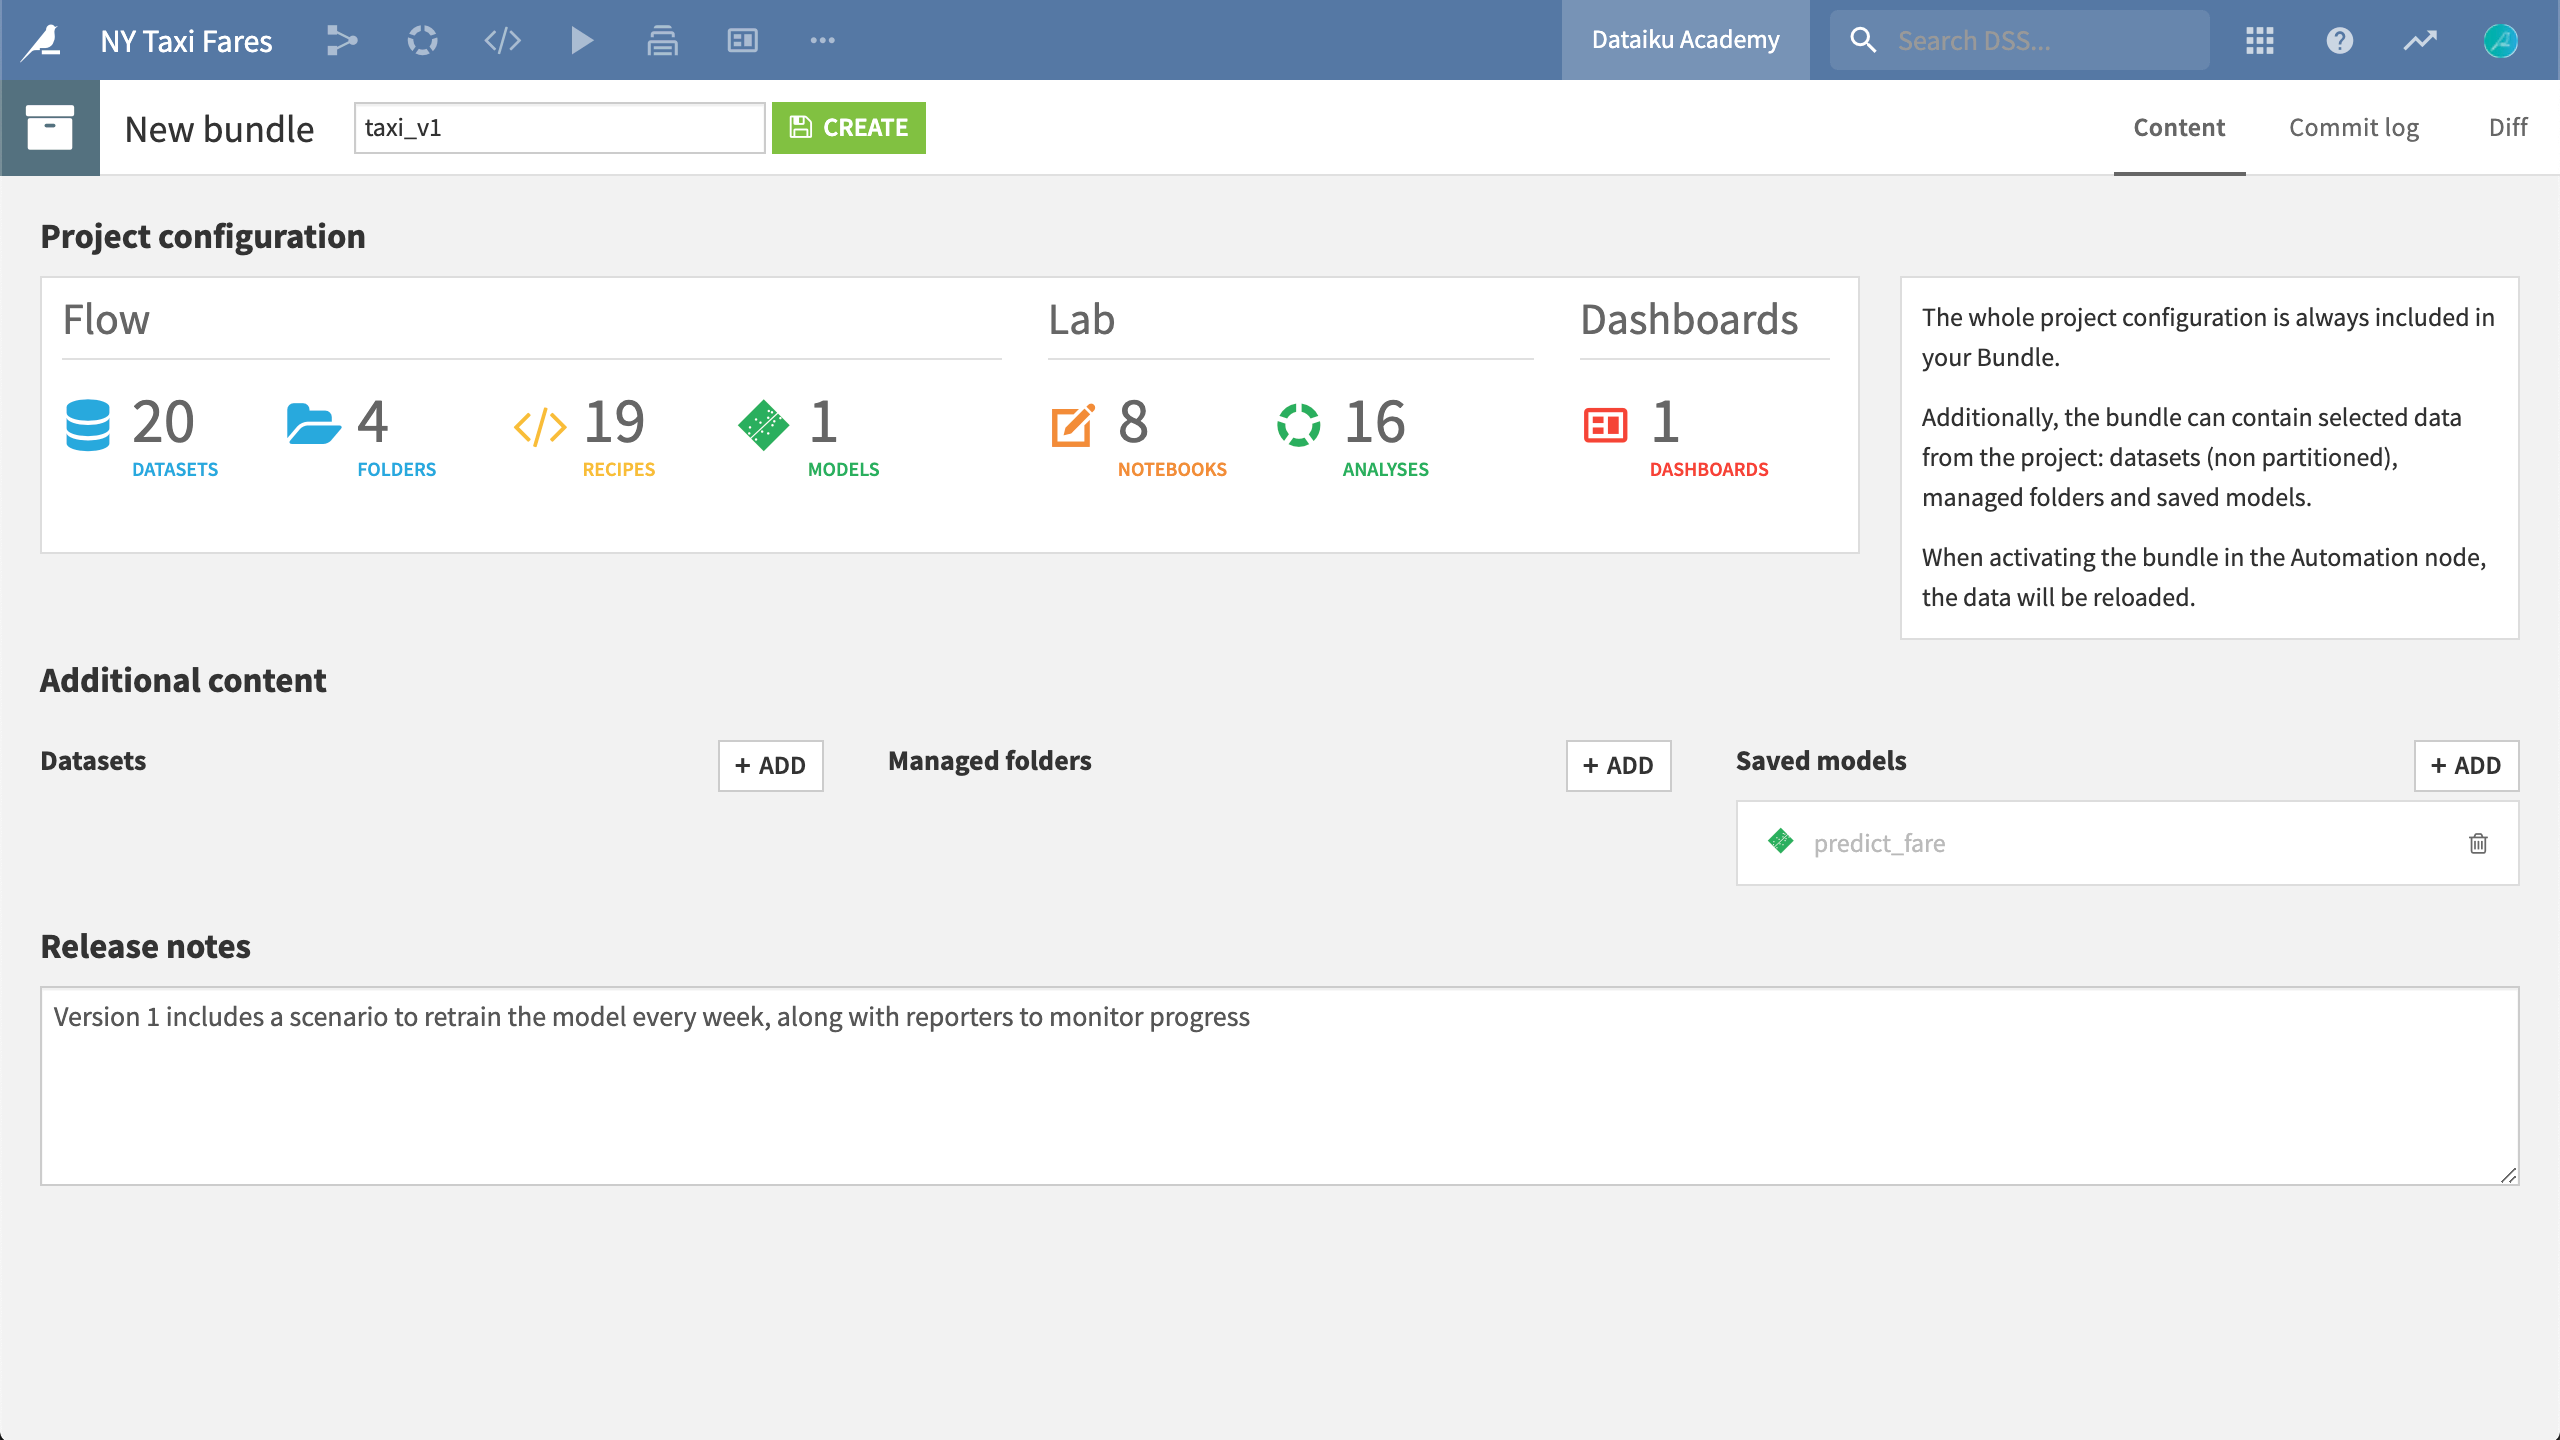
In order to upload this project to the Automation node, we first need to create a bundle, including the saved model.
Communicating Results
A key part of any analytics process is communicating results. In addition to scenario reporters providing notifications about the status of automated tasks, users can create insights and dashboards, web apps, and R markdown reports to communicate progress with diverse groups of stakeholders.
Insights & Dashboards
Any DSS project can have an arbitrary number of dashboards. Dashboards consist of slides, which themselves are made of tiles. These tiles can hold insights. Insights can include any DSS object, such as a chart, dataset, web app, model reports, metrics, and more.
Using the groups-based permissions framework, dashboards are also particularly useful for communicating end results with users who may not have full access to a project, and perhaps, the sensitive data it may contain. This provides a path for enterprises to enforce robust data governance policies without hampering collaboration.
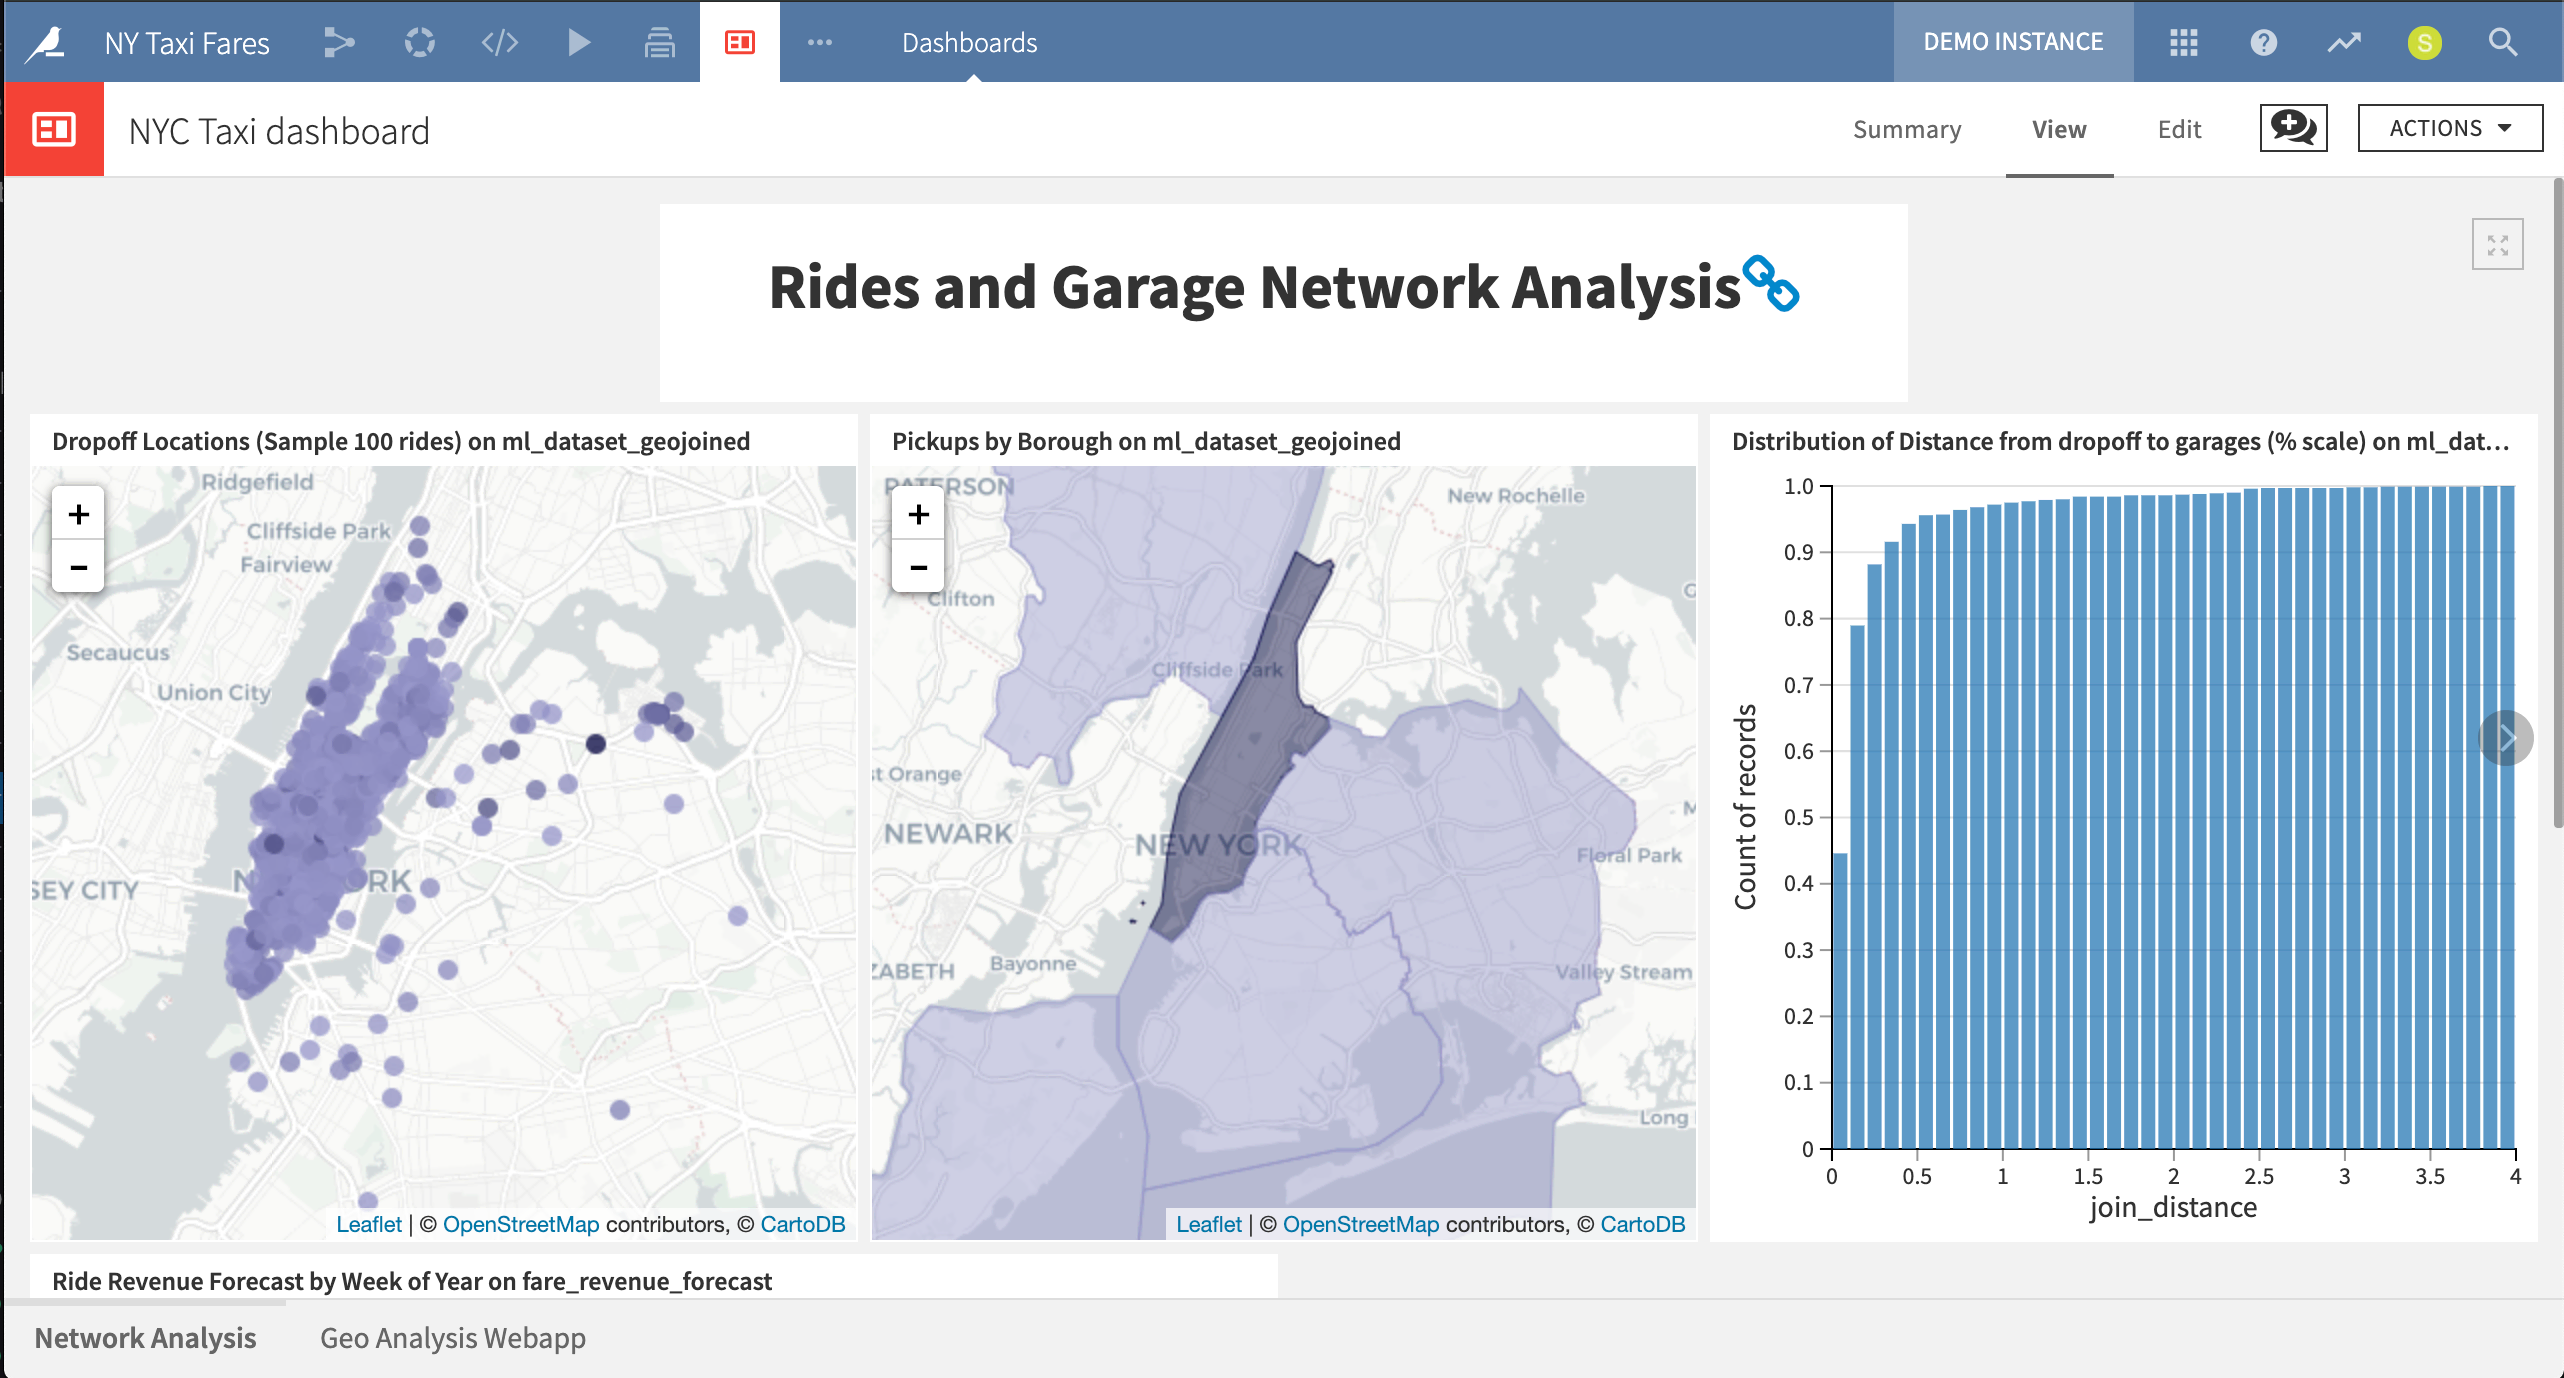
This project dashboard displays network analysis visualizations, including maps of dropoff locations and plots of ride revenue forecast.
Web Apps
One particularly powerful type of insight made easy in DSS is the web app. These interactive visualization tools can be “standard” (written directly in HTML, CSS, and JavaScript). Alternatively, they can be written in the popular libraries Bokeh or Shiny for Python and R users, respectively.
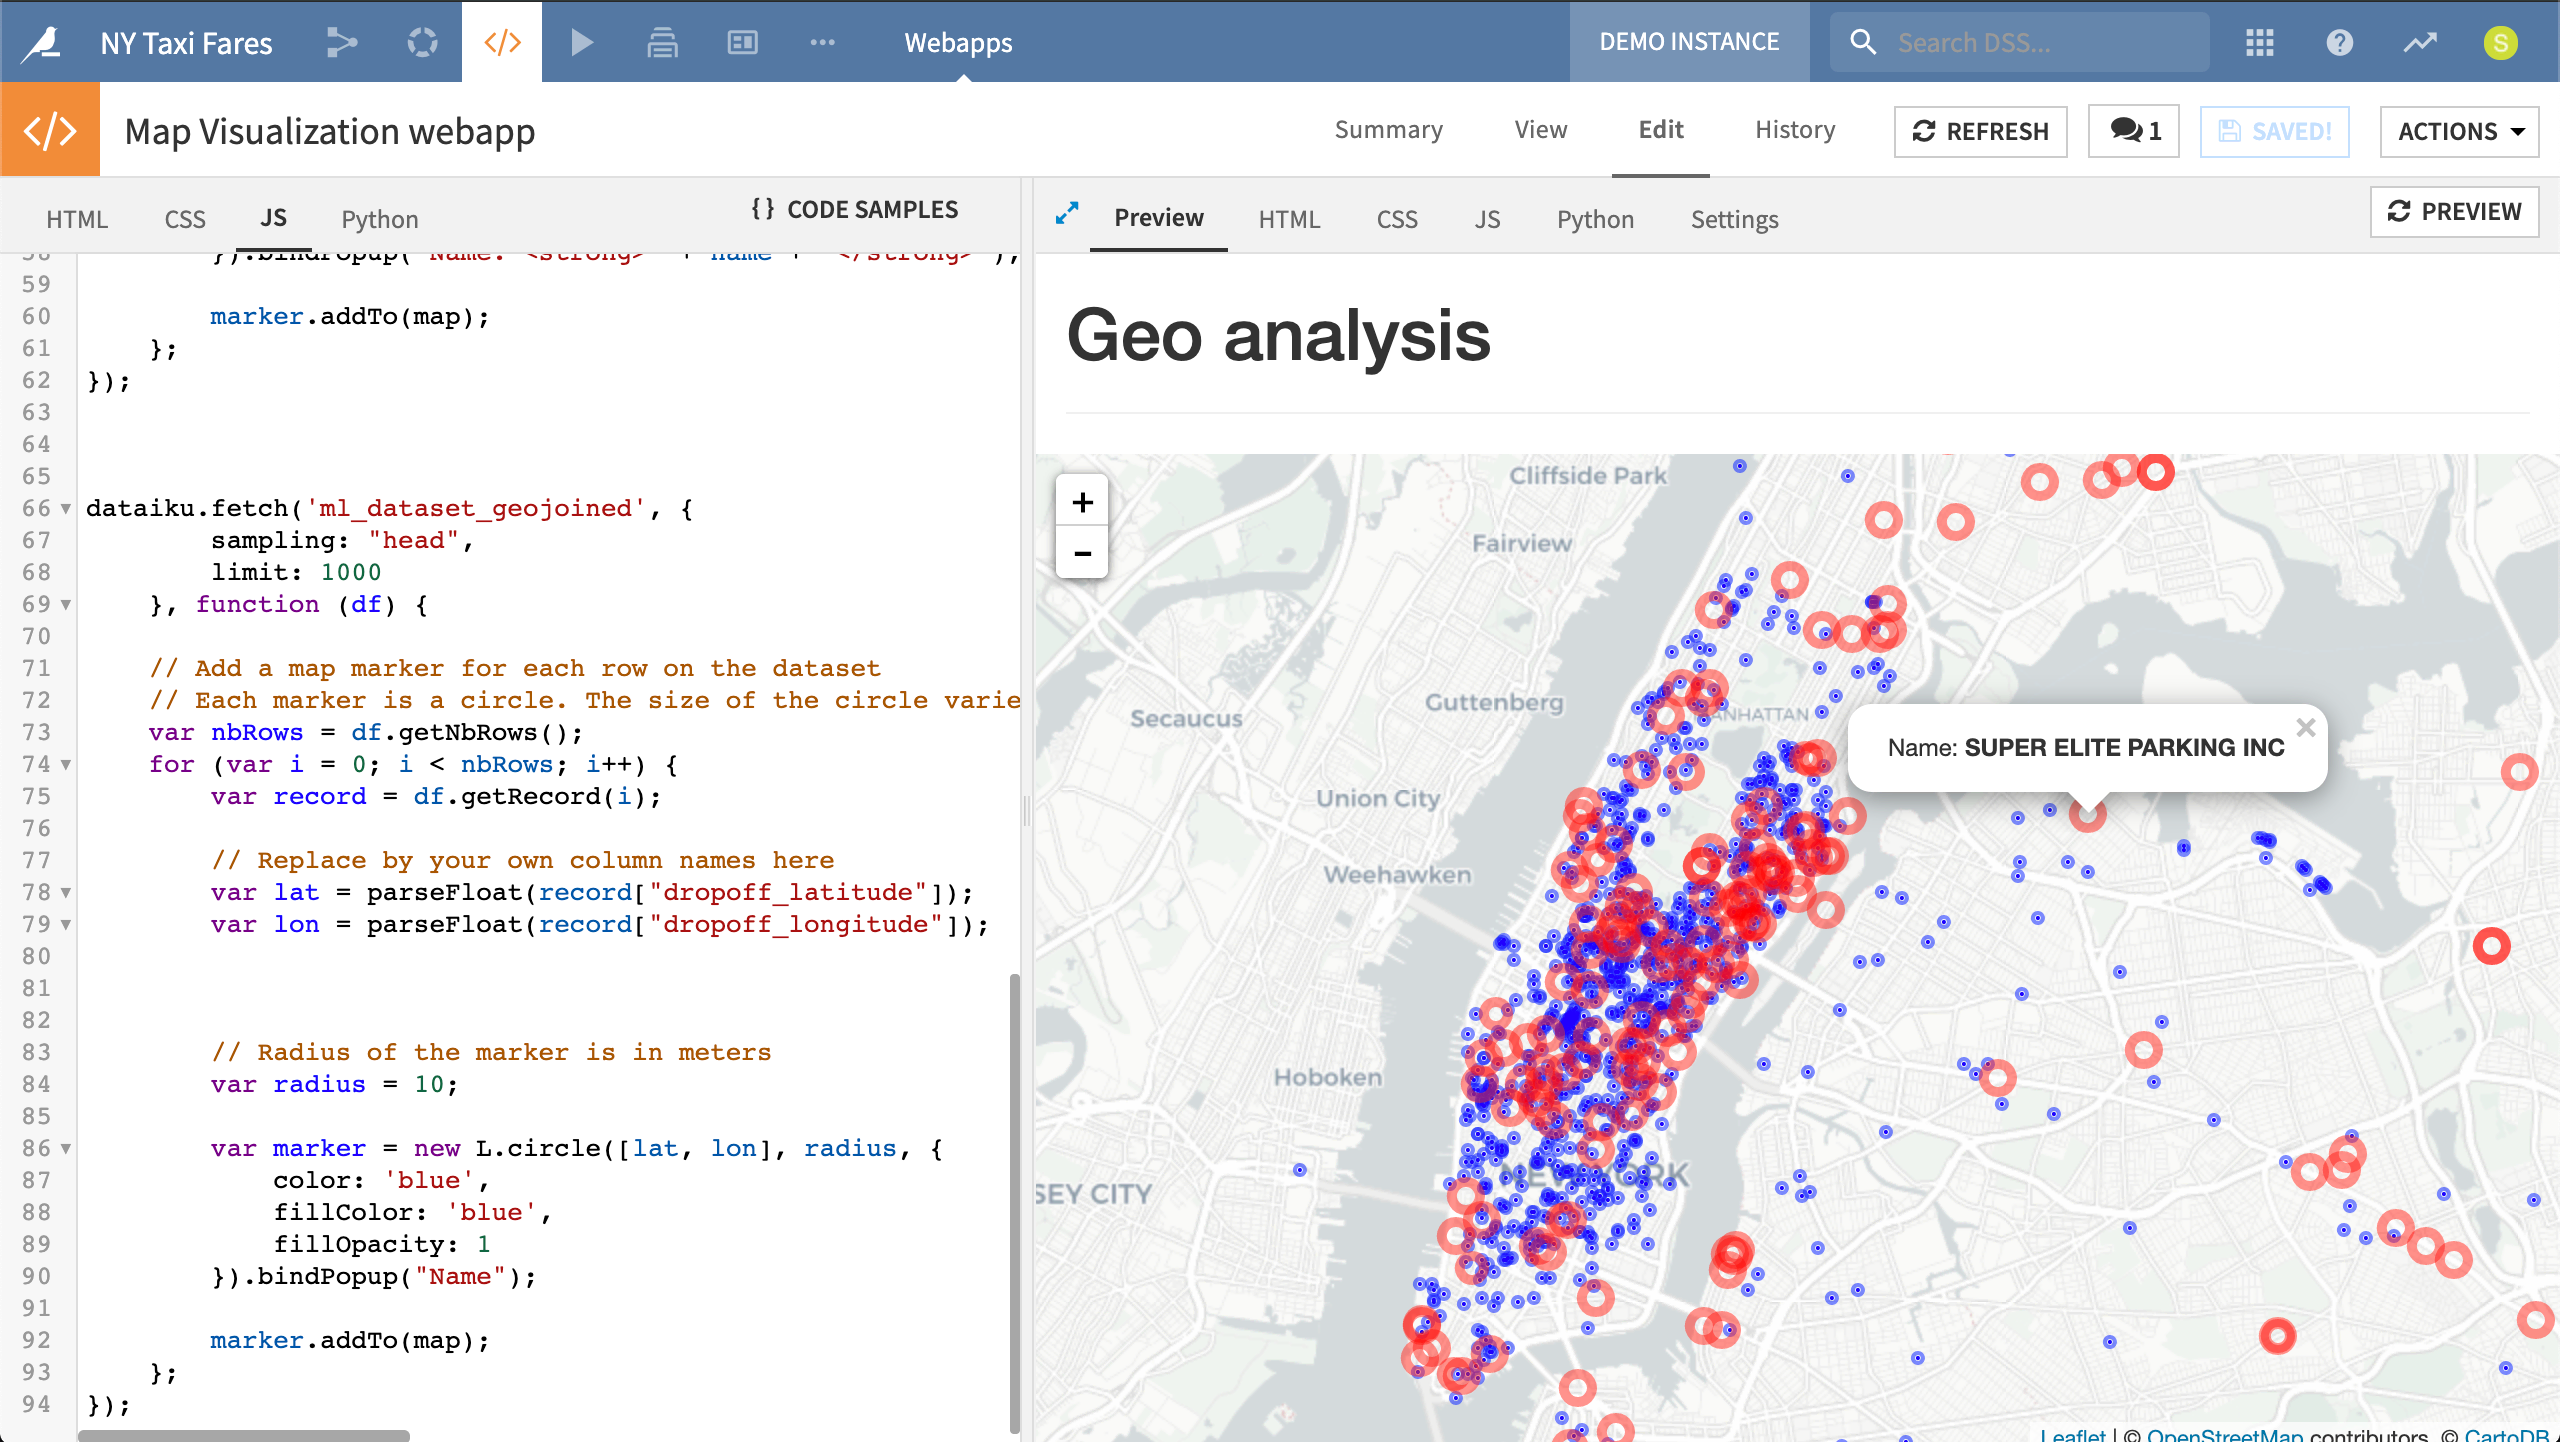
In addition to the taxi fare prediction app deployed as an API, this project developed a simple internal HTML and JavaScript web app to visualize parking garages in red and dropoff locations in blue.
R Markdown Reports
Given that DSS allows users to code in languages like Python and R, it should not be surprising that R Markdown reports are another tool at the disposal of users. The familiar collaboration layer of DSS, however, remains on top, providing users with tools like tags, to-do lists, and discussions.