Hands-On: Getting Started with NLP
In this series of hands-on exercises, we will be working with a dataset of movie reviews. 1
Our problem is a basic kind of sentiment analysis. It is a binary classification task: is the movie review positive or negative? Our goal is to train a model on the text of a movie review that can predict the polarity of each review.
Over the next three lessons, we will explore the data, build a simple model, and iteratively improve its performance through text cleaning, feature engineering, and different text handling strategies.
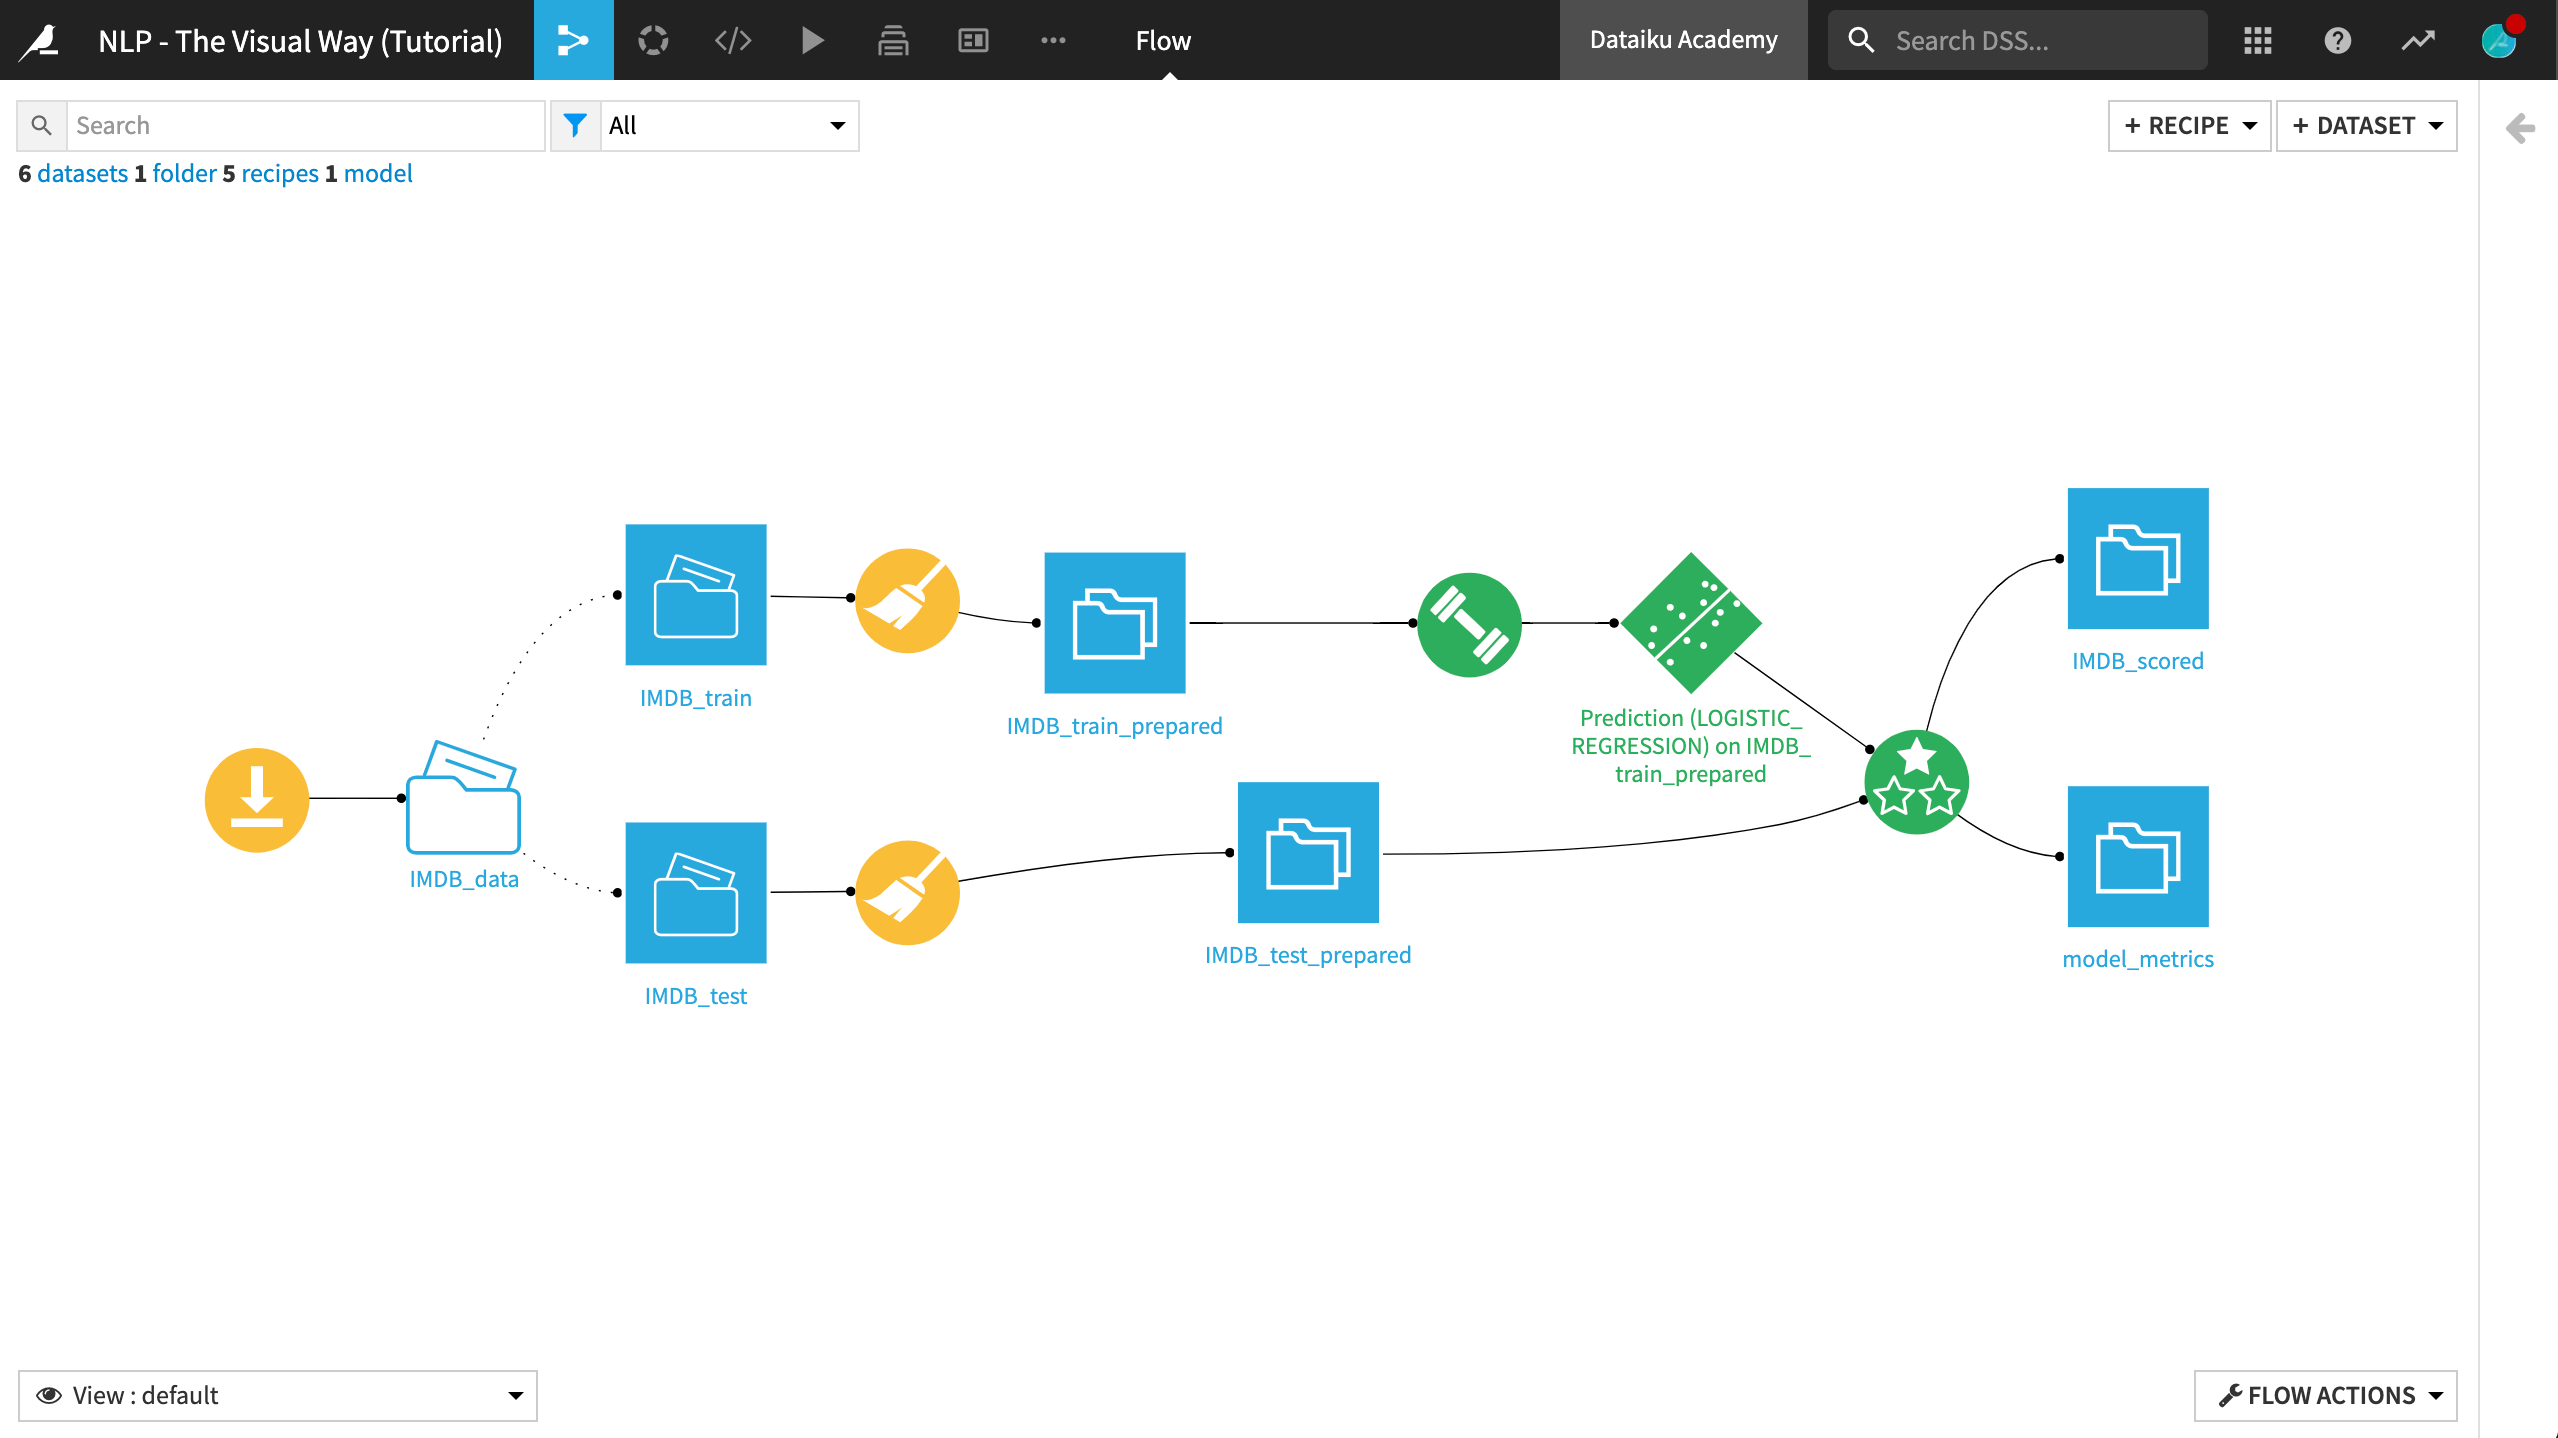
The final Flow will resemble the one below.
Prerequisites
This tutorial starts with a new project, and so completion of other courses is not required. It will, however, draw on topics covered in the Machine Learning Basics and Scoring Basics courses, and so their completion is strongly suggested.
Create the Project
From the Dataiku homepage, click +New Project and select DSS Tutorials from the list. Choose ML Practitioner from the left, and select NLP - The Visual Way (Tutorial). Click on Go to Flow.
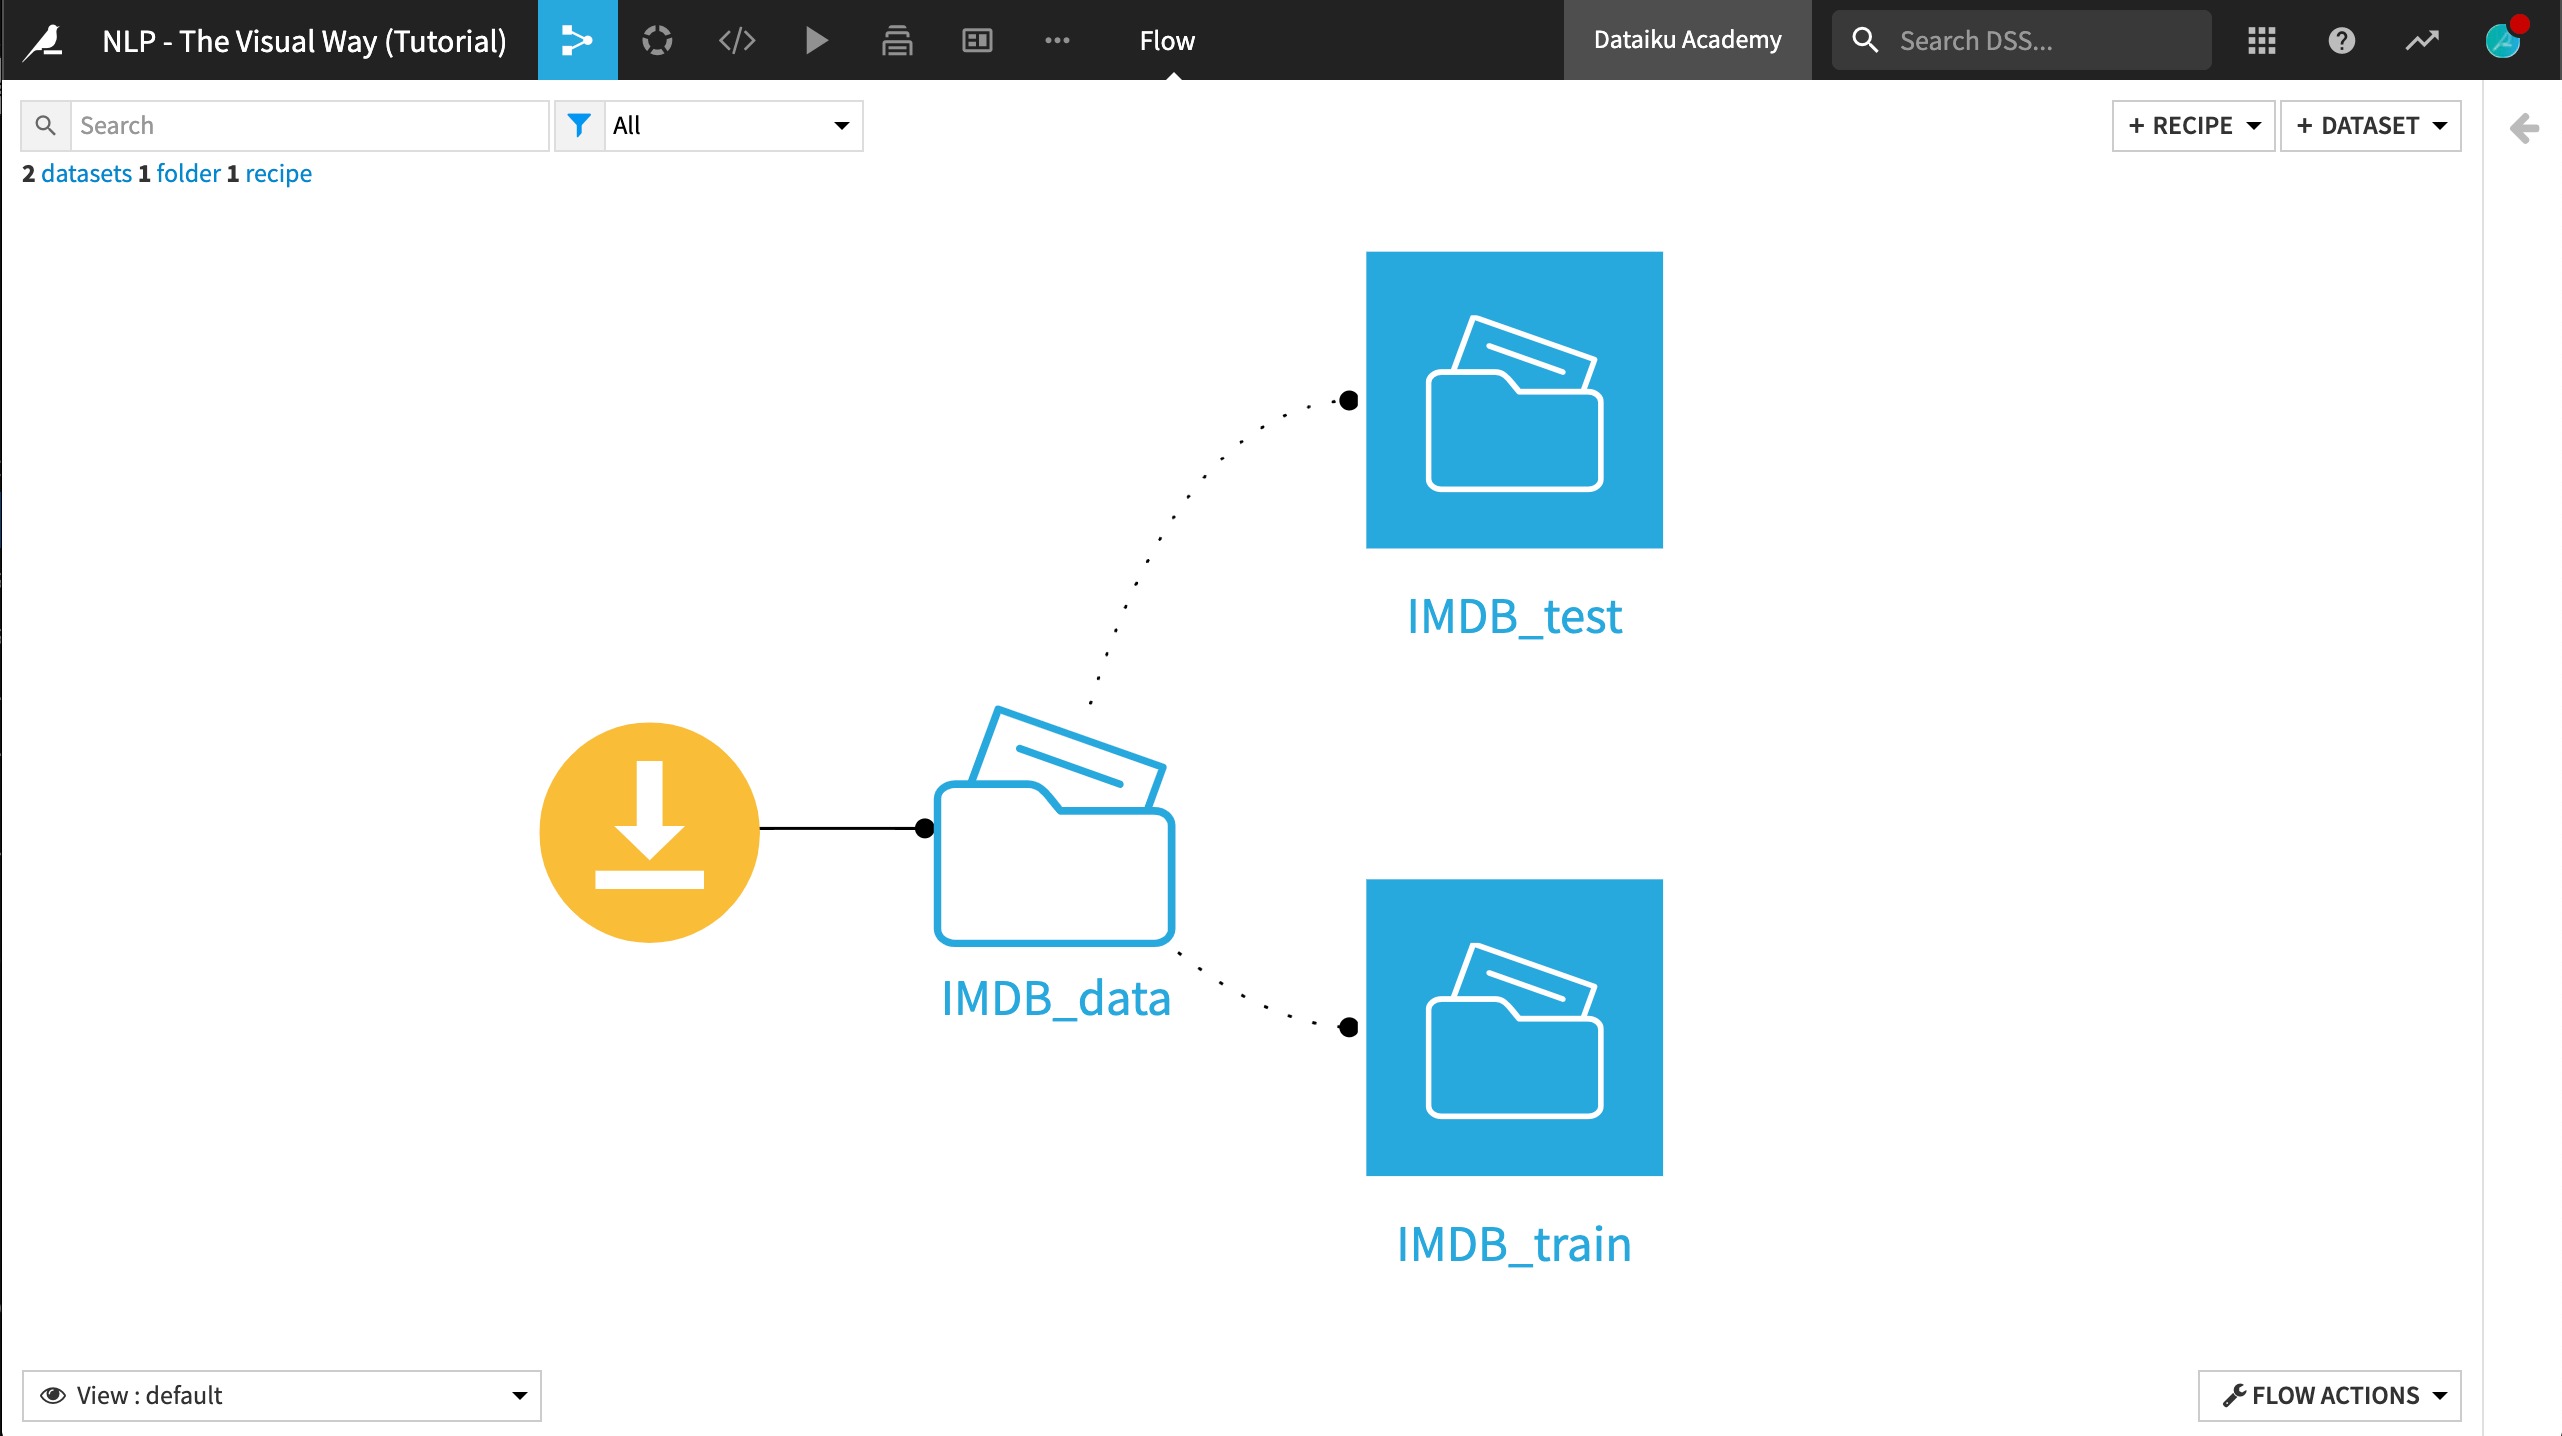
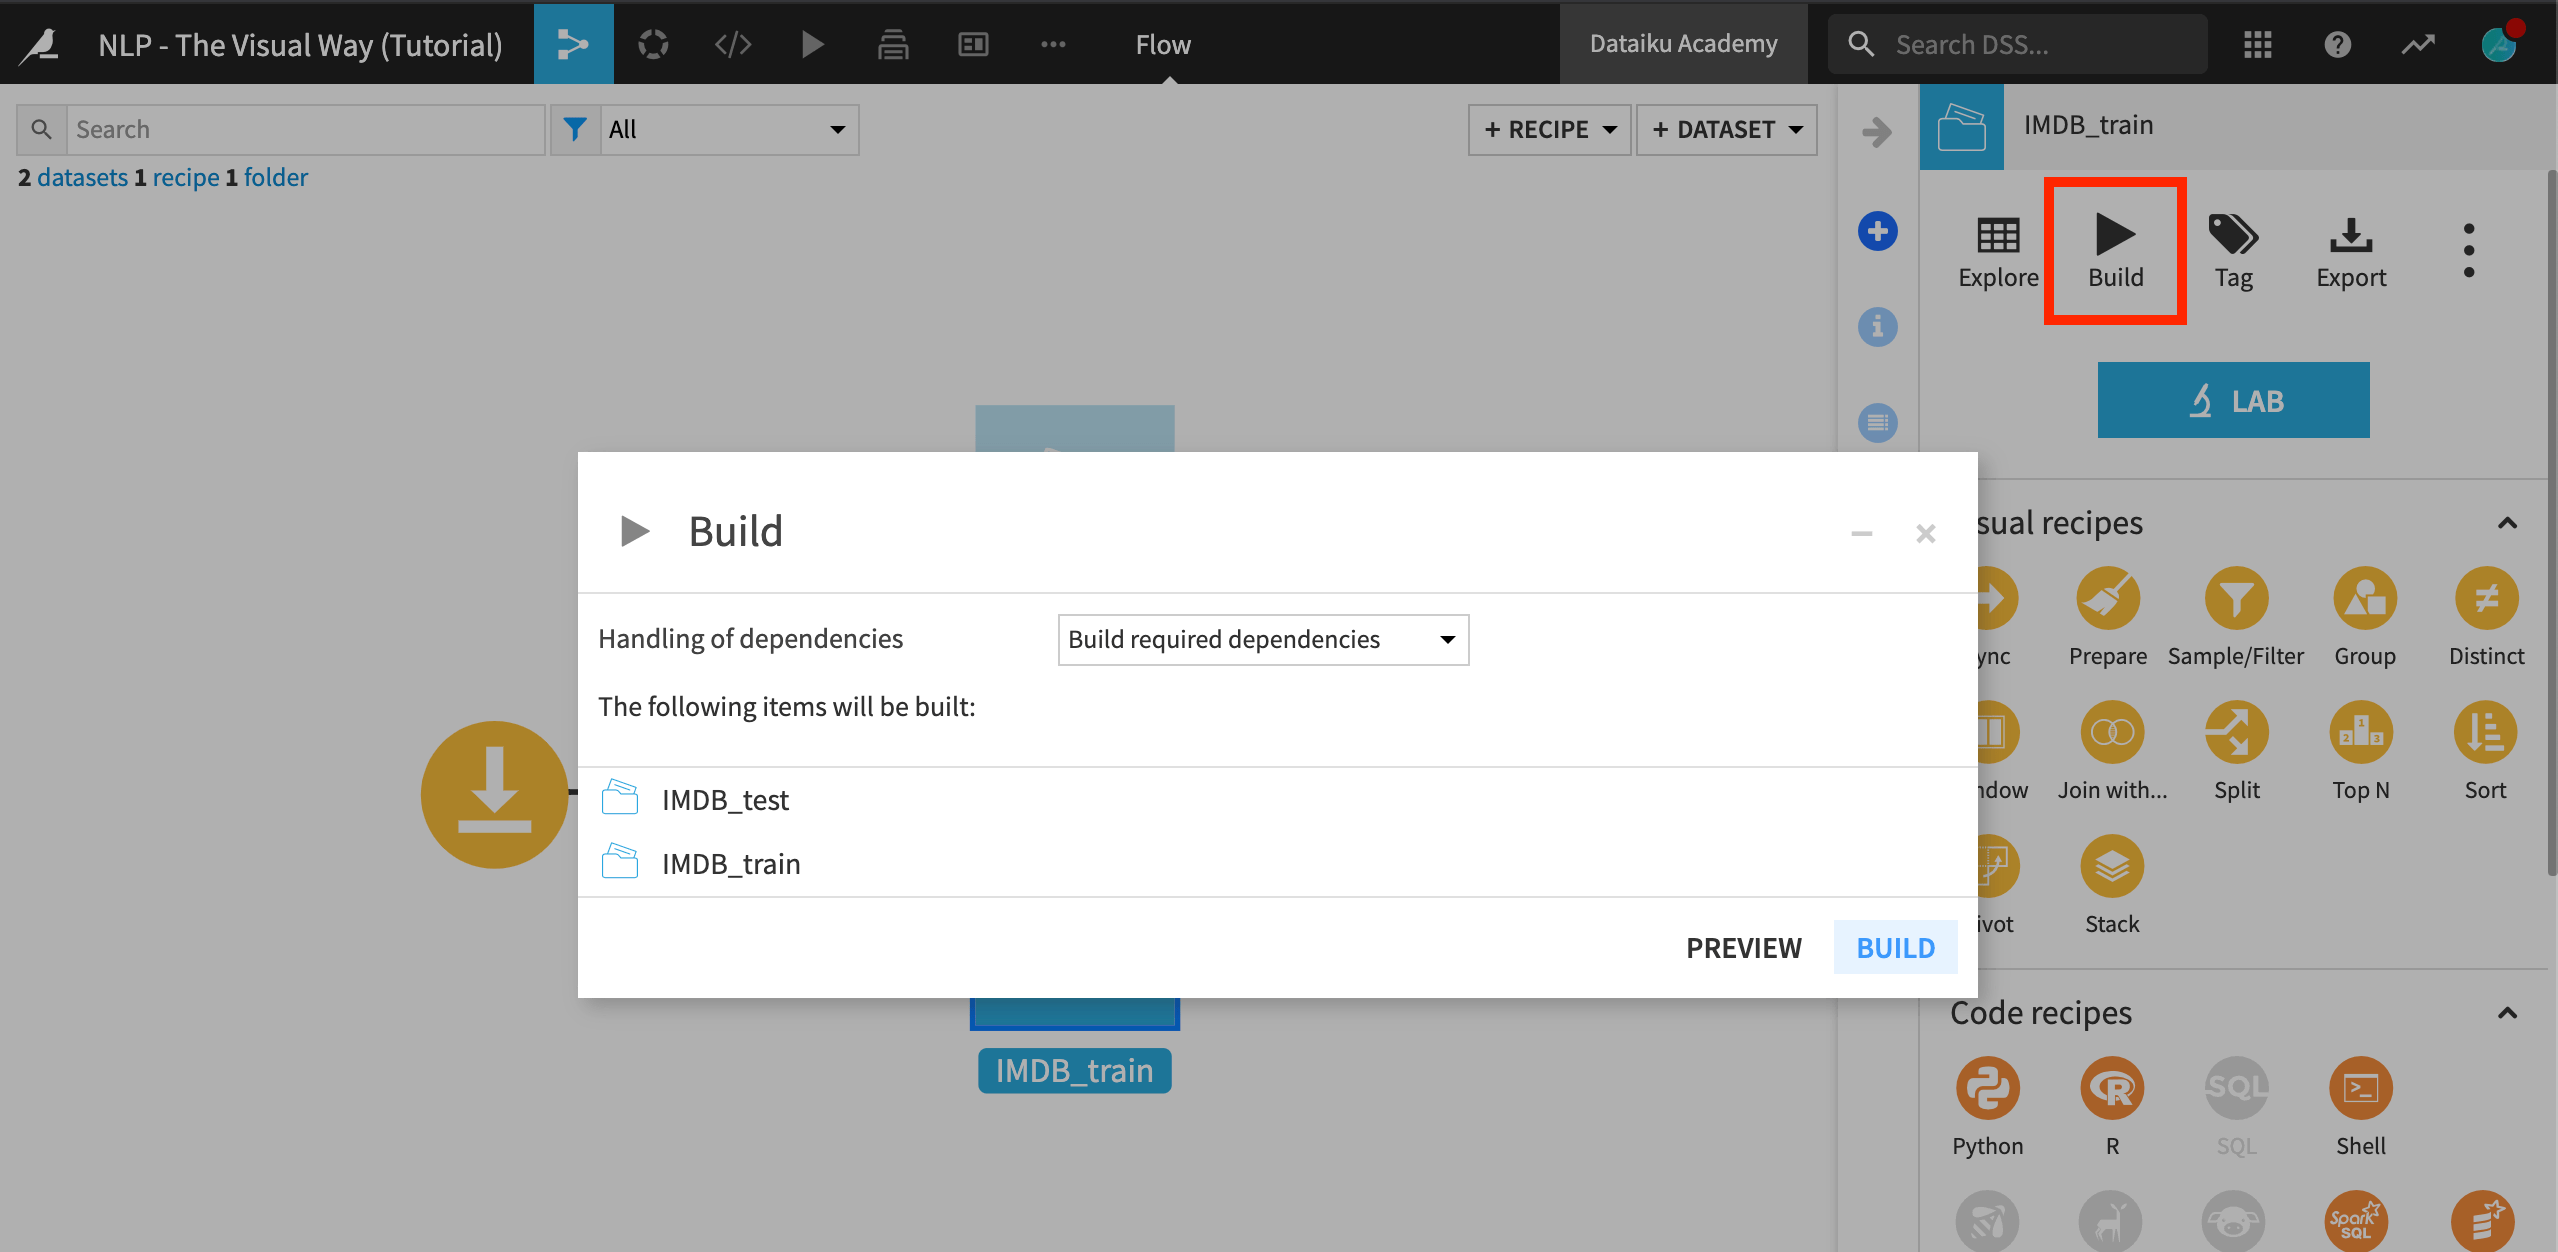
Select the IMDB_train and IMDB_test datasets. In the Actions sidebar, click Build. This may take a few minutes while Dataiku DSS downloads the data from the host server into the IMDB_data folder through the Download recipe.
Explore the Data
There are two datasets in the Flow, one containing training data and the other containing testing data.
We will use IMDB_train to create the model. IMDB_test will be our test dataset. We will use it to have an estimate of the model’s performance on data that it did not see during the training process.
Check the Details and Schema tab in the right sidebar for both train and test datasets.
Calculate the number of records in each.
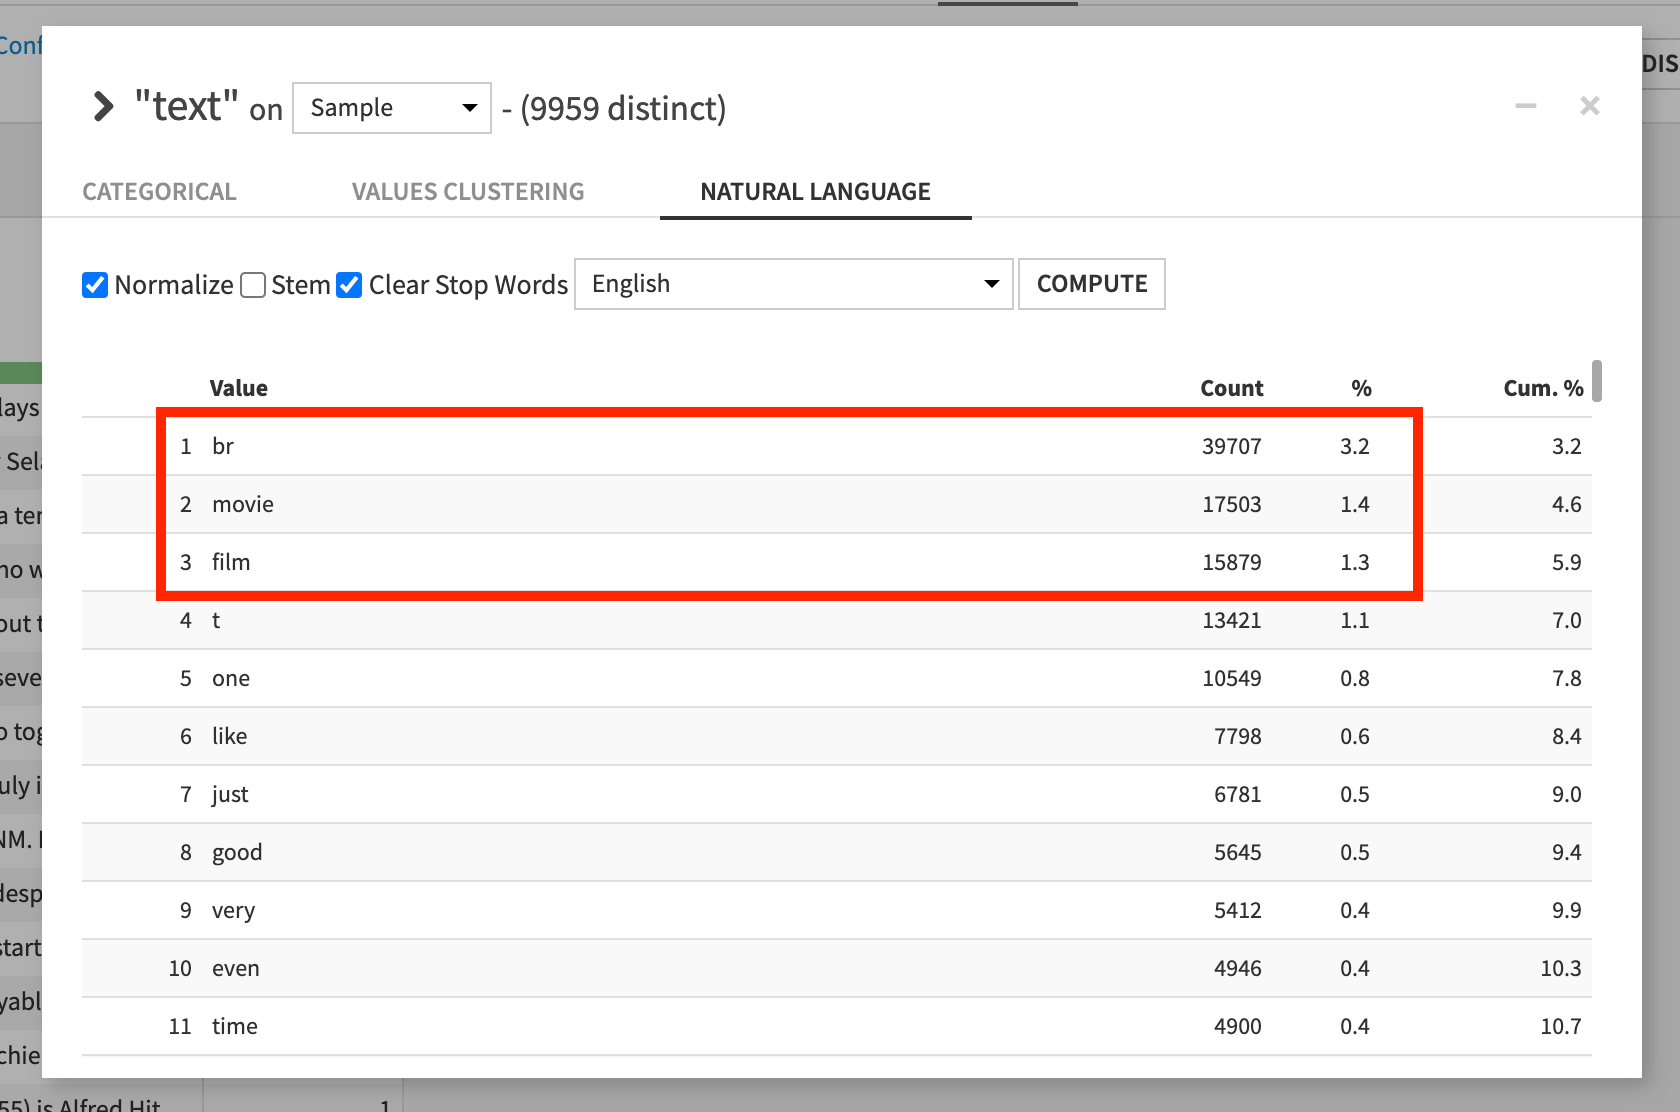
Explore the IMDB_train dataset and then use the Analyze window on each column. While on the text column, note the following:
In the Categorical tab, a small number of records are duplicates.
In the Natural Language tab, the most frequent words include “movie”, “film”, and “br” (the HTML tag for a line break).
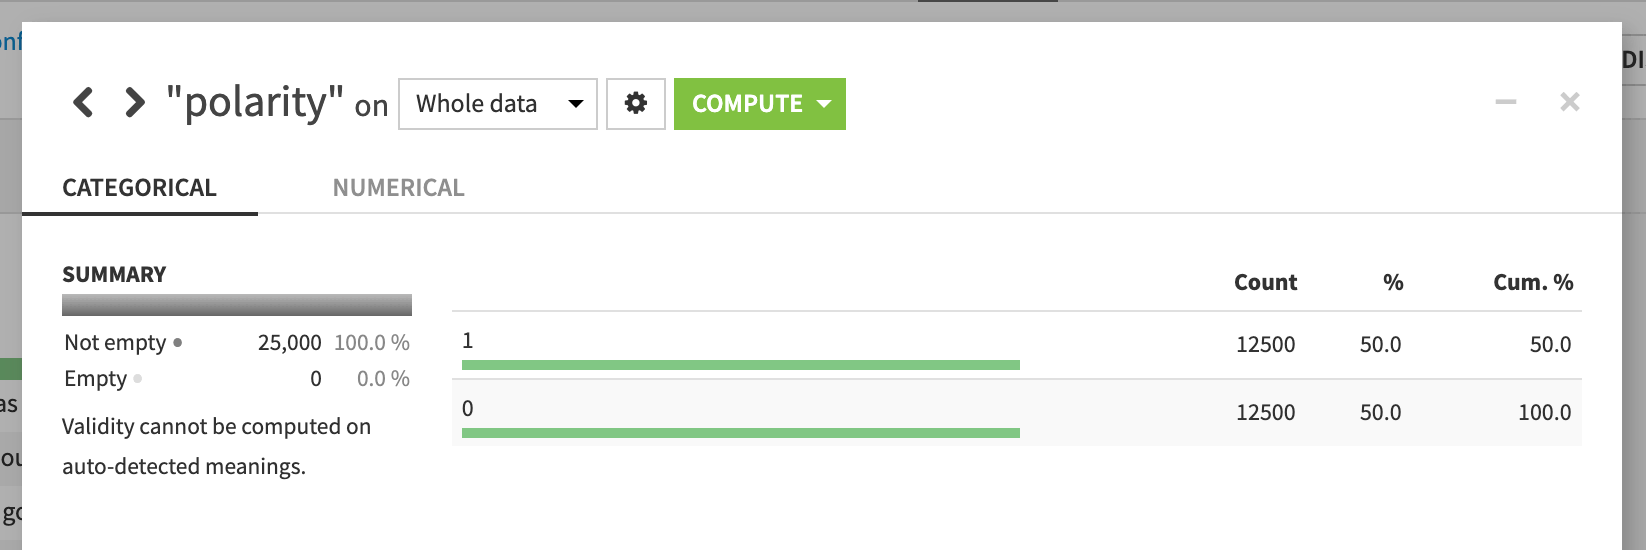
Analyze the polarity column on the whole dataset, and note that the numbers of positive and negative reviews are exactly equal, and that no records are missing a score.
Prepare the Data
In both train and test sets, we also have a sentiment column. This is similar to the binary polarity score, but is graded on a scale of 1 to 10. In fact, any sentiment score below 5 is graded as having a polarity of 0. All other reviews are marked as having a polarity of 1.
We will be performing a binary classification based of polarity, and so we will not be using the sentiment scores. Before going any further, let’s remove the sentiment column.
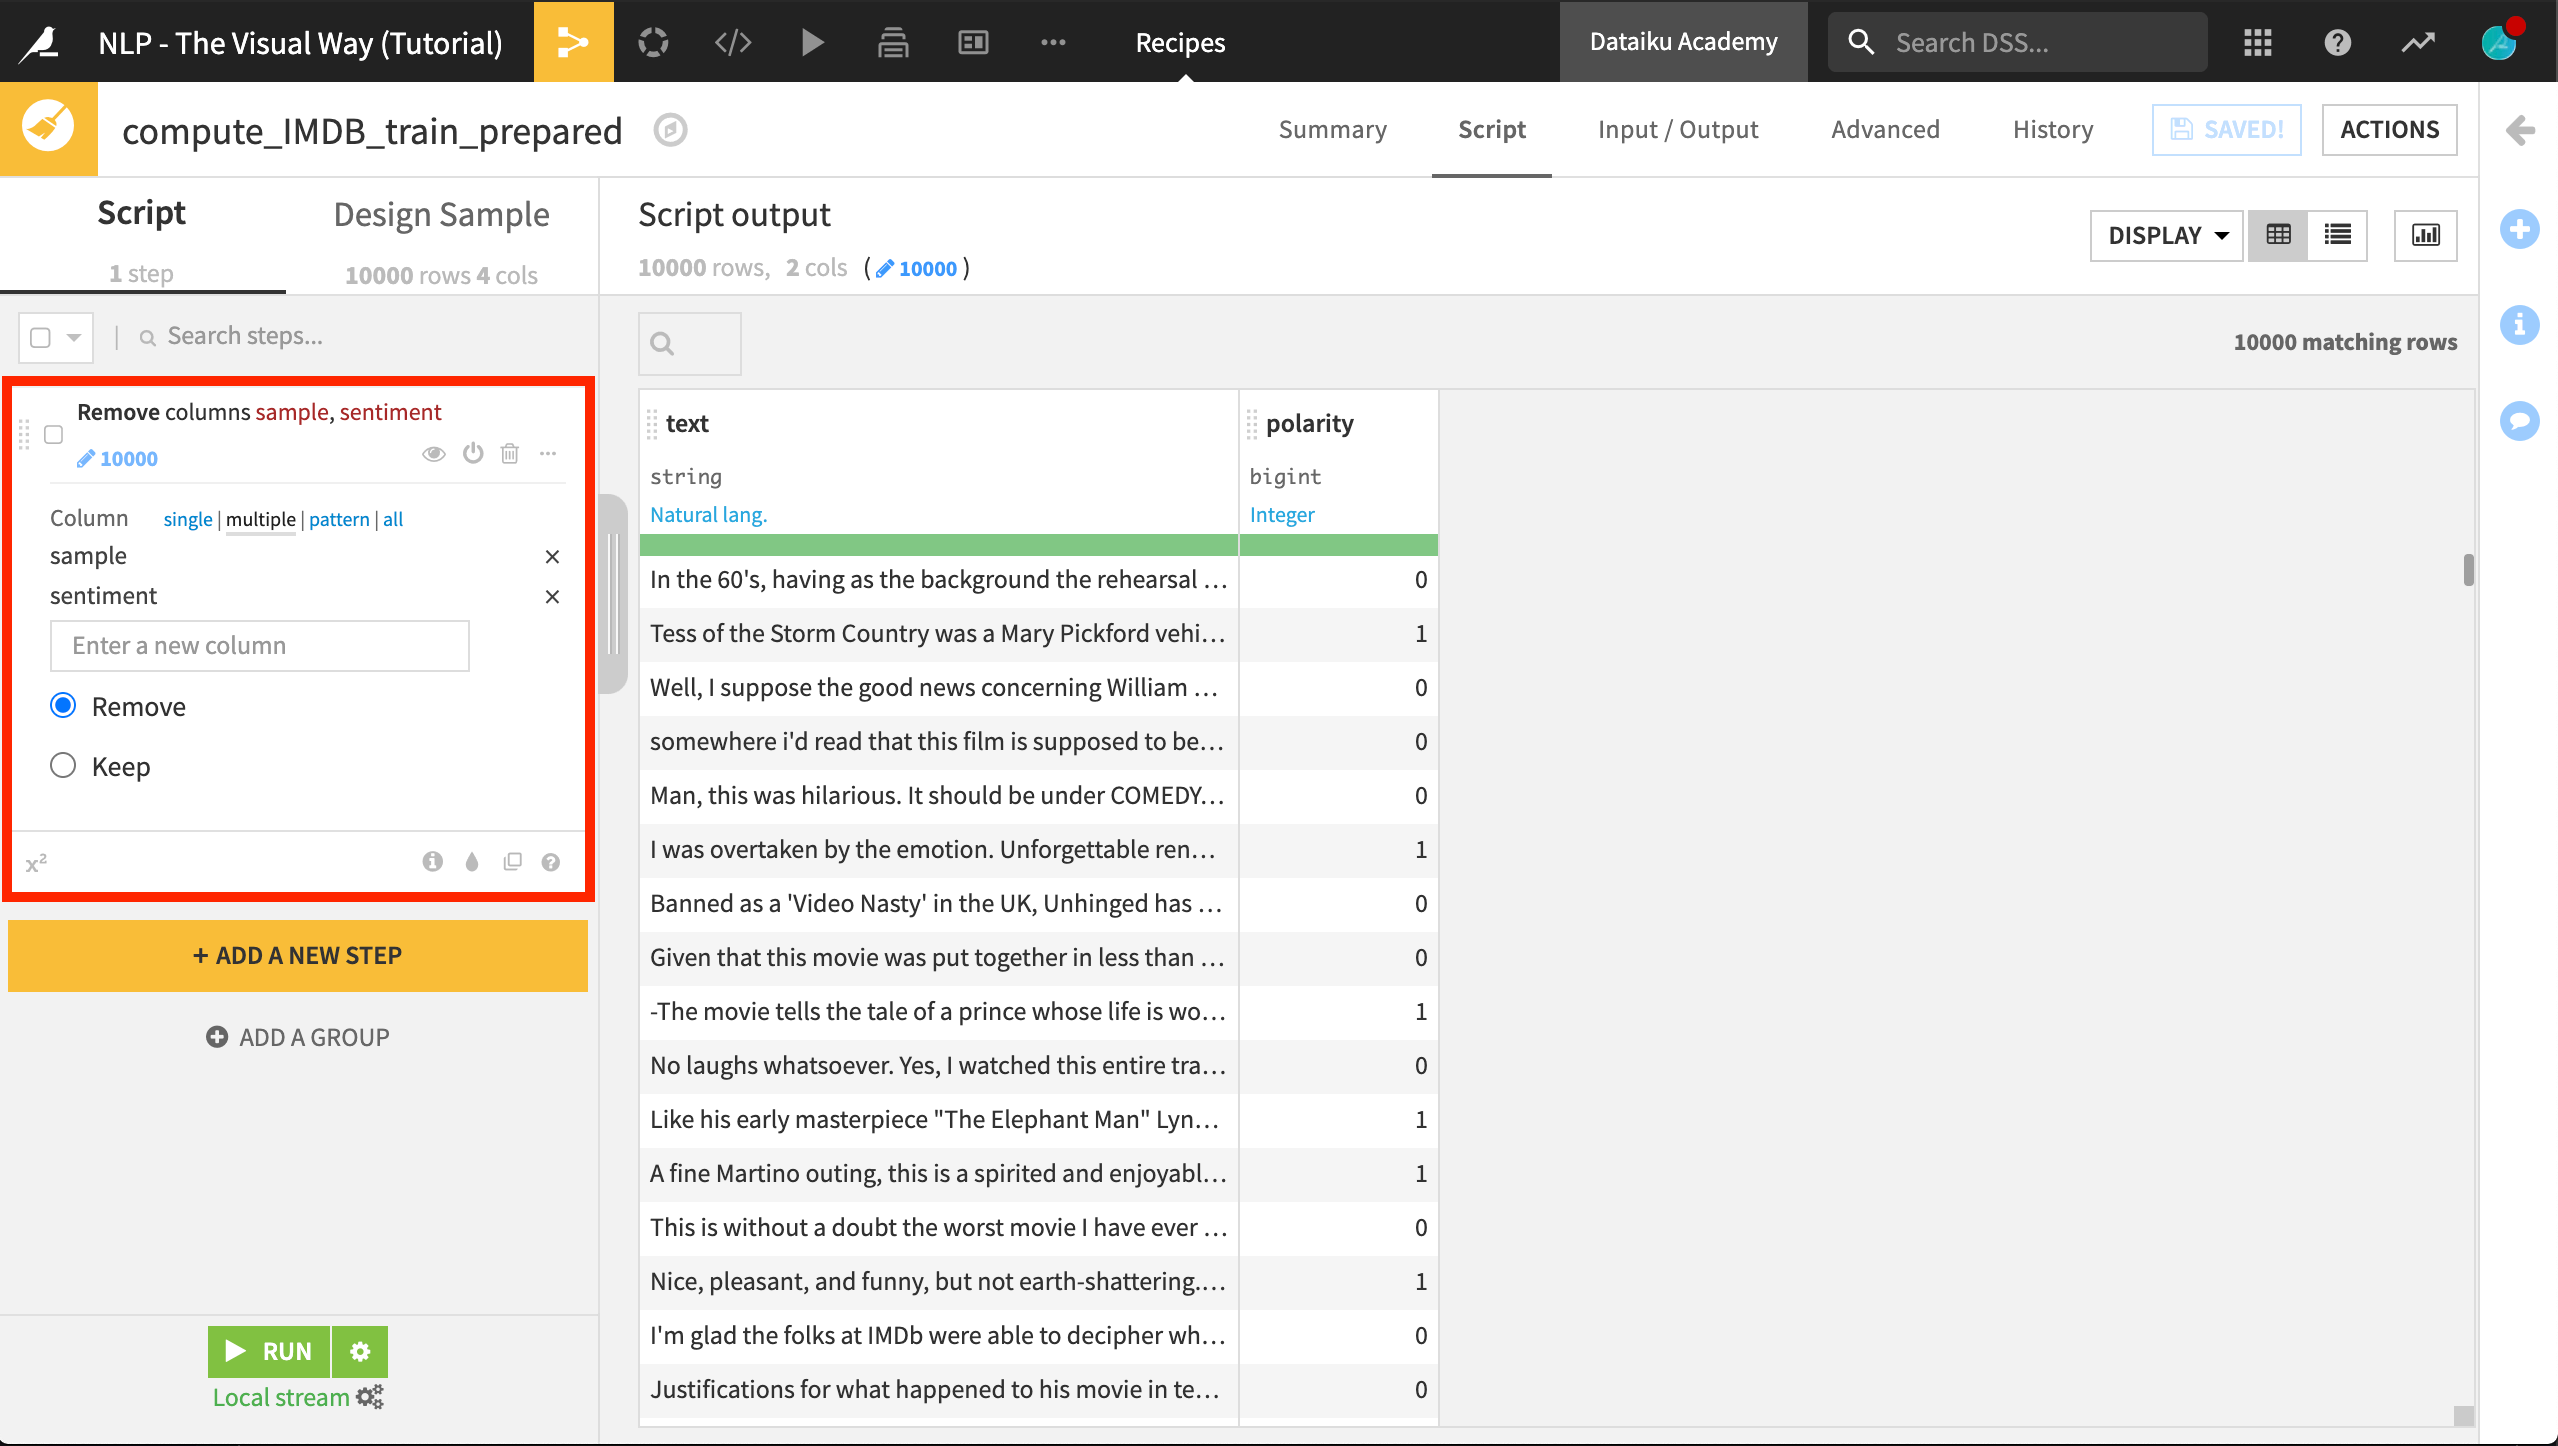
From IMDB_train, create a Prepare recipe, accepting the default output name.
Remove the columns sentiment and sample. All values of the sample column are “train” so it won’t help with modeling.
Run the recipe, updating the schema, leaving only two columns in the output dataset.
Build a Baseline Model
With our training data ready, let’s build an initial model to predict polarity.
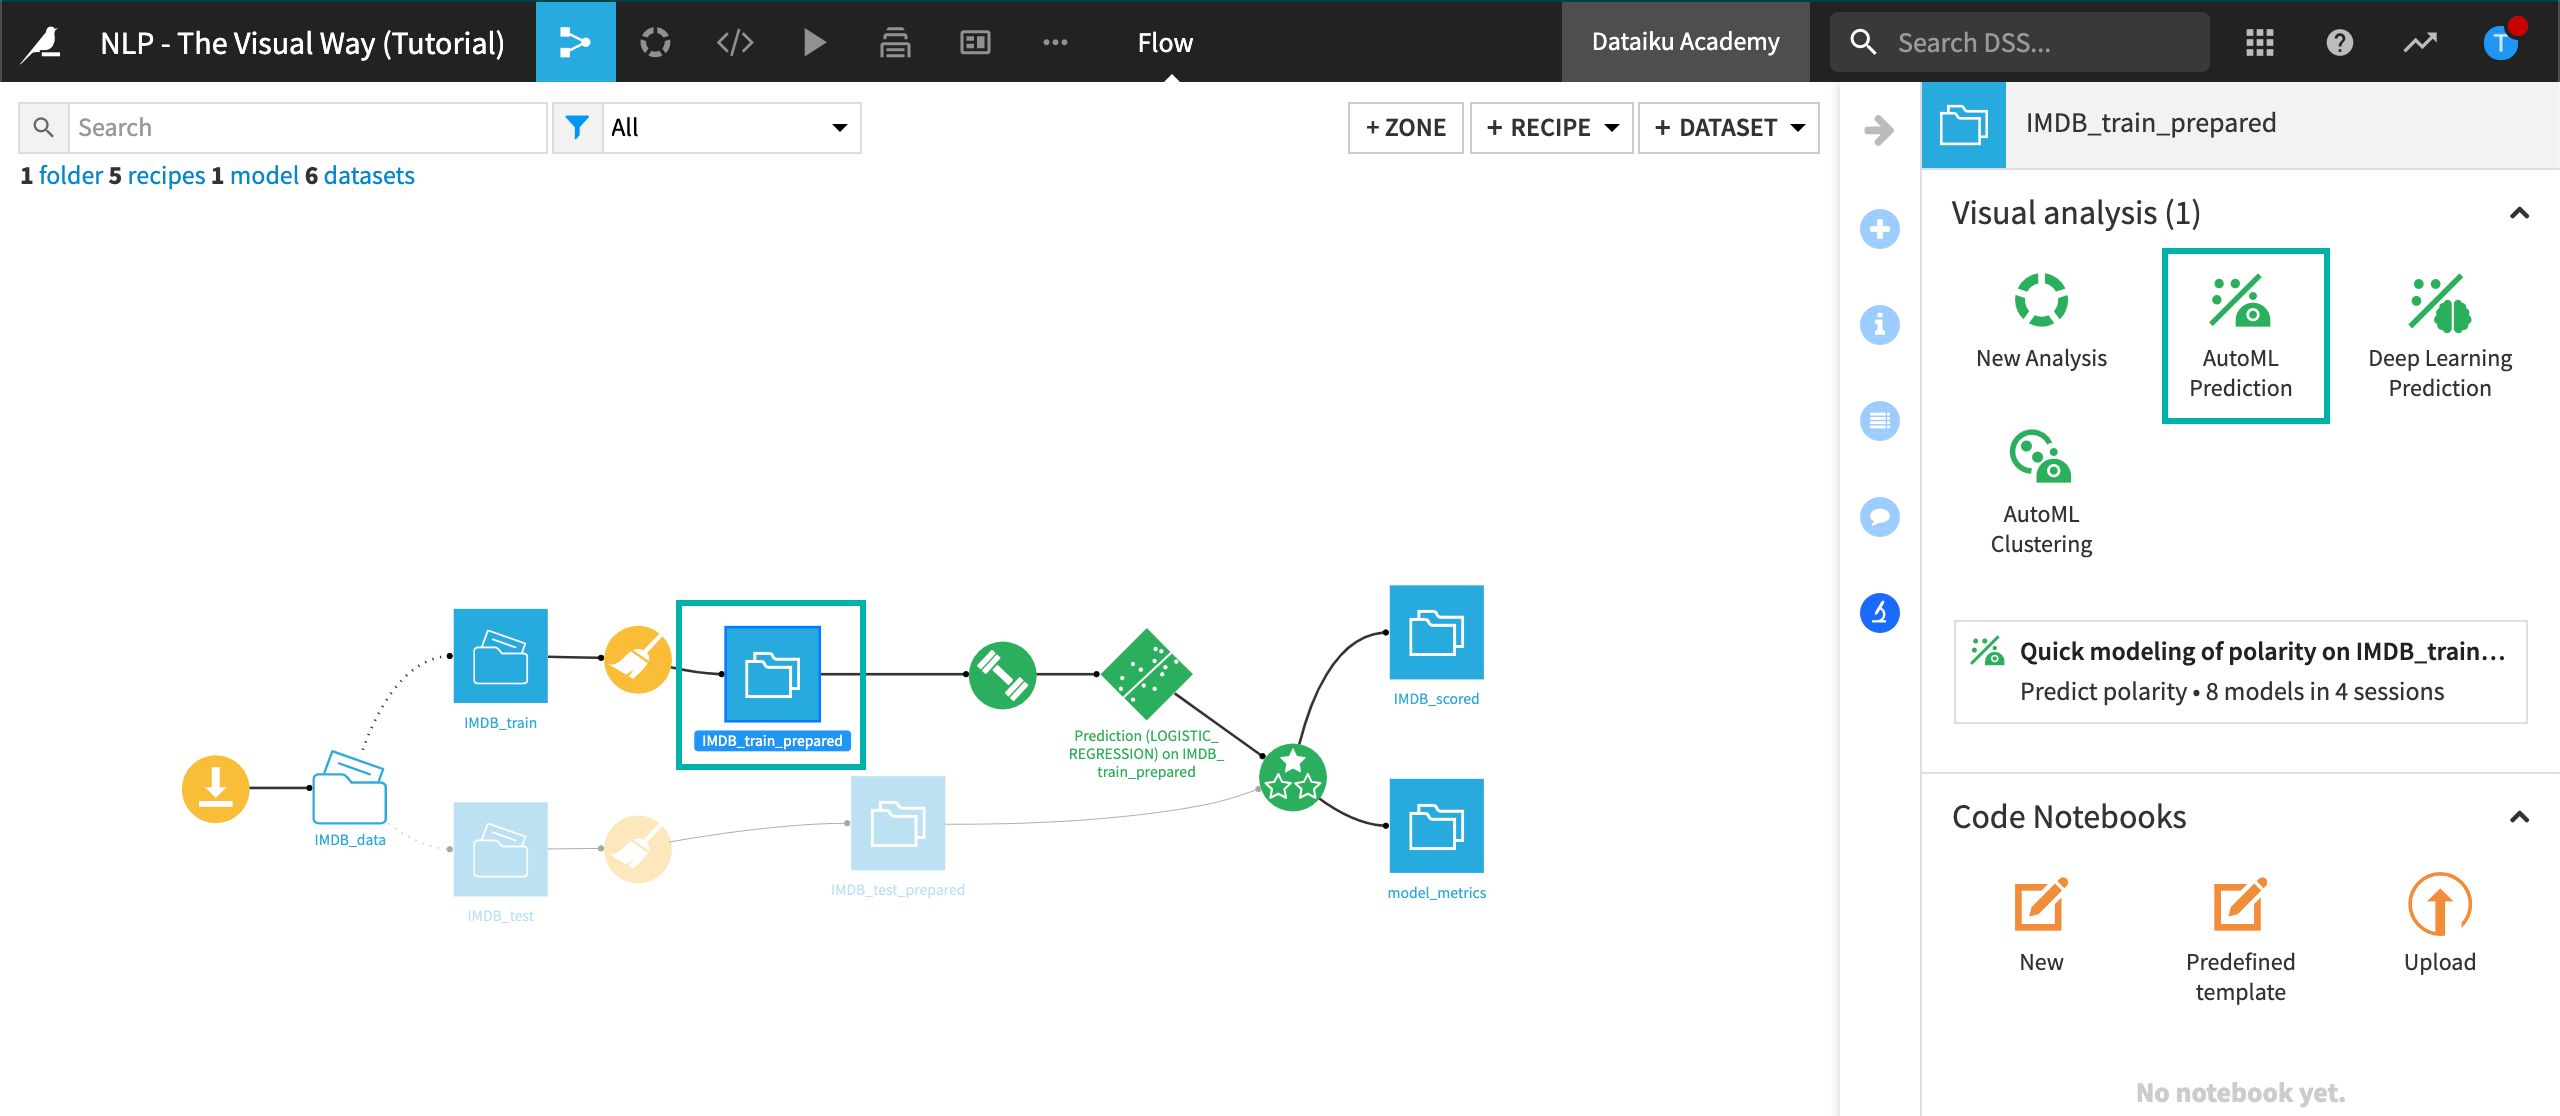
From the IMDB_train_prepared dataset, enter the Lab and create a new visual analysis–AutoML Prediction.
Choose a prediction model with polarity as the target variable.
Select “Quick Prototypes”.
Click “Create” and “Train” to begin training models.
Dataiku DSS, however, throws an error because no input feature is selected! Recall that Dataiku DSS rejects text features by default. Accordingly, zero features were selected to train the model.
Navigate to the Models tab.
Click the Design tab.
In the Design tab, navigate to the Features handling pane and include the text column as a feature in the model.
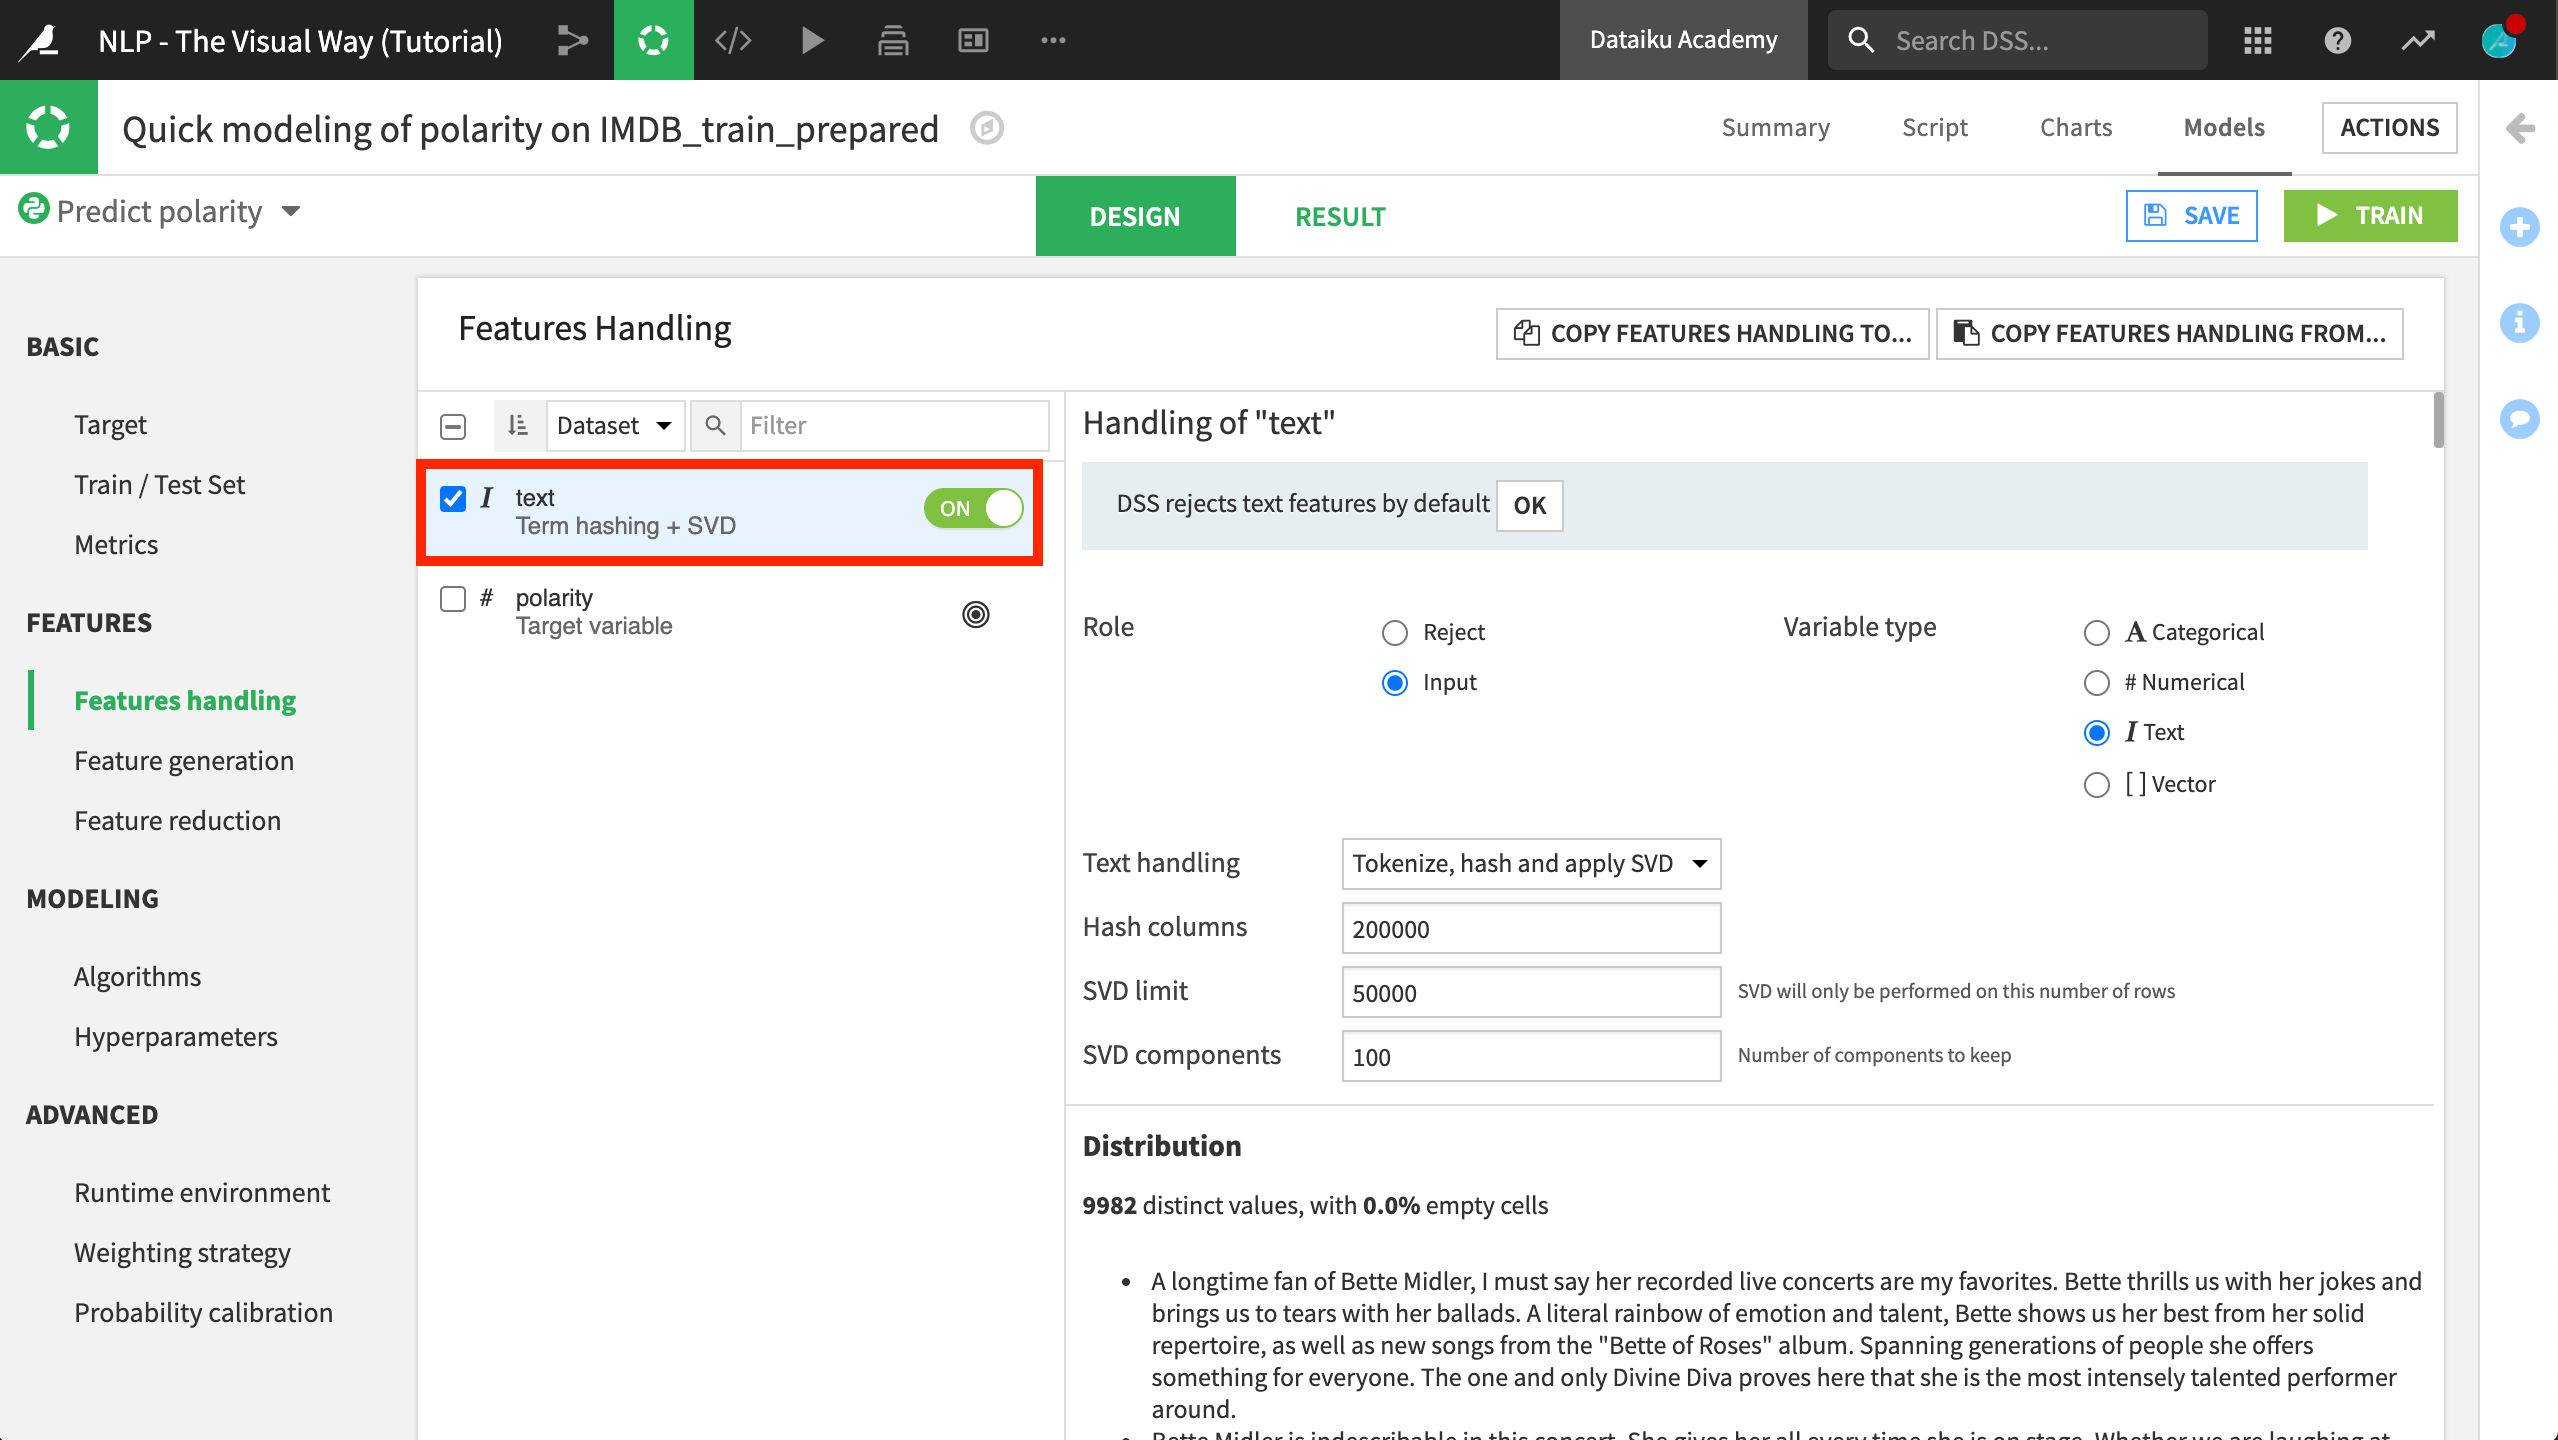
Note that the default text handling method is “Term hashing + SVD”. We’ll learn about these different strategies in a future lesson. For now, let’s stick with the default options.
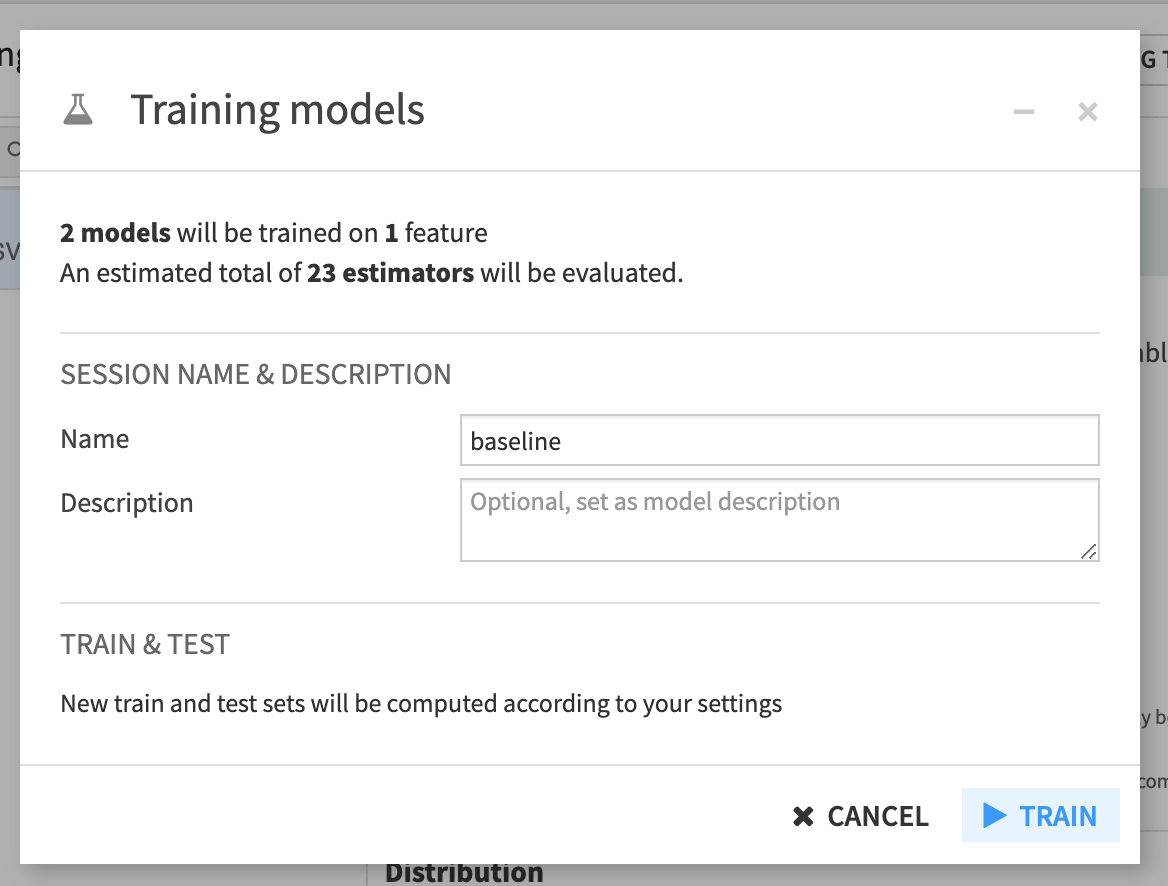
With the text column selected, Train the models from the button in the top right. We will have a number of different training sessions so it will be helpful to give each one a name. Name this first one baseline.
For very little effort, these results might not be too bad. We can see that the logistic regression model performed better than the random forest model.
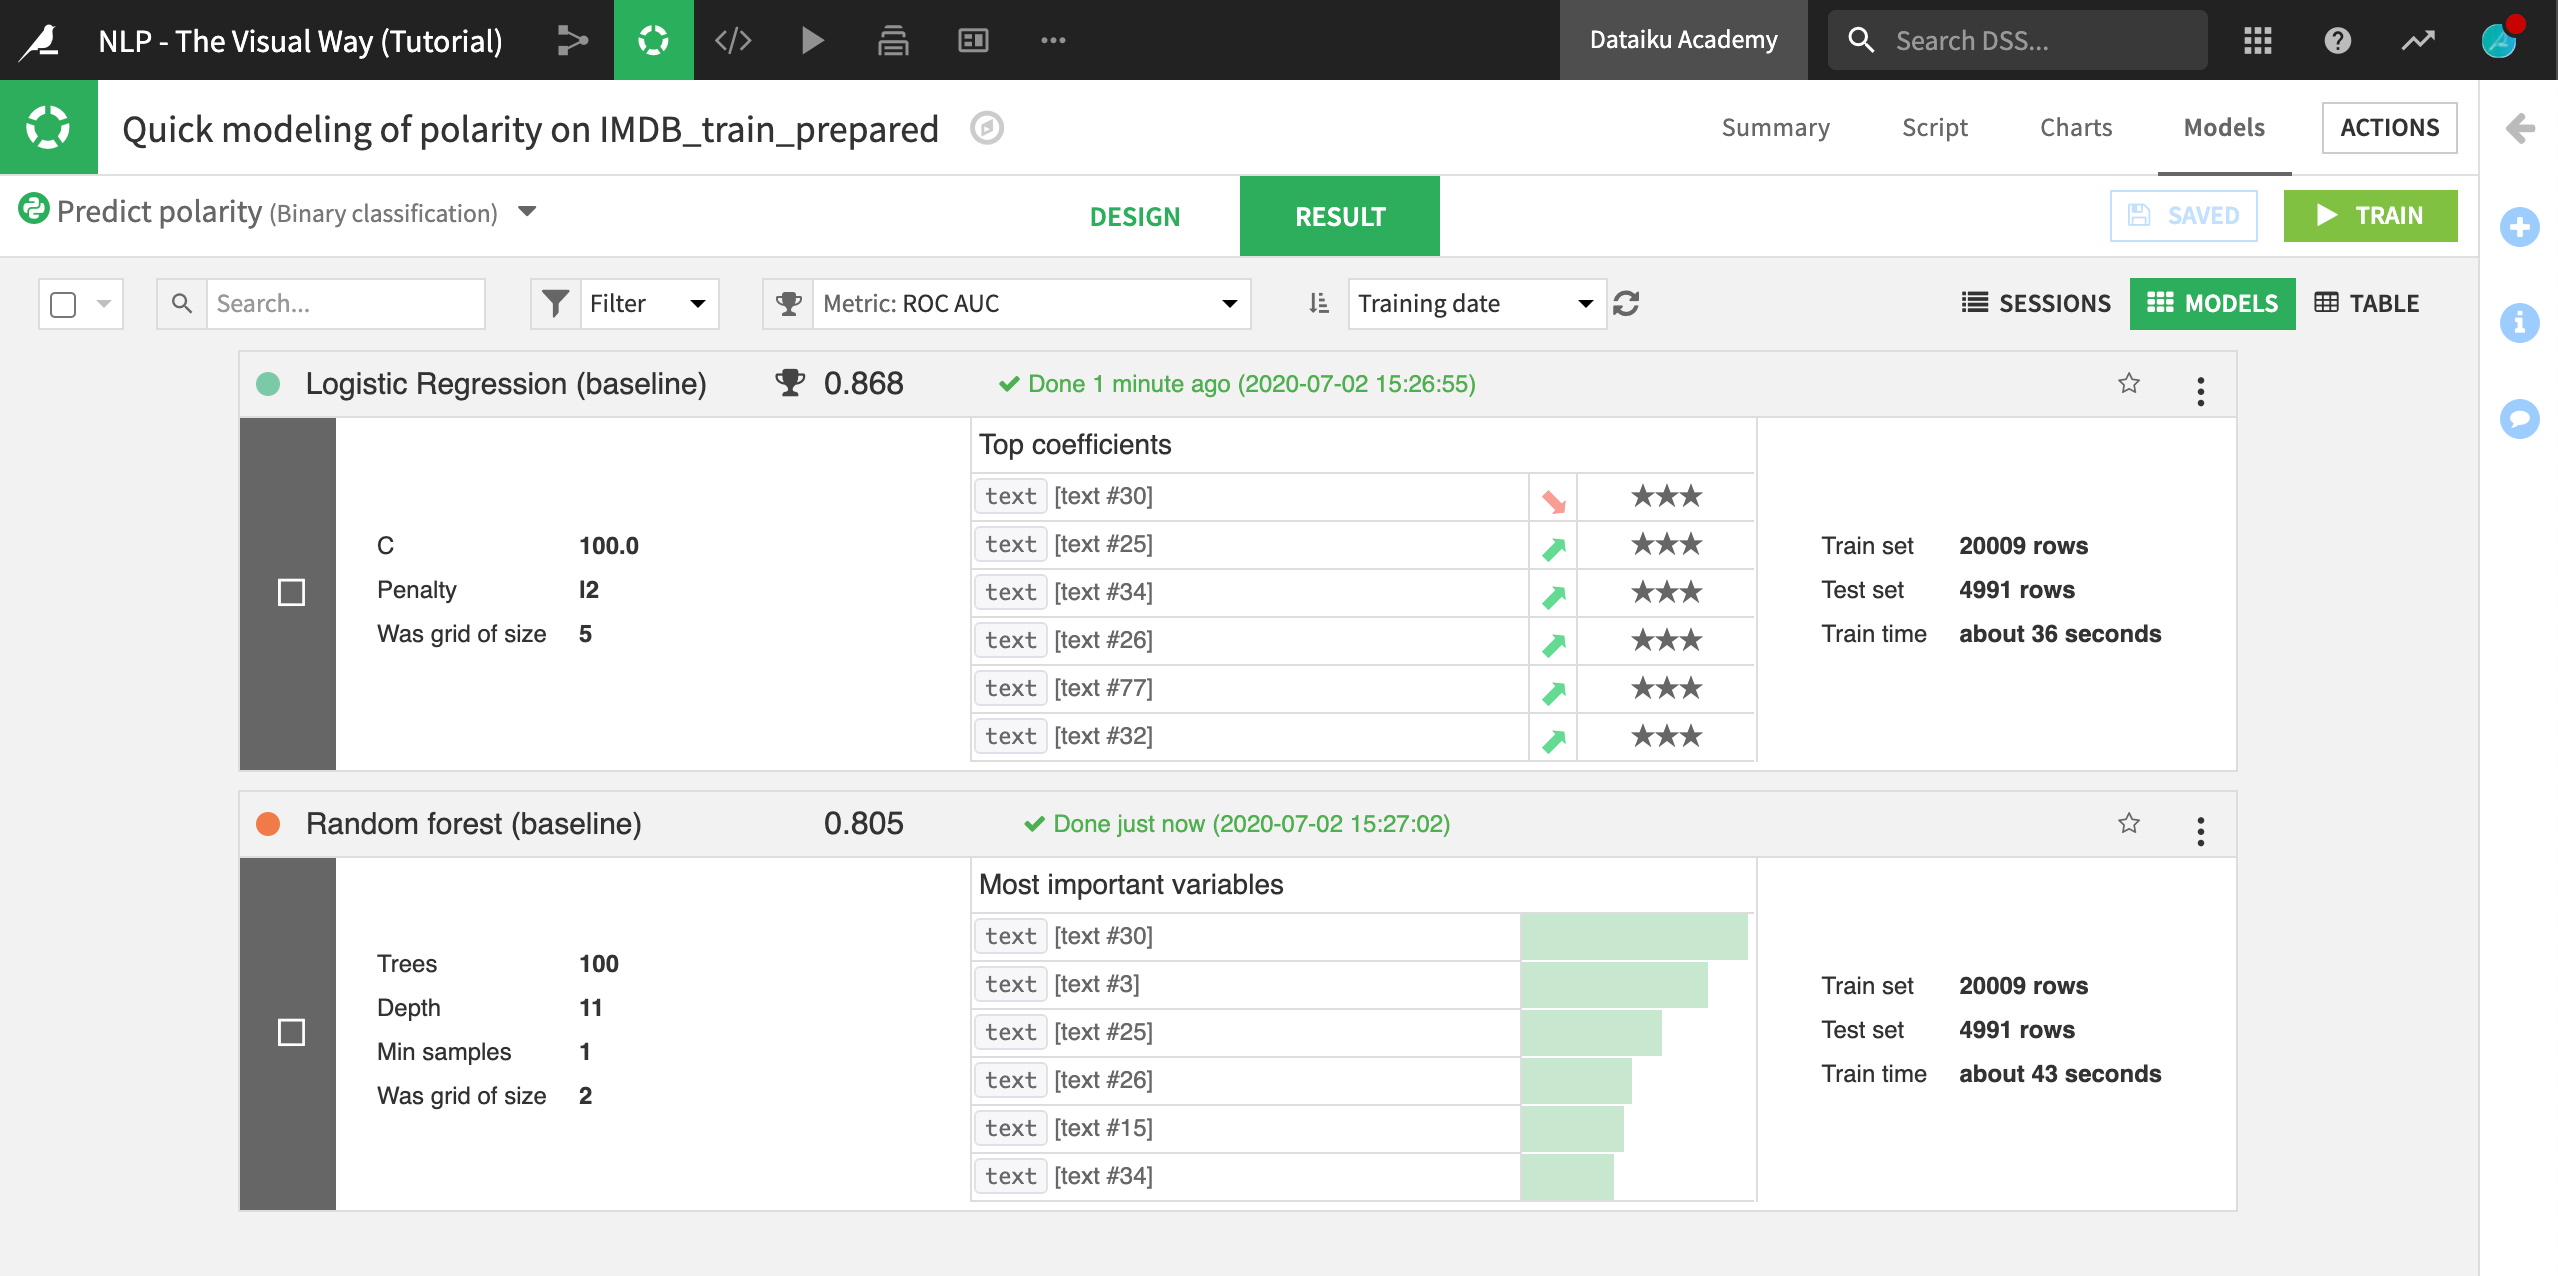
However, how should we interpret the results of the most important variables of the random forest model or the top coefficients of the logistic regression model? This is a question we’ll return to throughout the course.
What’s Next?
These baseline models are a good starting point, but it’s very likely we can improve upon them with some simple data cleaning and feature engineering. We’ll try that in the next hands-on lesson.
- 1
Andrew L. Maas, Raymond E. Daly, Peter T. Pham, Dan Huang, Andrew Y. Ng, and Christopher Potts. (2011). Learning Word Vectors for Sentiment Analysis. The 49th Annual Meeting of the Association for Computational Linguistics (ACL 2011).