Hands-On: Analyze and Understand Your Model with Tensorboard
In this lesson, you will set up and use a webapp to monitor the re-training of the deep learning model that you have been working with throughout this course.
The Deep Learning on images plugin you installed in the hands-on lesson, Install the Deep Learning Plugins, includes a standard webapp template, Tensorboard: monitor the re-training of deep learning models.
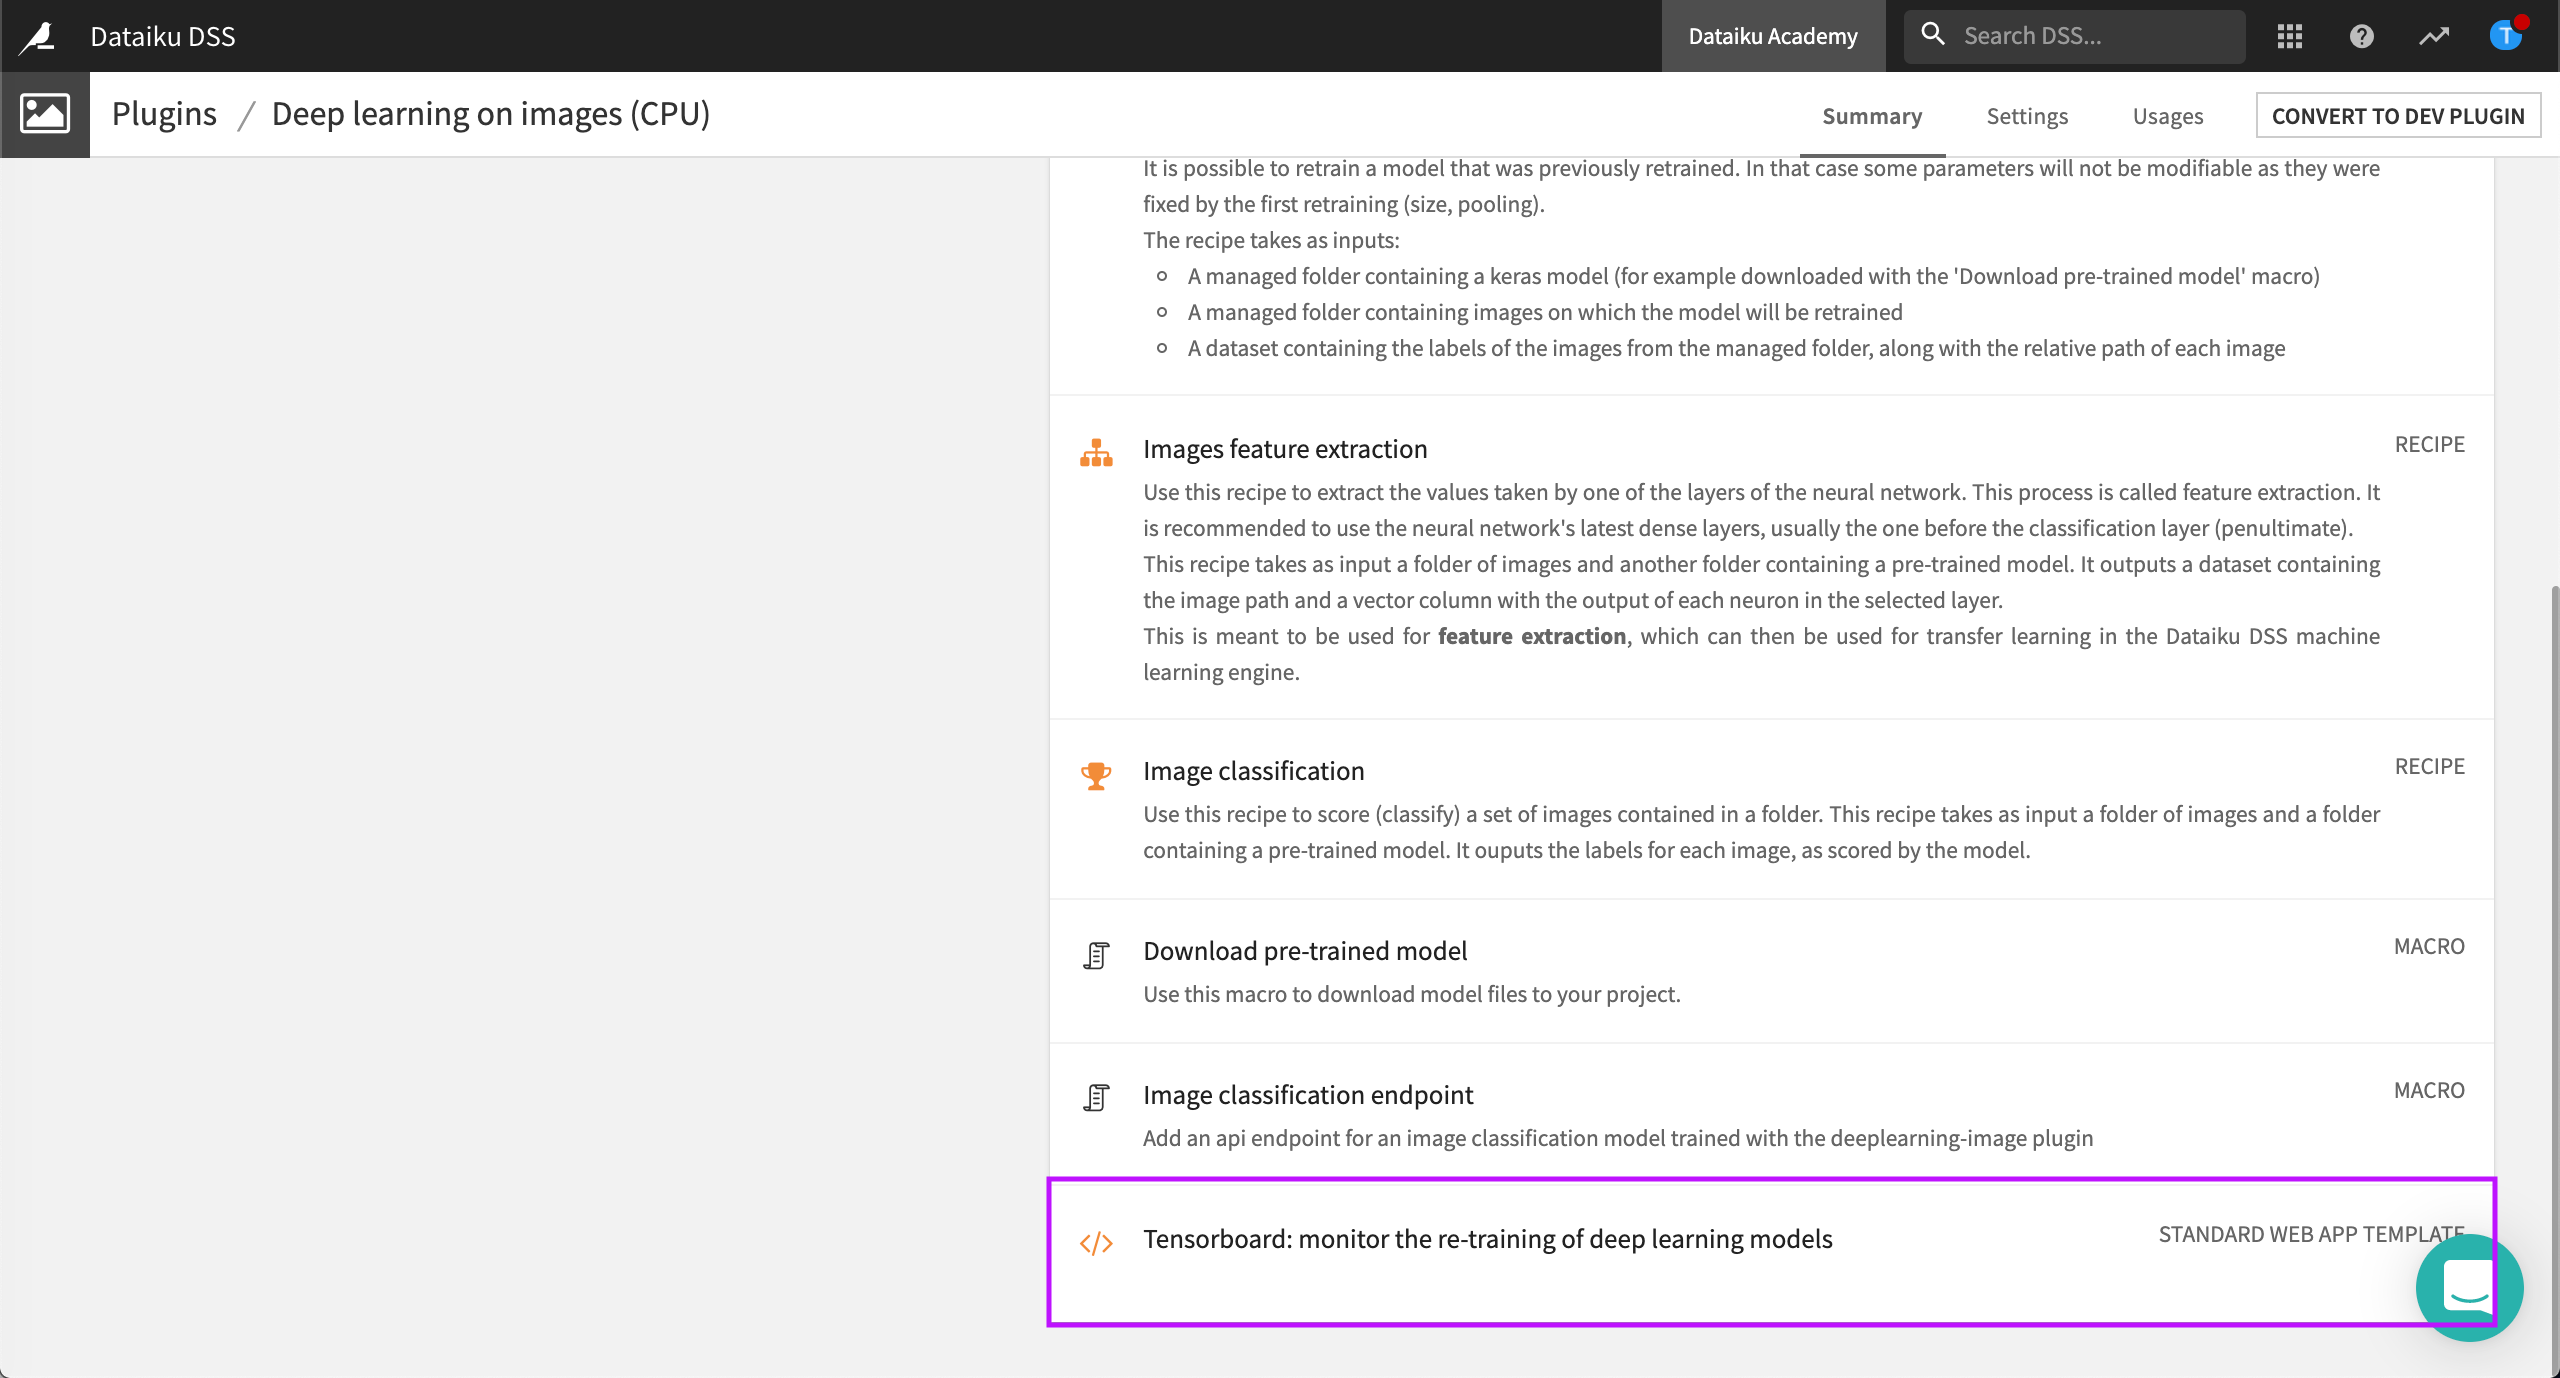
While re-training your model, you can use Tensorboard to view the performance of your model in real time, across epochs, along with the model’s architecture. The goal is to understand the architecture of your model and check the evolution of the most useful metrics over epochs, like the loss, and the Area Under the Curve (AUC).
Note
One epoch is equal to one complete pass of the entire training dataset by the model.
Create the Webapp
Let’s create the webapp.
Note
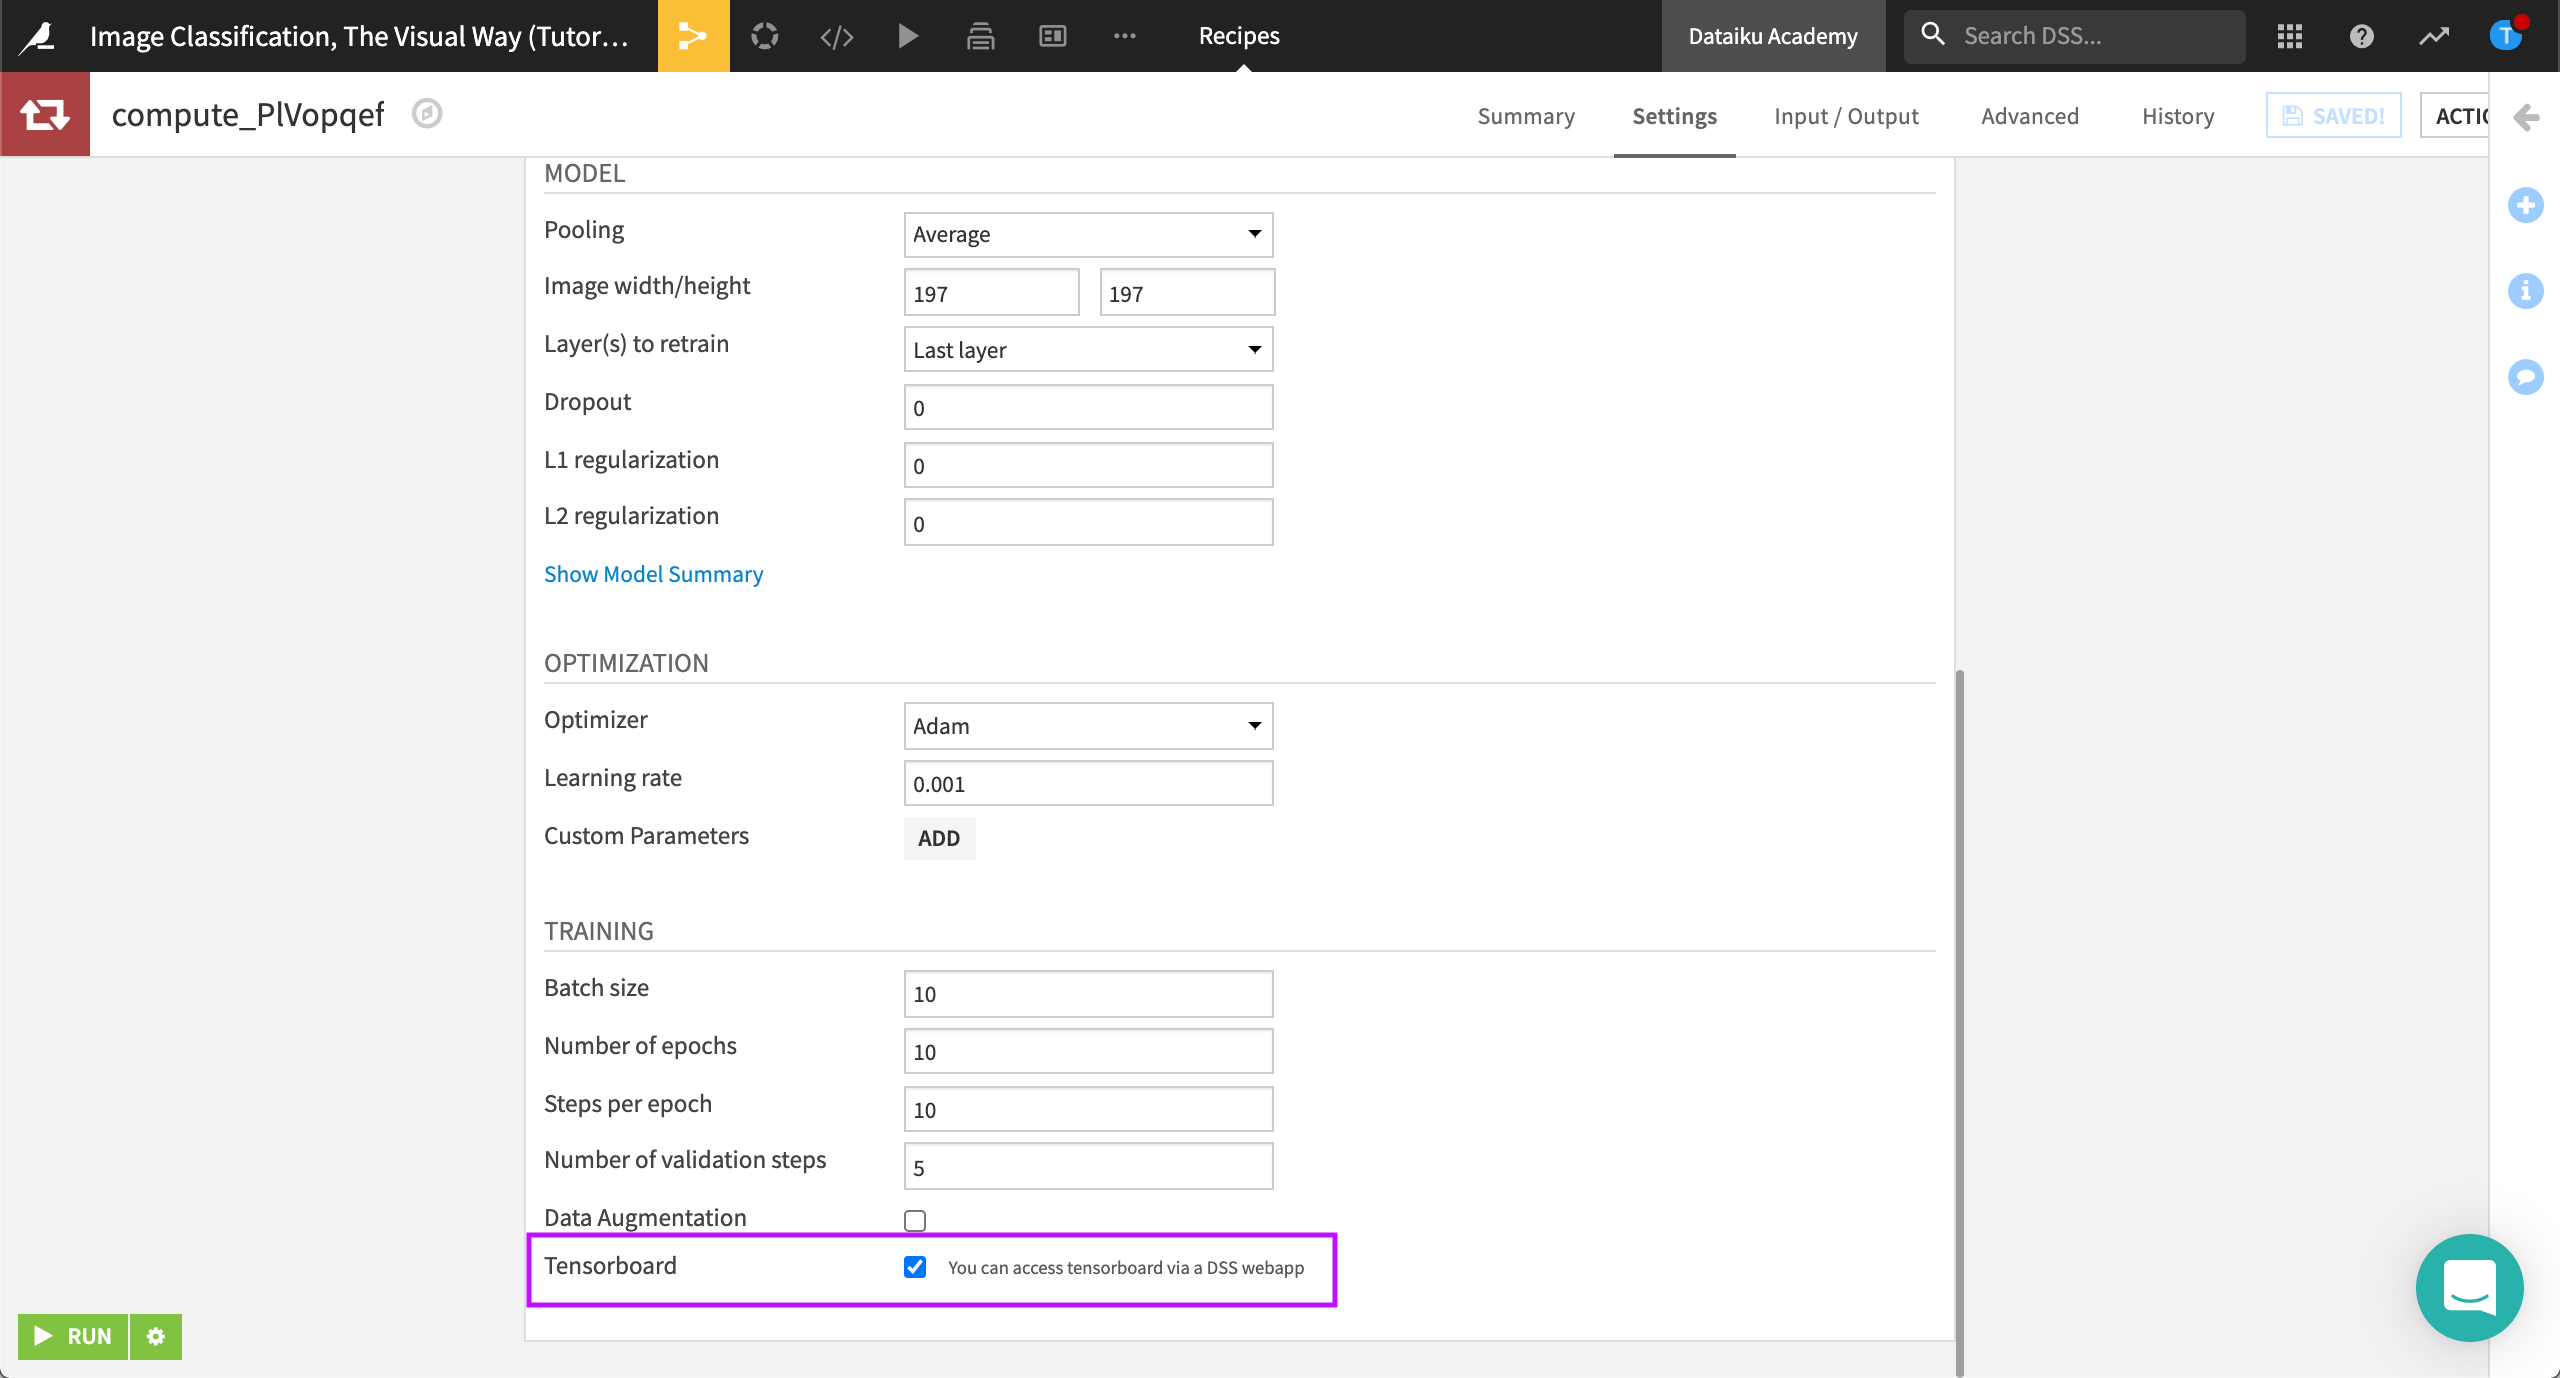
In the hands-on lesson, Transfer Learning to Re-Train the Model, you created a recipe, Retraining image classification model. In the settings, ensure that the checkbox, You can access tensorboard via a DSS webapp is selected.
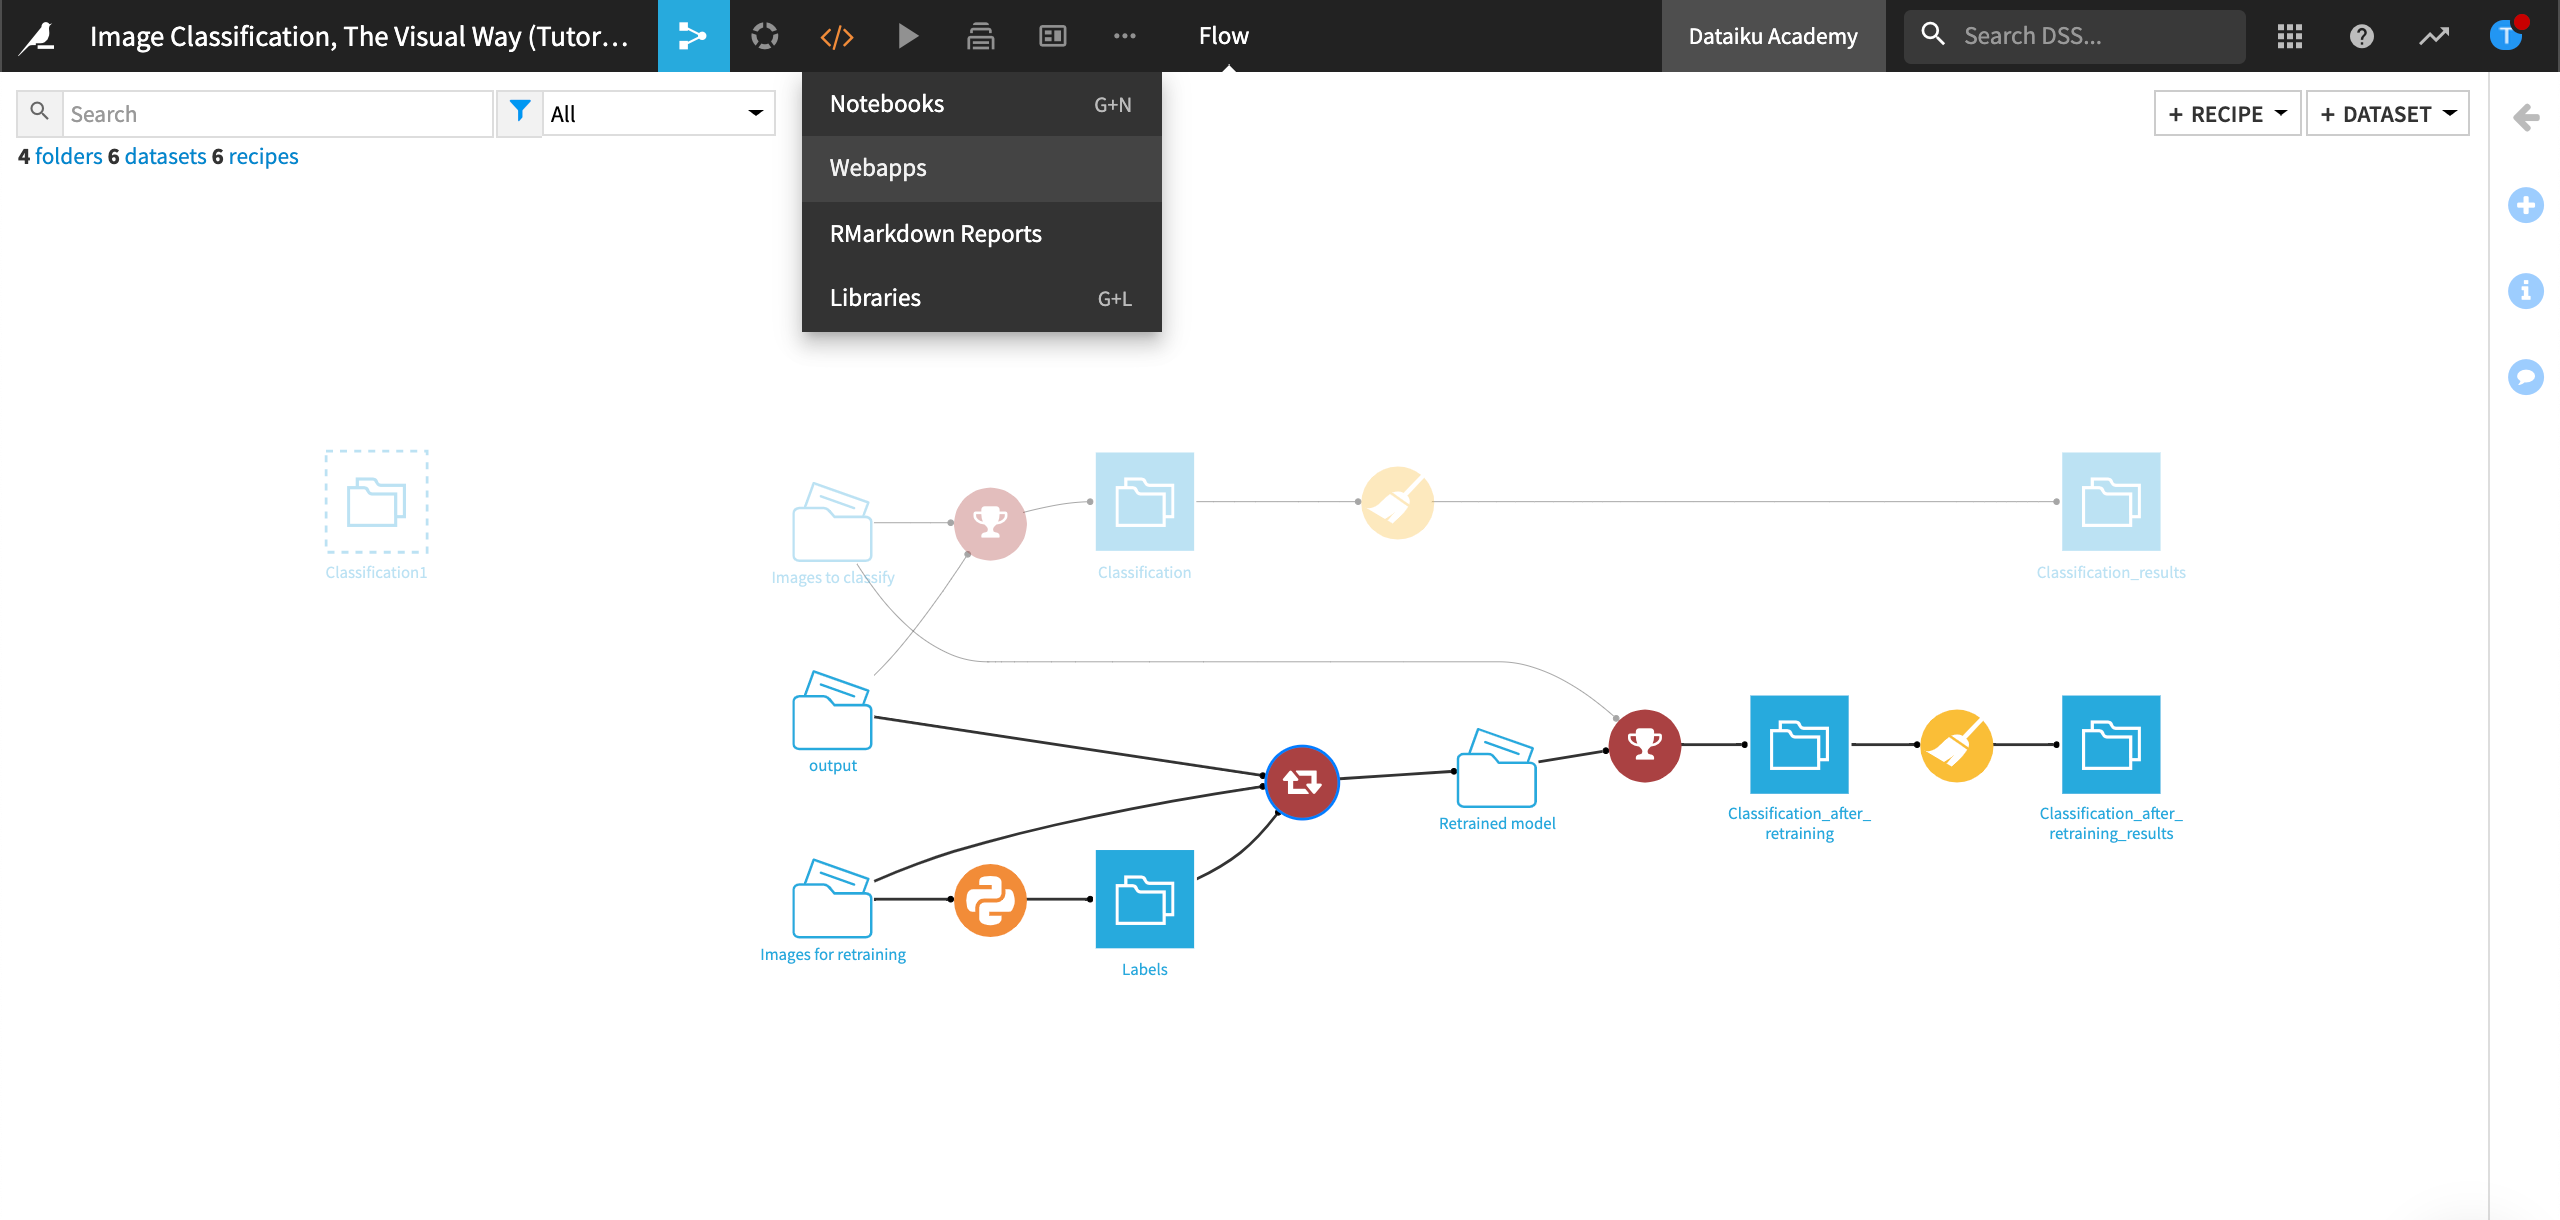
In the Flow, select Webapps* from the code menu, then click **Create Your First Webapp.
Click Code Webapp.
Select the Standard webapp, then choose Tensorboard: monitor the re-training of deep learning models.
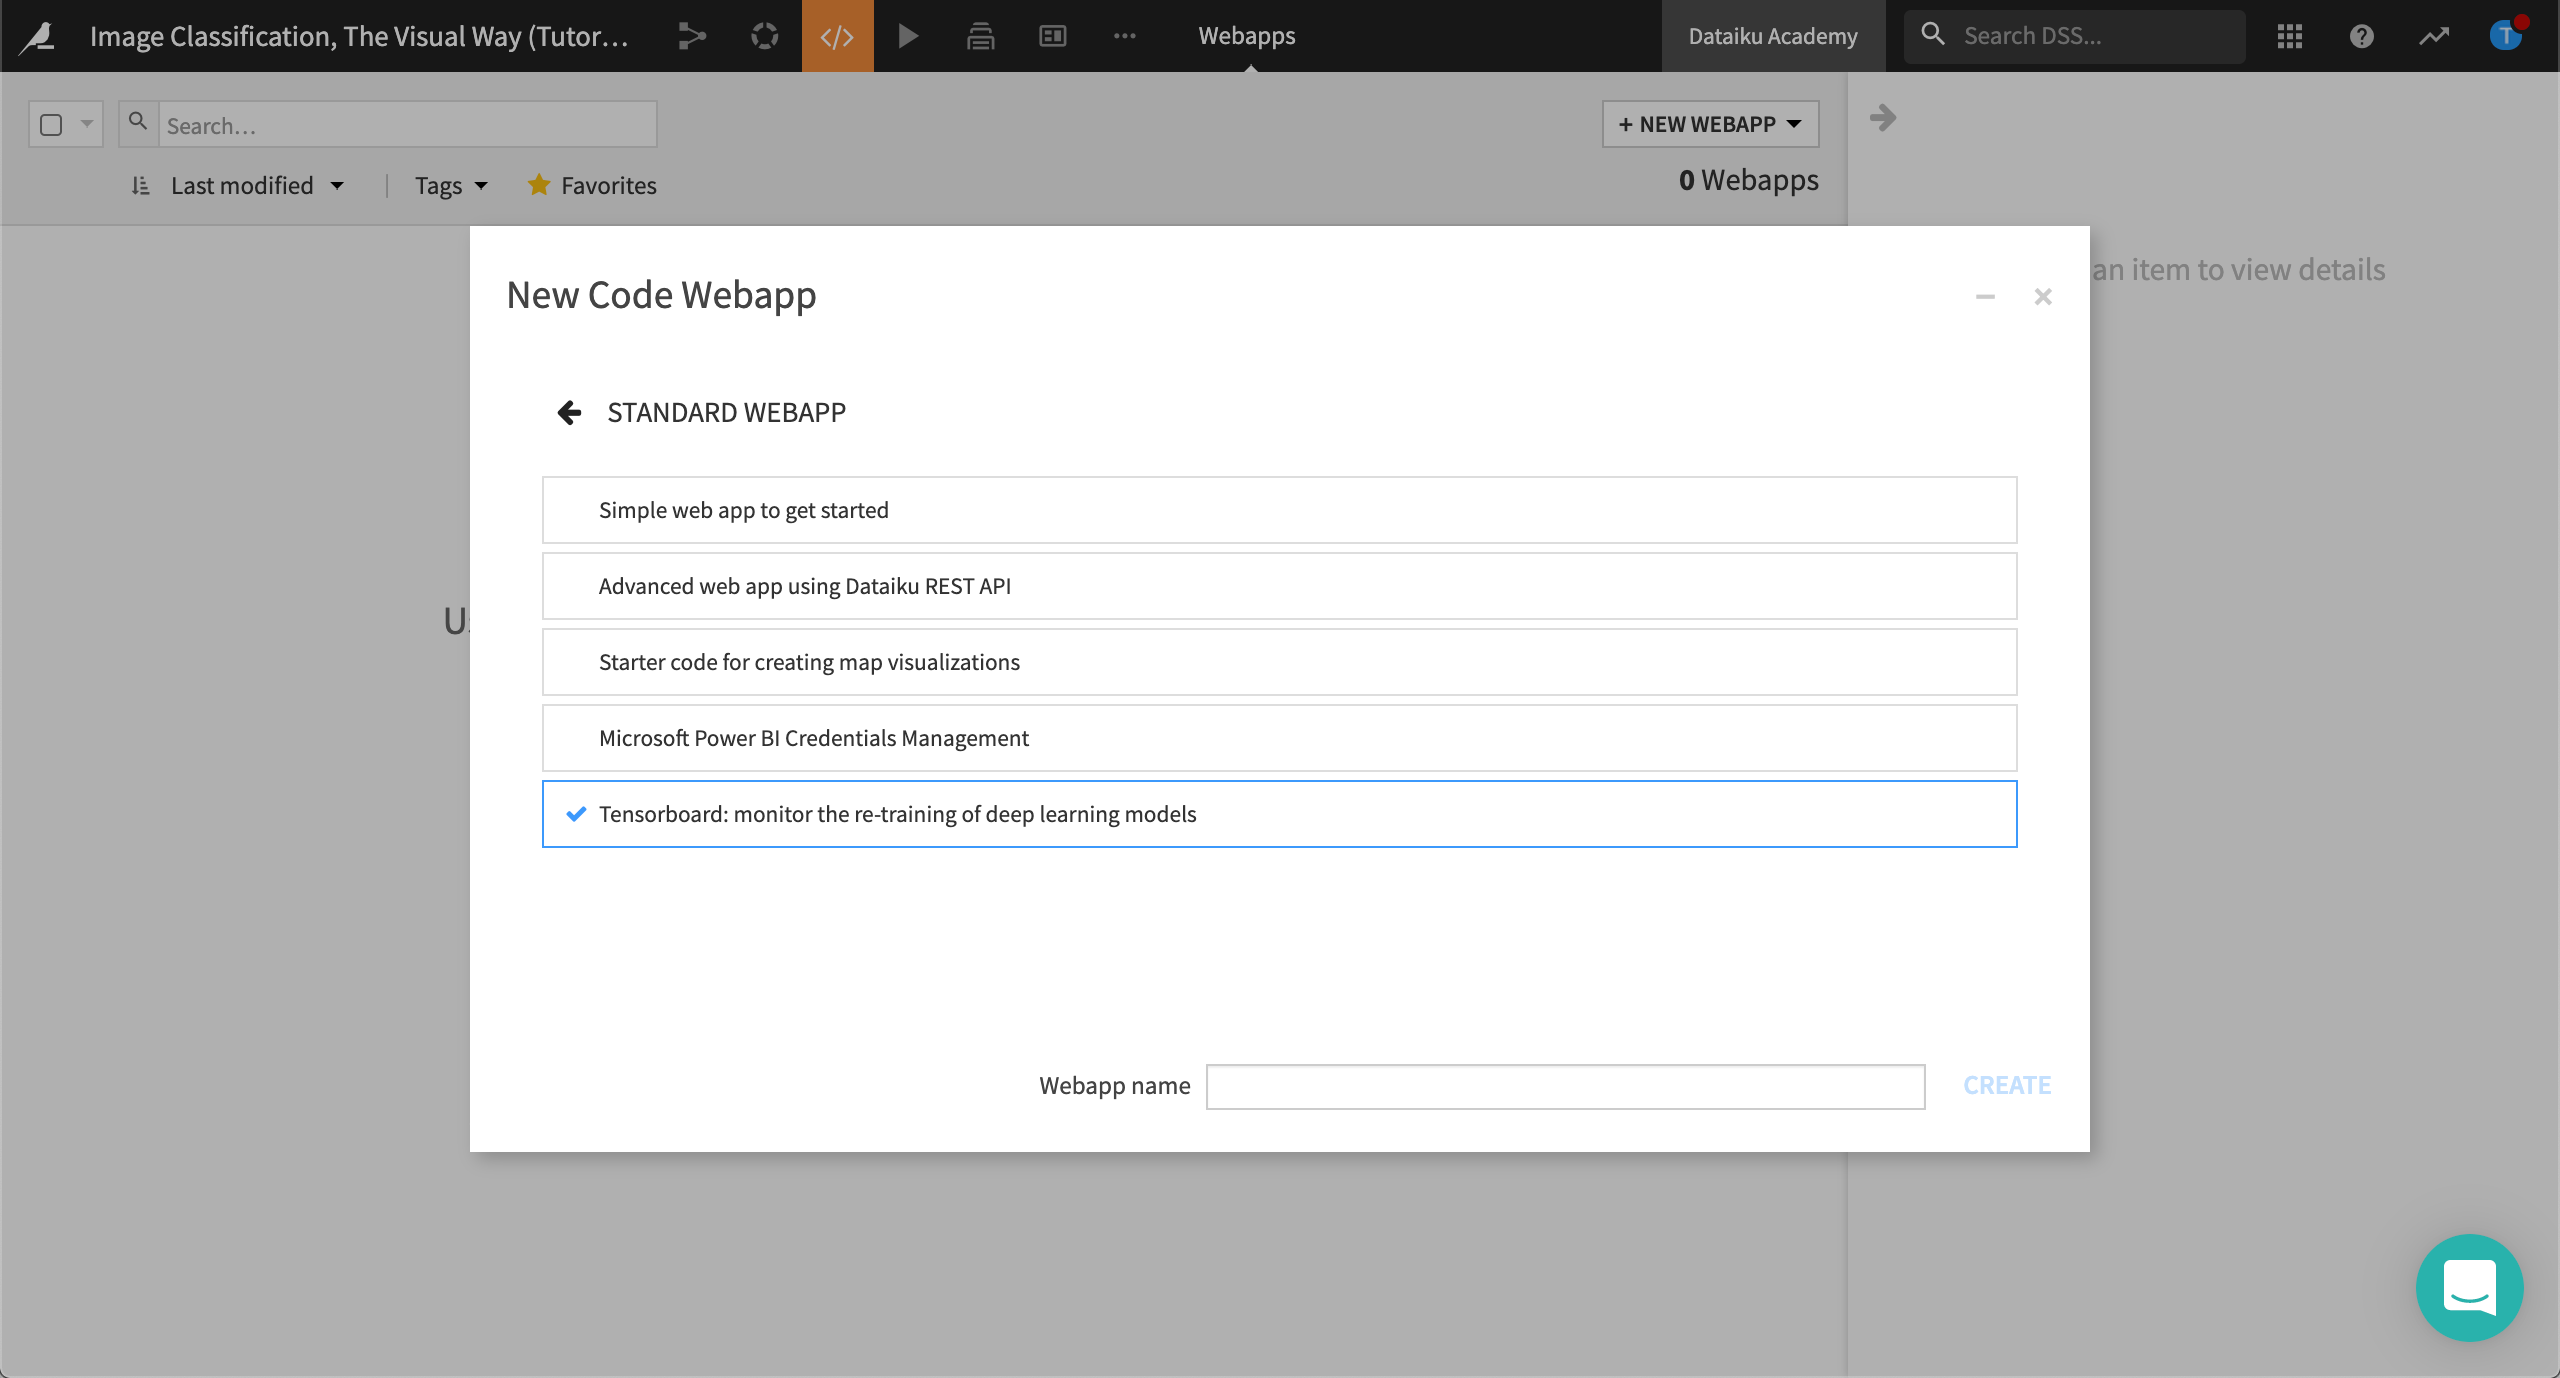
Name your webapp “model_performance” and click Create. Your webapp is now created.
Dataiku DSS lets you know the webapp requires a backend and that it is not running. In the next section, we’ll set up a code environment to satisfy this requirement.
Create an Environment
Let’s set up a code environment that offers the “tensorboard” python package needed by the webapp.
From the Apps menu, select Administration, then choose the Code Envs tab.
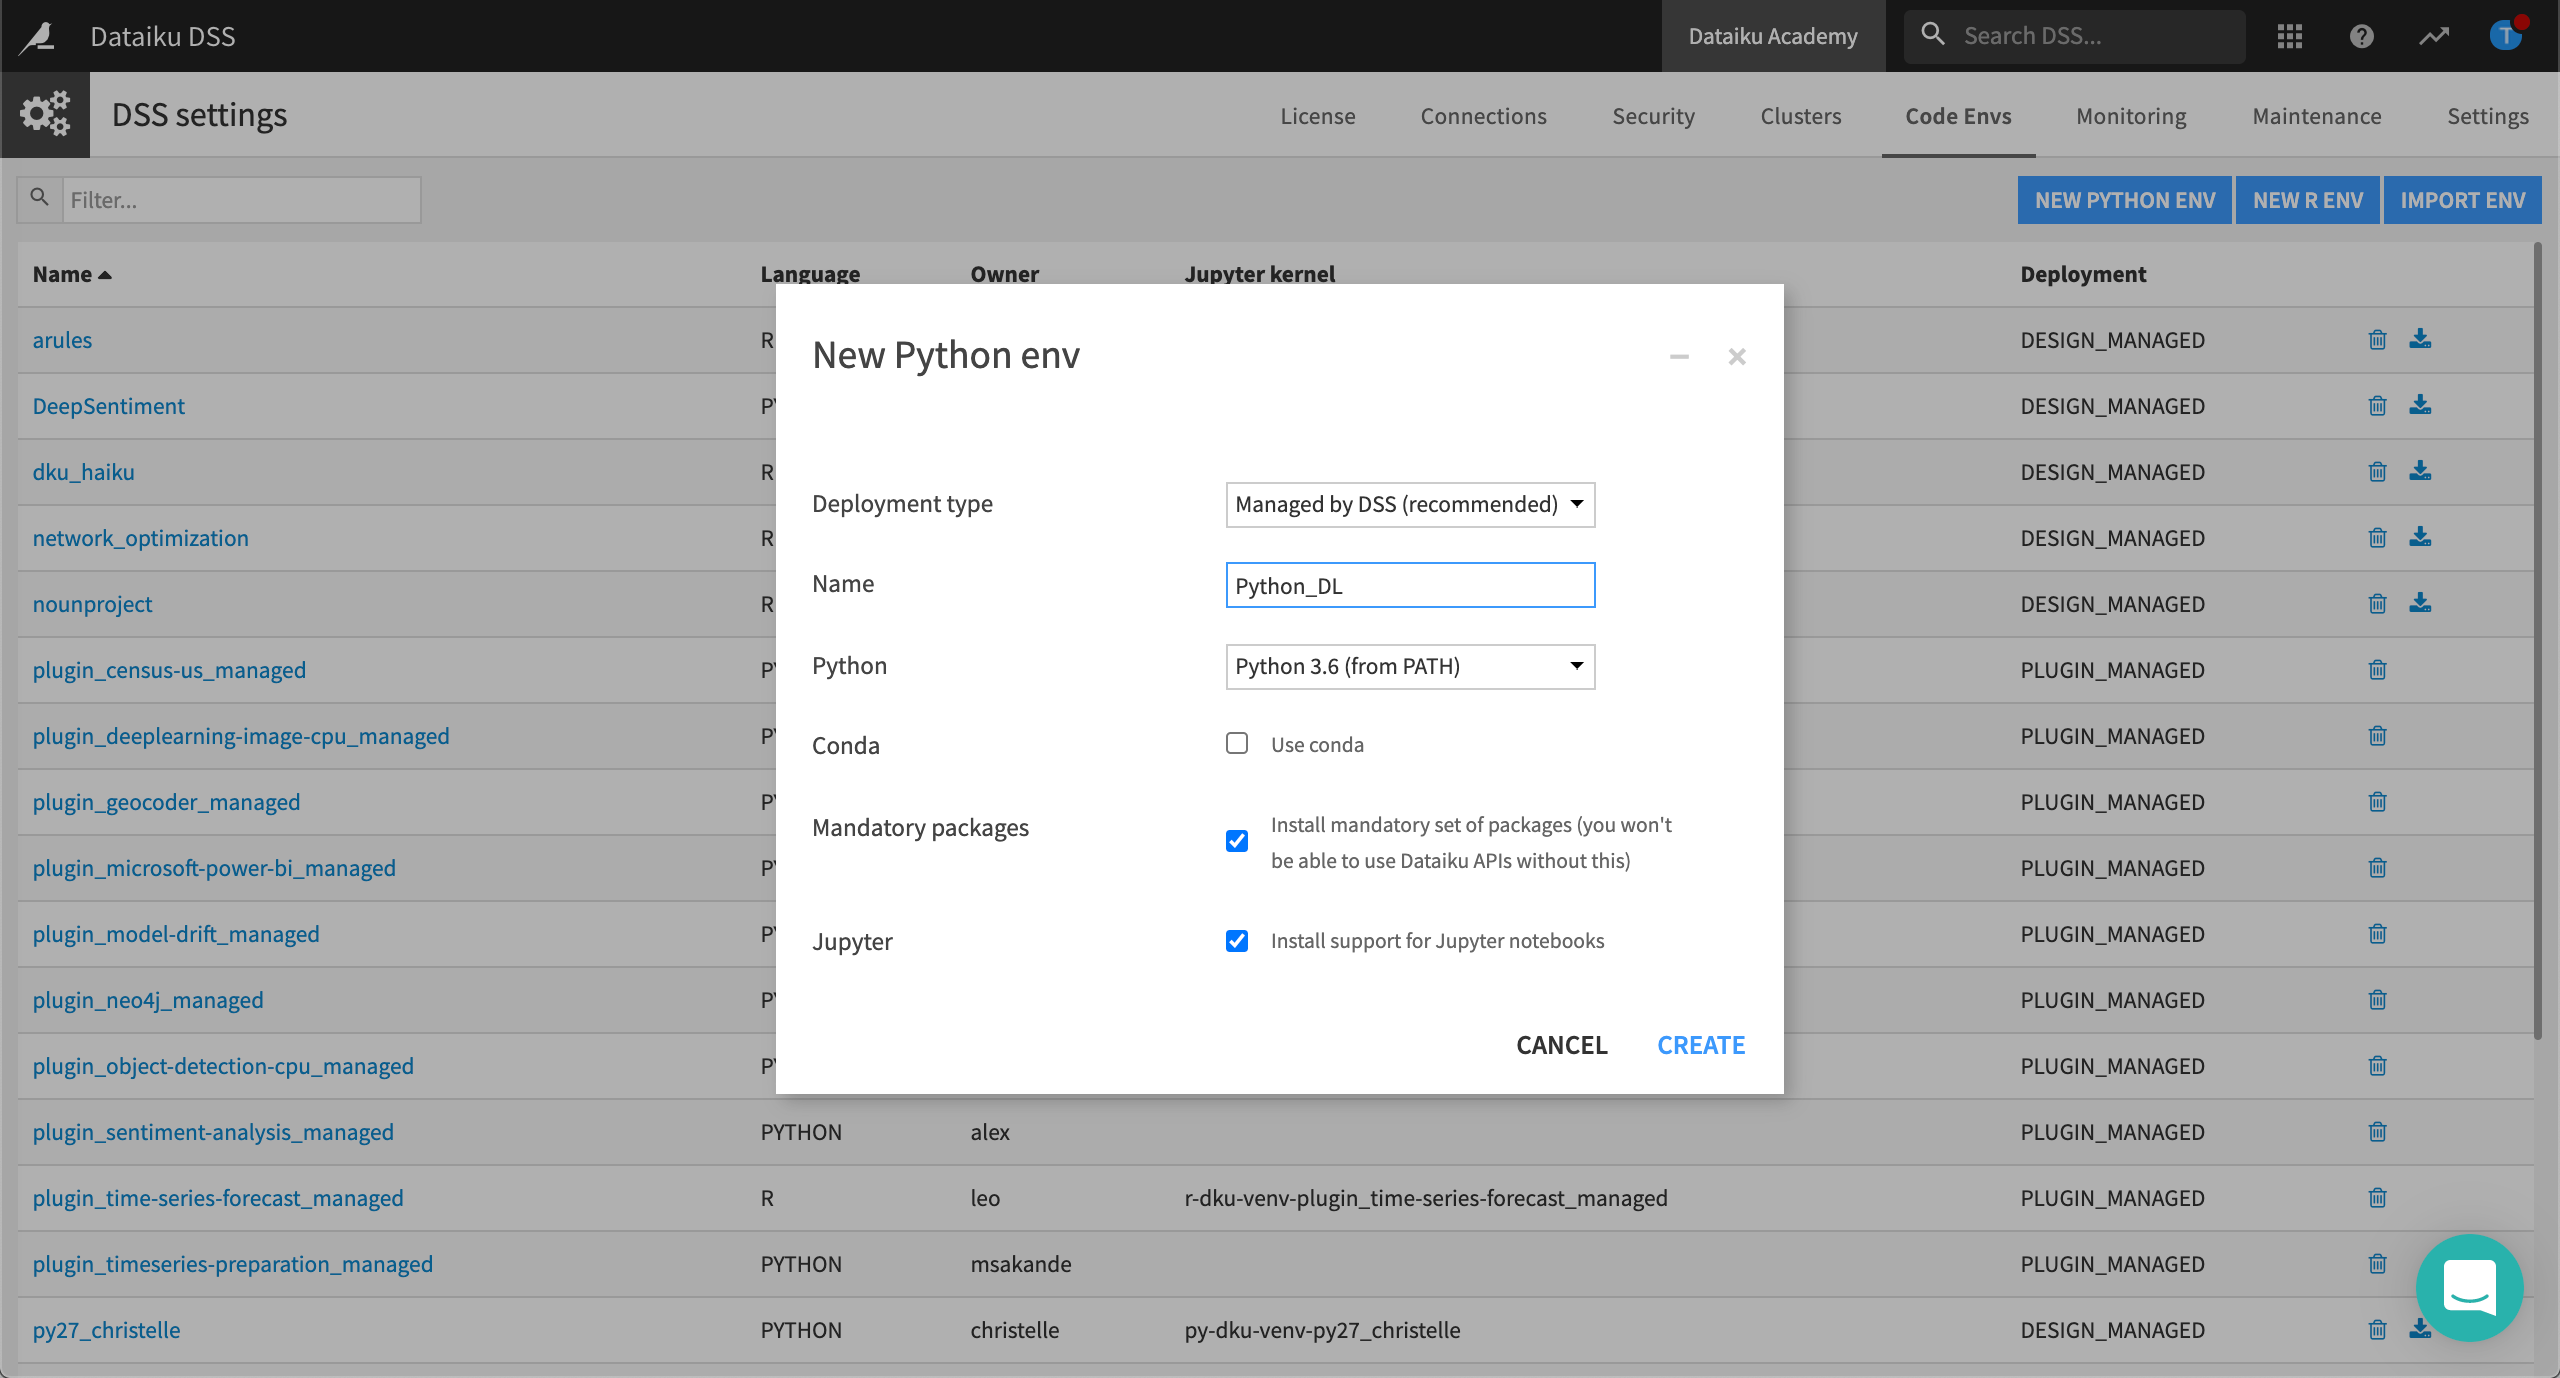
In the Code Envs tab, click New Python Env.
Name it “Python_DL”, select version Python 3.6,, then click Create.
Wait while Dataiku DSS creates the environment.
Install Additional Packages
Now we’ll install the set of mandatory packages.
From the Code Envs tab, locate and open the newly-created environment.
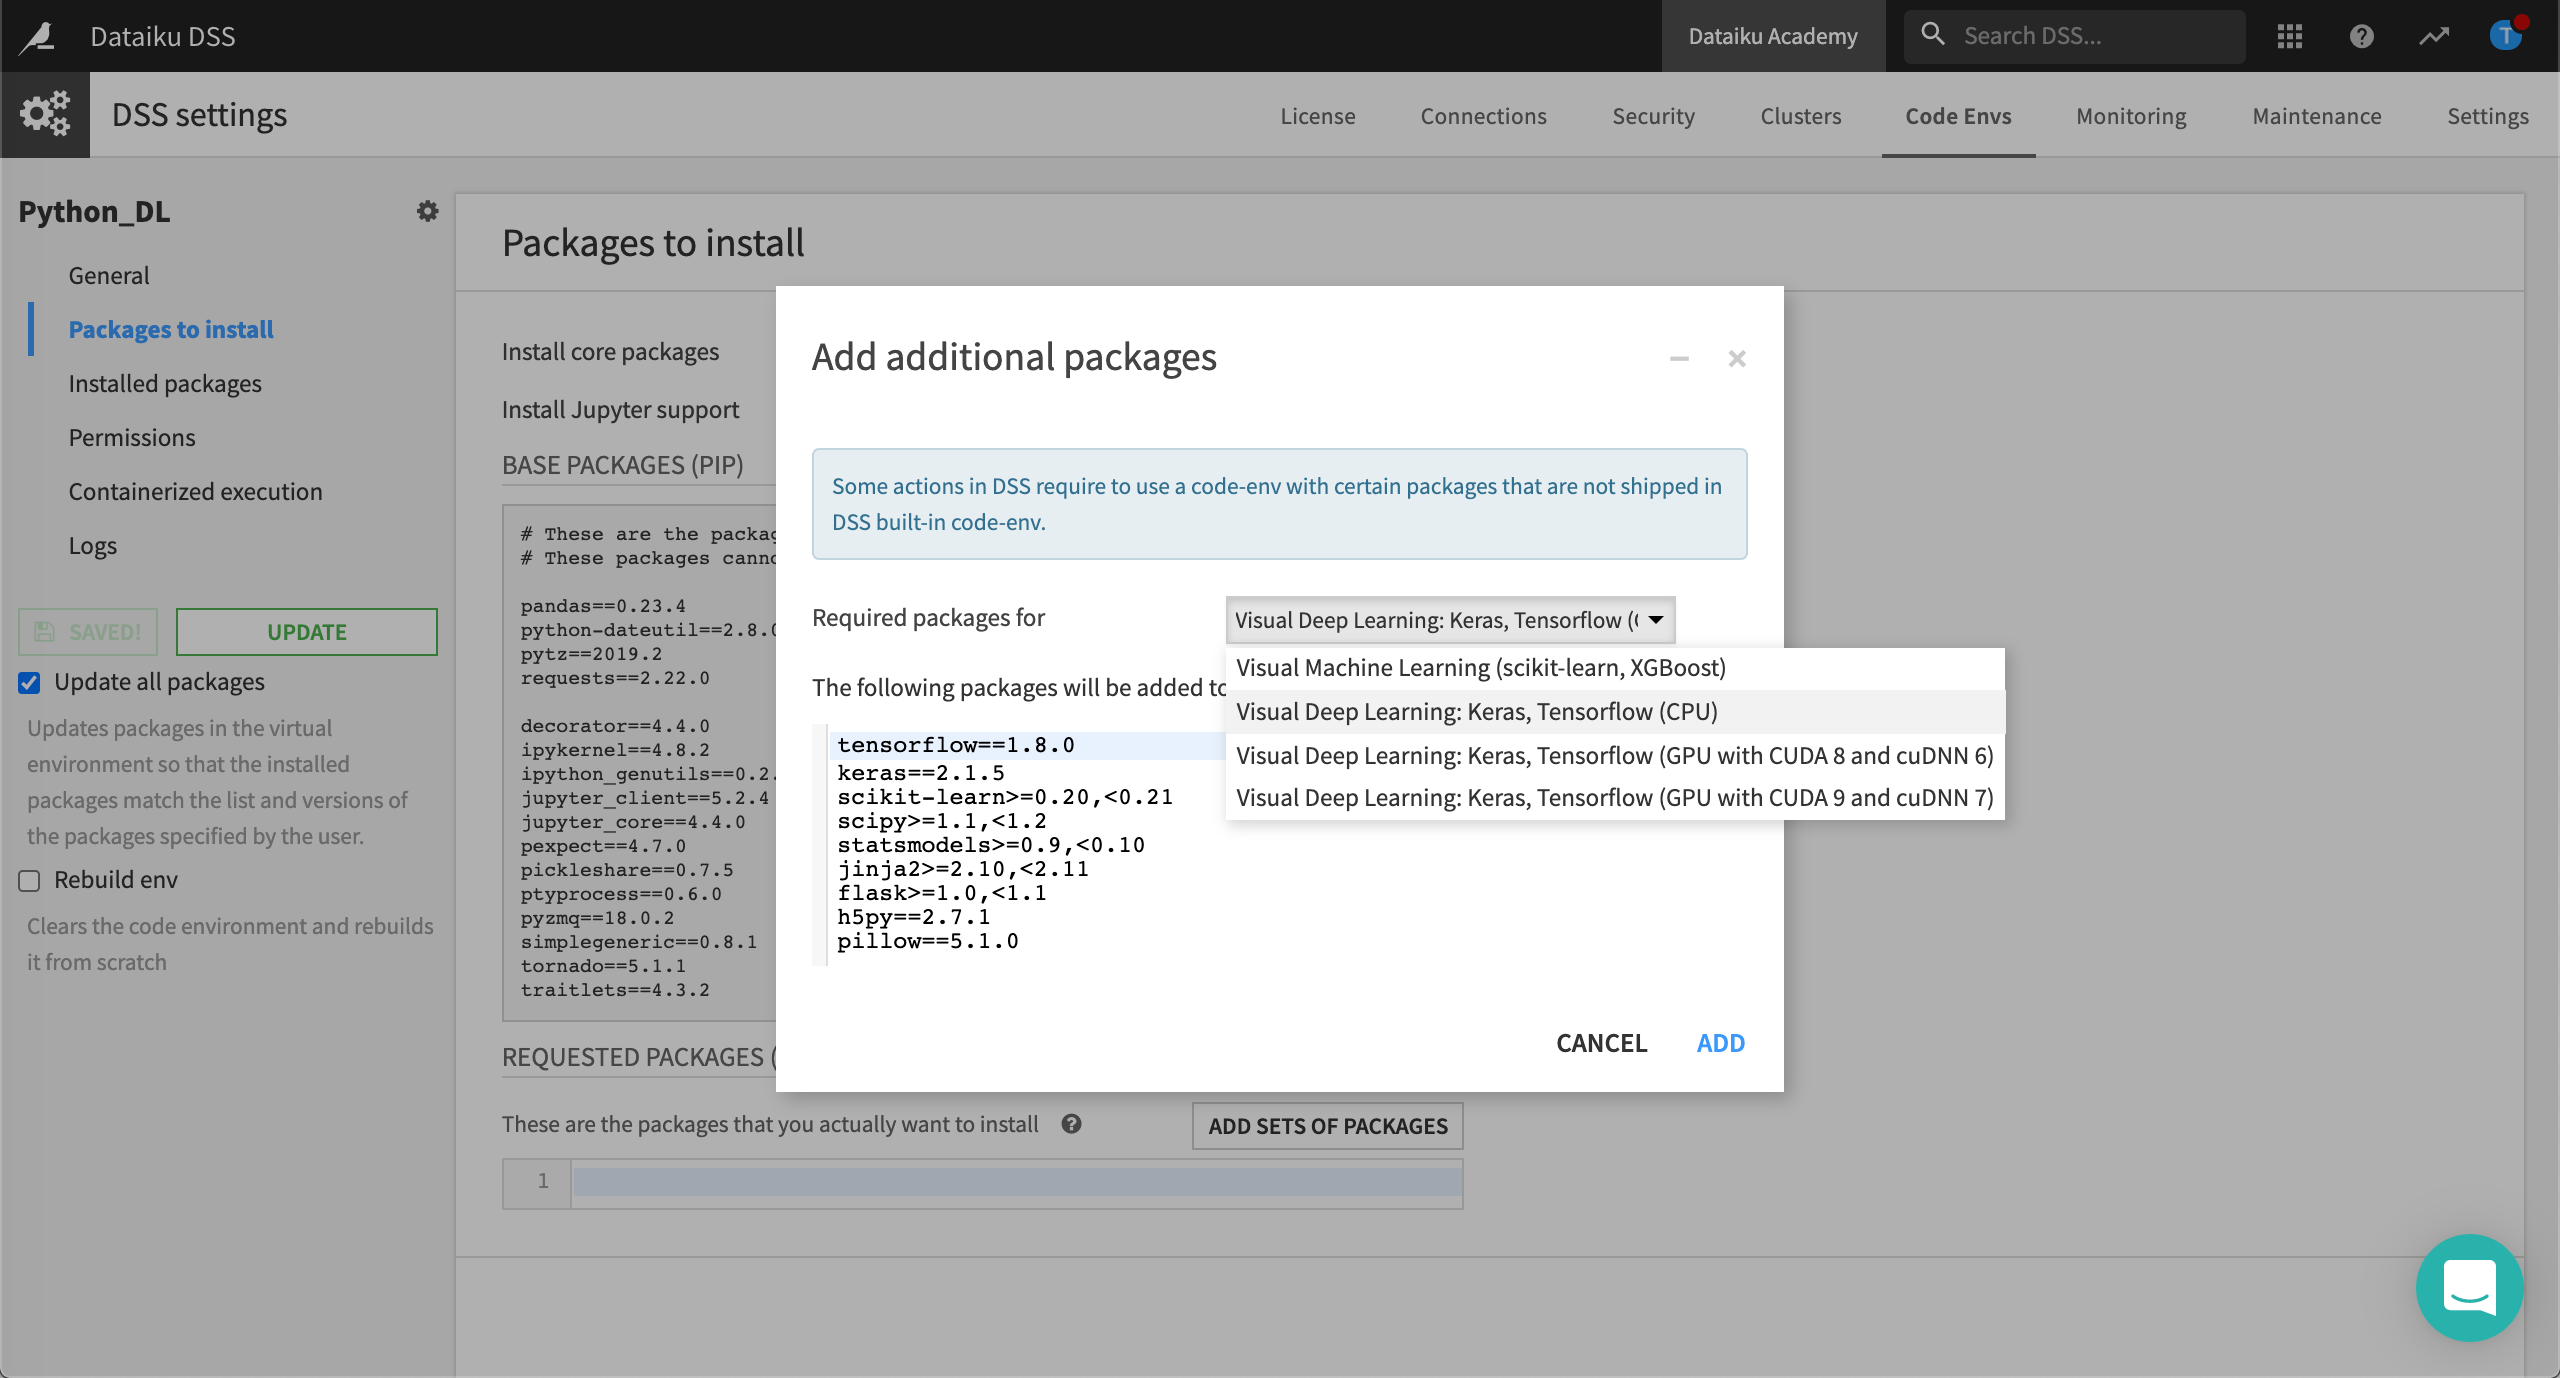
In the left panel, click Packages to install.
Click Add Sets of Packages.
In the Required package for dropdown, select Visual Deep Learning: Keras, Tensorflow (CPU) (or GPU if you install the GPU version of the Deep learning for images plugin).
Click Add, then click Save and Update. Dataiku DSS updates the environment.
Select the Code Environment in Your Webapp’s Settings
You’ll need to return to your webapp to select this new code environment. To do this:
Return to the Flow.
Select your webapp from the code menu, then choose the Edit tab.
Select the Settings tab.
In the Environment dropdown, select the name of your newly created code environment. Save your changes.
Edit the Python File and Replace Model_Folder with Your Own
The final step in setting up your webapp is to make sure the name of the model folder matches the name of the folder in your Flow.
In the webapp’s menu, select the Python tab.
In the Variables That Need To Be Set section, rename the model folder to “Retrained model”.
Save your changes, then click Backend to start the webapp.
Save your changes.

Congratulations! You can now monitor your model during re-training in the Scalar tab of your webapp.
Access the Tensorboard to Monitor Your Model
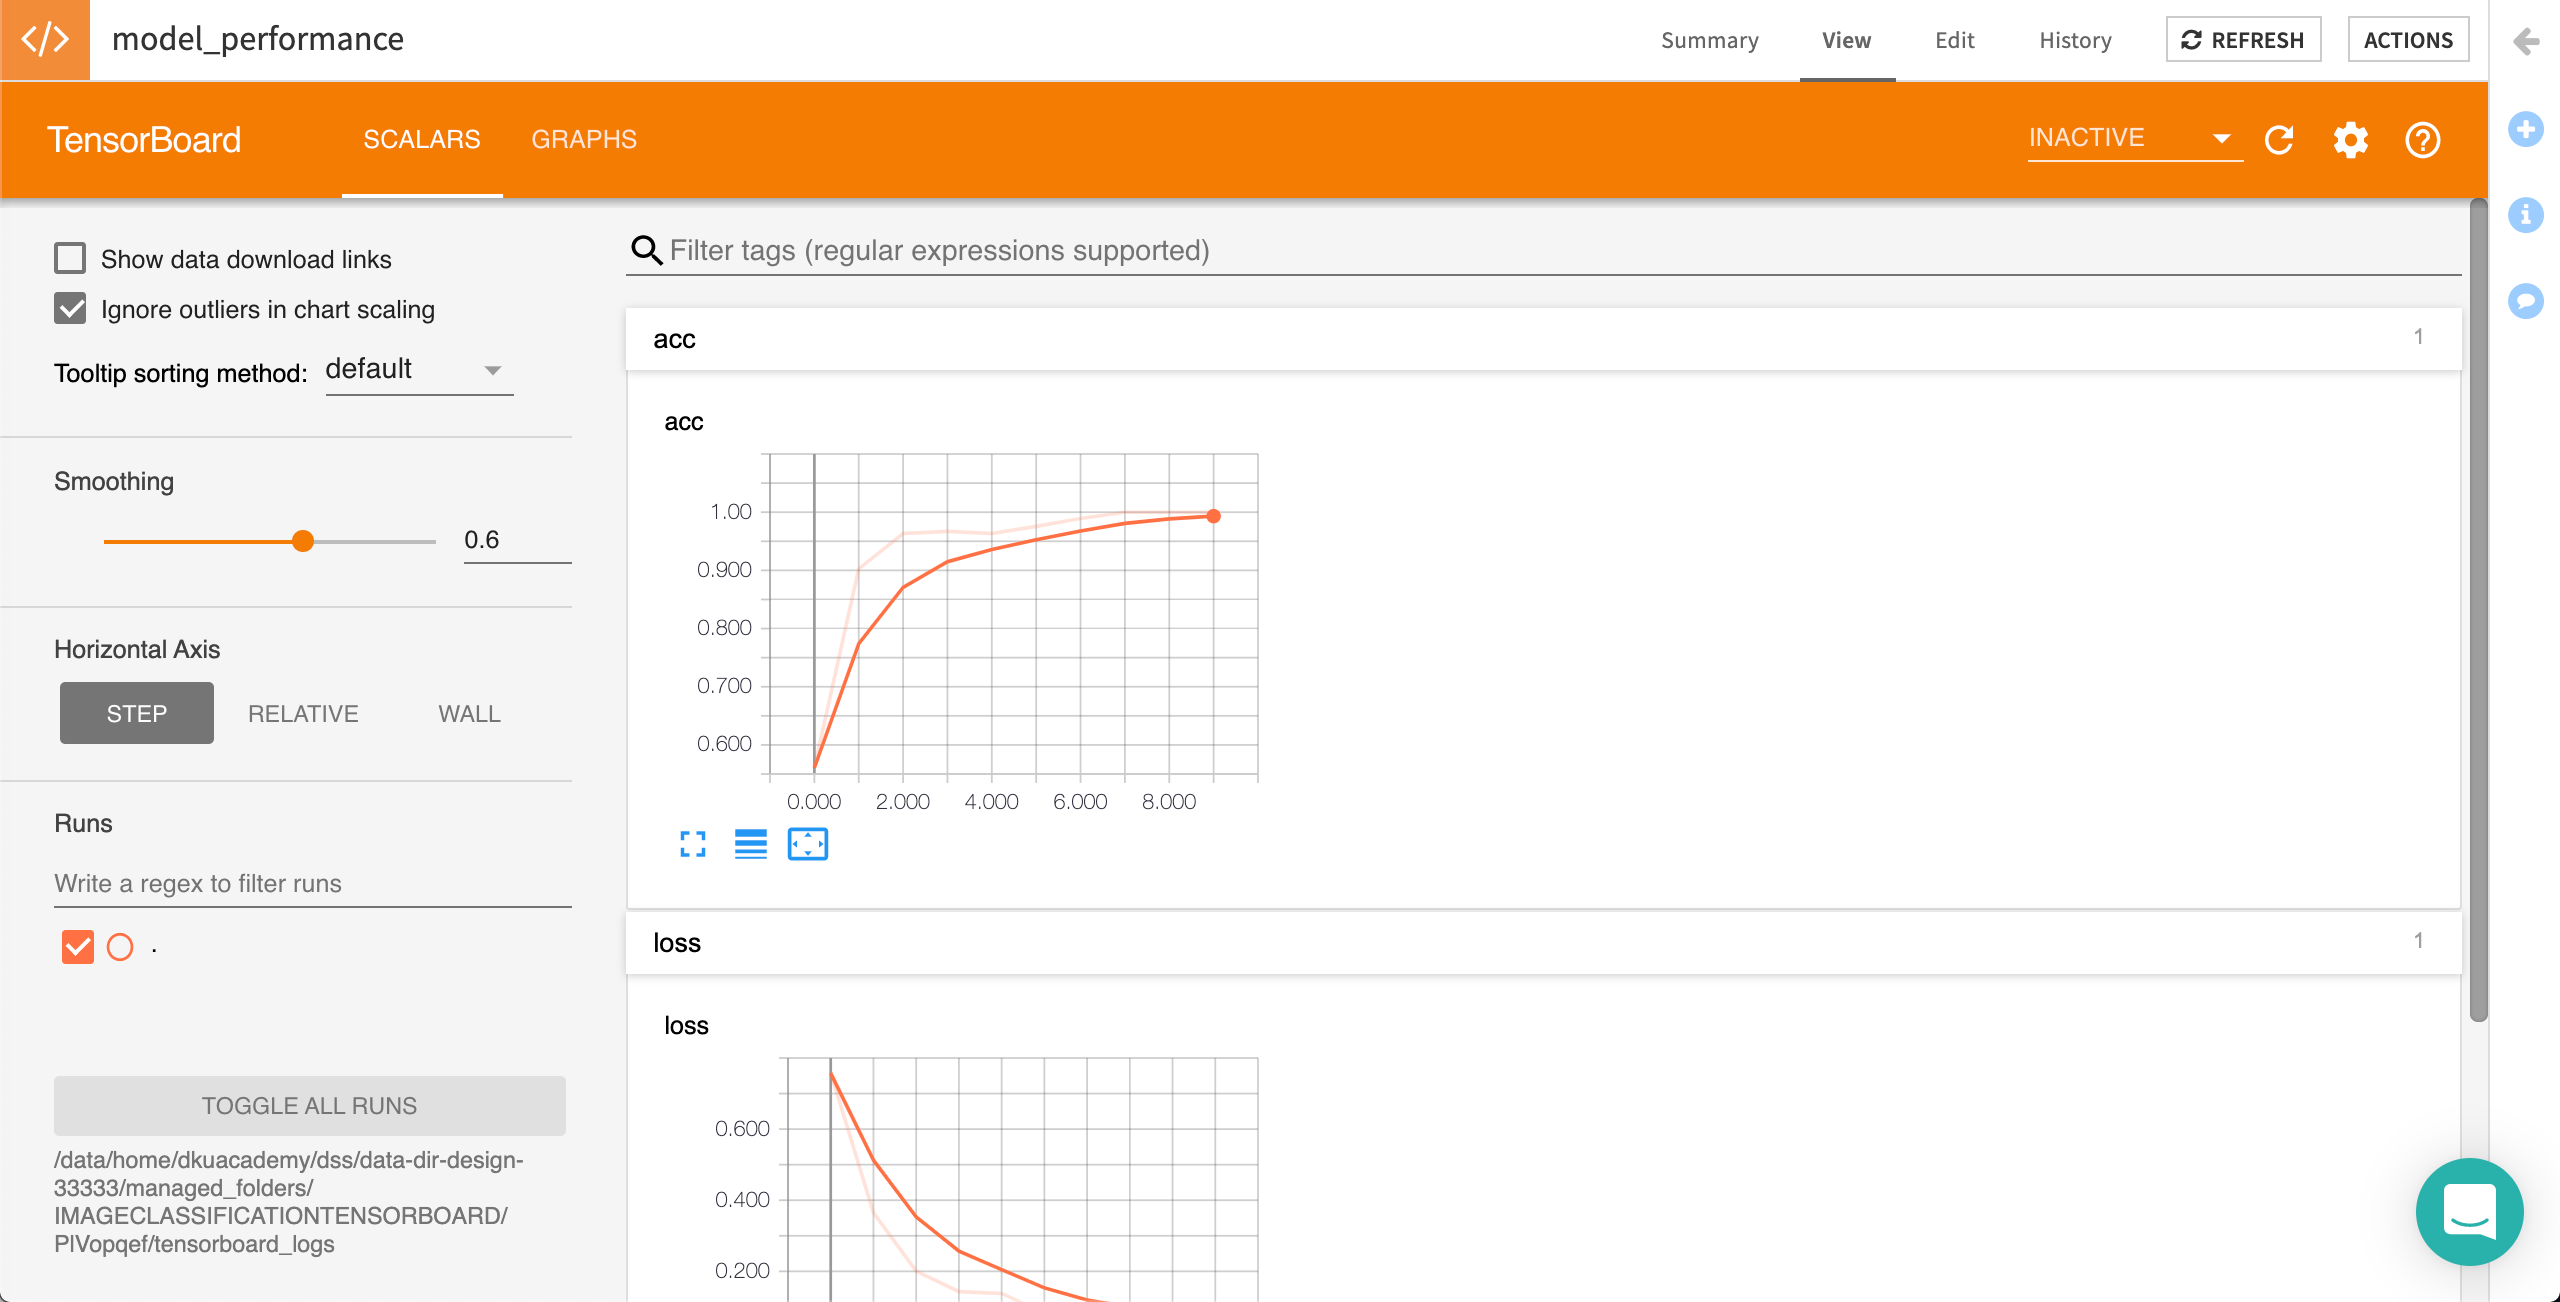
Tensorboard gathers all the metrics you need to interpret the results of your model both on the training set and the test set. Specifically, you can monitor the following:
The accuracy, acc. This is the accuracy on the train set towards steps. Likewise, val_acc is the accuracy on the test set.
The loss, loss in Tensorboard. This is the evolution of loss on the train set towards steps. Likewise, val_loss is the loss on the test set.
To do this: 1. Return to the Flow. 2. Select your webapp from the code menu. 3. Click Refresh.
Analyze Your Model’s Architecture
Understanding your model’s architecture is useful particularly when using your own model. In this lesson, we have used a pre-trained model where the last layer is being retrained. In the graphs tab of the Tensorboard, you can visually access the model’s infrastructure. The graphs display the visual structure of the model.
You can scan your graph, and fold and unfold your nodes. each layer will have a color corresponding to its structure. For example, all activation layers will have the same color.
You can change the color code by changing the selection. Selecting a color code per device instead of per instance can help you distinguish between devices, particularly if you are using different devices, such as different GPUs.
Select your webapp from the code menu, then choose the Edit tab.
Locate Color in the left panel, then select the device option.
Your results will differ from the results show in the example: .. image:: _img/image-class-visual-way21
Note
The Trace input option displays all of the dependencies for a node in the whole graph.
What’s Next
So far, you have added a pre-trained model to your Flow using a plugin, and used the model to classify a set of test images. Then you used a folder of training images to improve the pre-trained model with transfer learning. In other words, you completed the task of object classification. You also learned how to monitor the re-training of your model and understand your model’s architecture using Tensorboard.
In the final set of hands-on lessons, you’ll use your project to perform an object detection task using another deep learning plugin.