Hands-On: Variables for Coders
Hard-coded text strings are difficult to maintain and cannot be programmatically updated. In programming, variables store pieces of information, such as the name of a country or the name of a merchant. Once defined, you can use your variables many times in visual and code recipes–to make development tasks more efficient and automation tasks more robust.
Let’s Get Started!
In this hands-on tutorial, we will refactor an eCommerce transactions project. We’ll turn hard-coded text strings into project variables that can be programmatically updated.
Objectives
The objectives for this tutorial are as follows:
Define project-level variables.
Use project variables in visual and code recipes.
Create an automation scenario to update a variable. This will enable you to build an application to programmatically update the variable.
Prerequisites
To complete this tutorial, you’ll need the following:
Dataiku DSS - version 8.0 or above.
A Python environment that includes the package matplotlib.
Note
The 14-Day Free Online Trial contains a code environment, “dash”, that includes everything you need to complete the courses in the Developer learning path.
Note
This tutorial was tested using a Python 3.6 code environment. Other Python versions may be compatible.
Create the Project
From the Dataiku homepage, click +New Project, select DSS Tutorials from the list, and select Developer > Variables for Coders (Tutorial). Click on Go to Flow.
Ignore warning messages by clicking OK. The imported project was created on a design node with specific plugins installed. These plugins are not needed to complete this tutorial.
Set the Code Environment
Let’s designate this project’s code environment, one that uses Python 3.6 and has the package matplotlib (which will be needed later).
From the More options menu in the top navigation bar, select Settings > Code env selection.
Change the default Python code env by changing the Mode to “Select an environment” and the Environment to the chosen code env.
Click Save.
Click the Flow icon to return to the Flow.
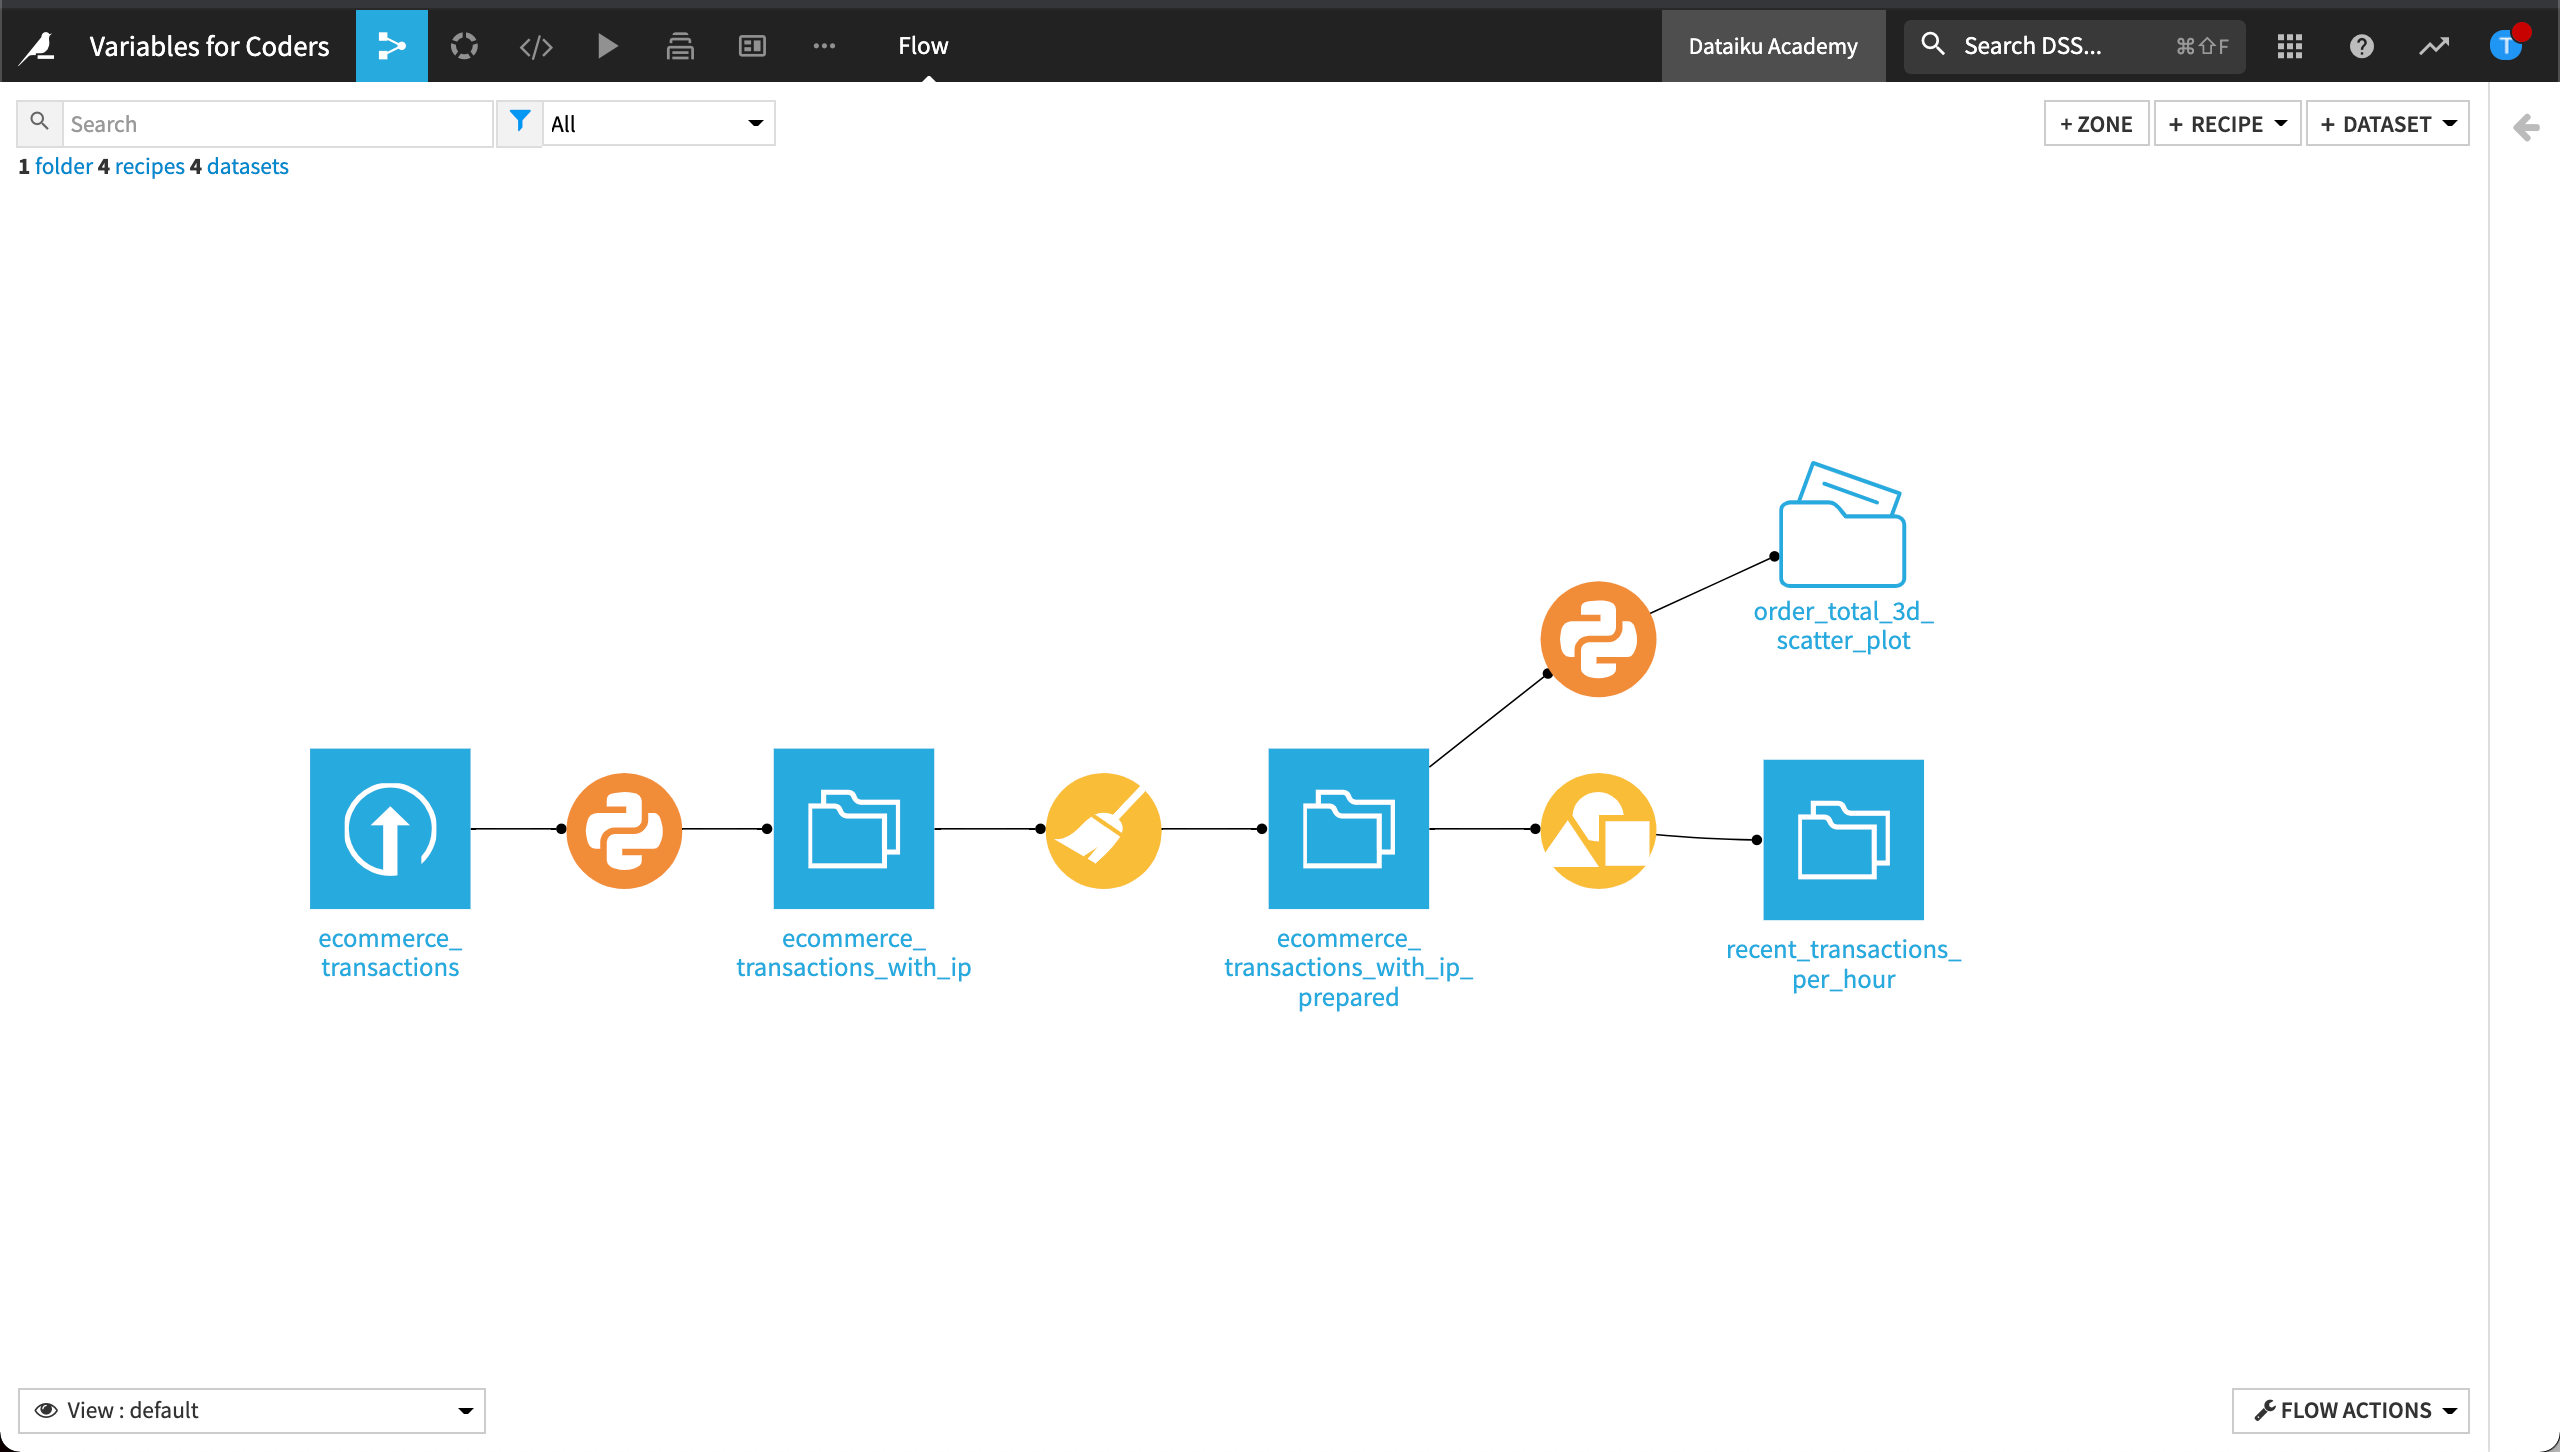
Build the Flow
The initial starter Flow contains empty datasets. To work with these datasets, we’ll need to build the Flow.
Click Flow Actions from the bottom-right corner of your window.
Select Build all and keep the default selection for handling dependencies.
Click Build.
Wait for the build to finish, and then refresh the page to see the built Flow.
Explore the Flow
Let’s look for areas in the Flow where we could use project variables.
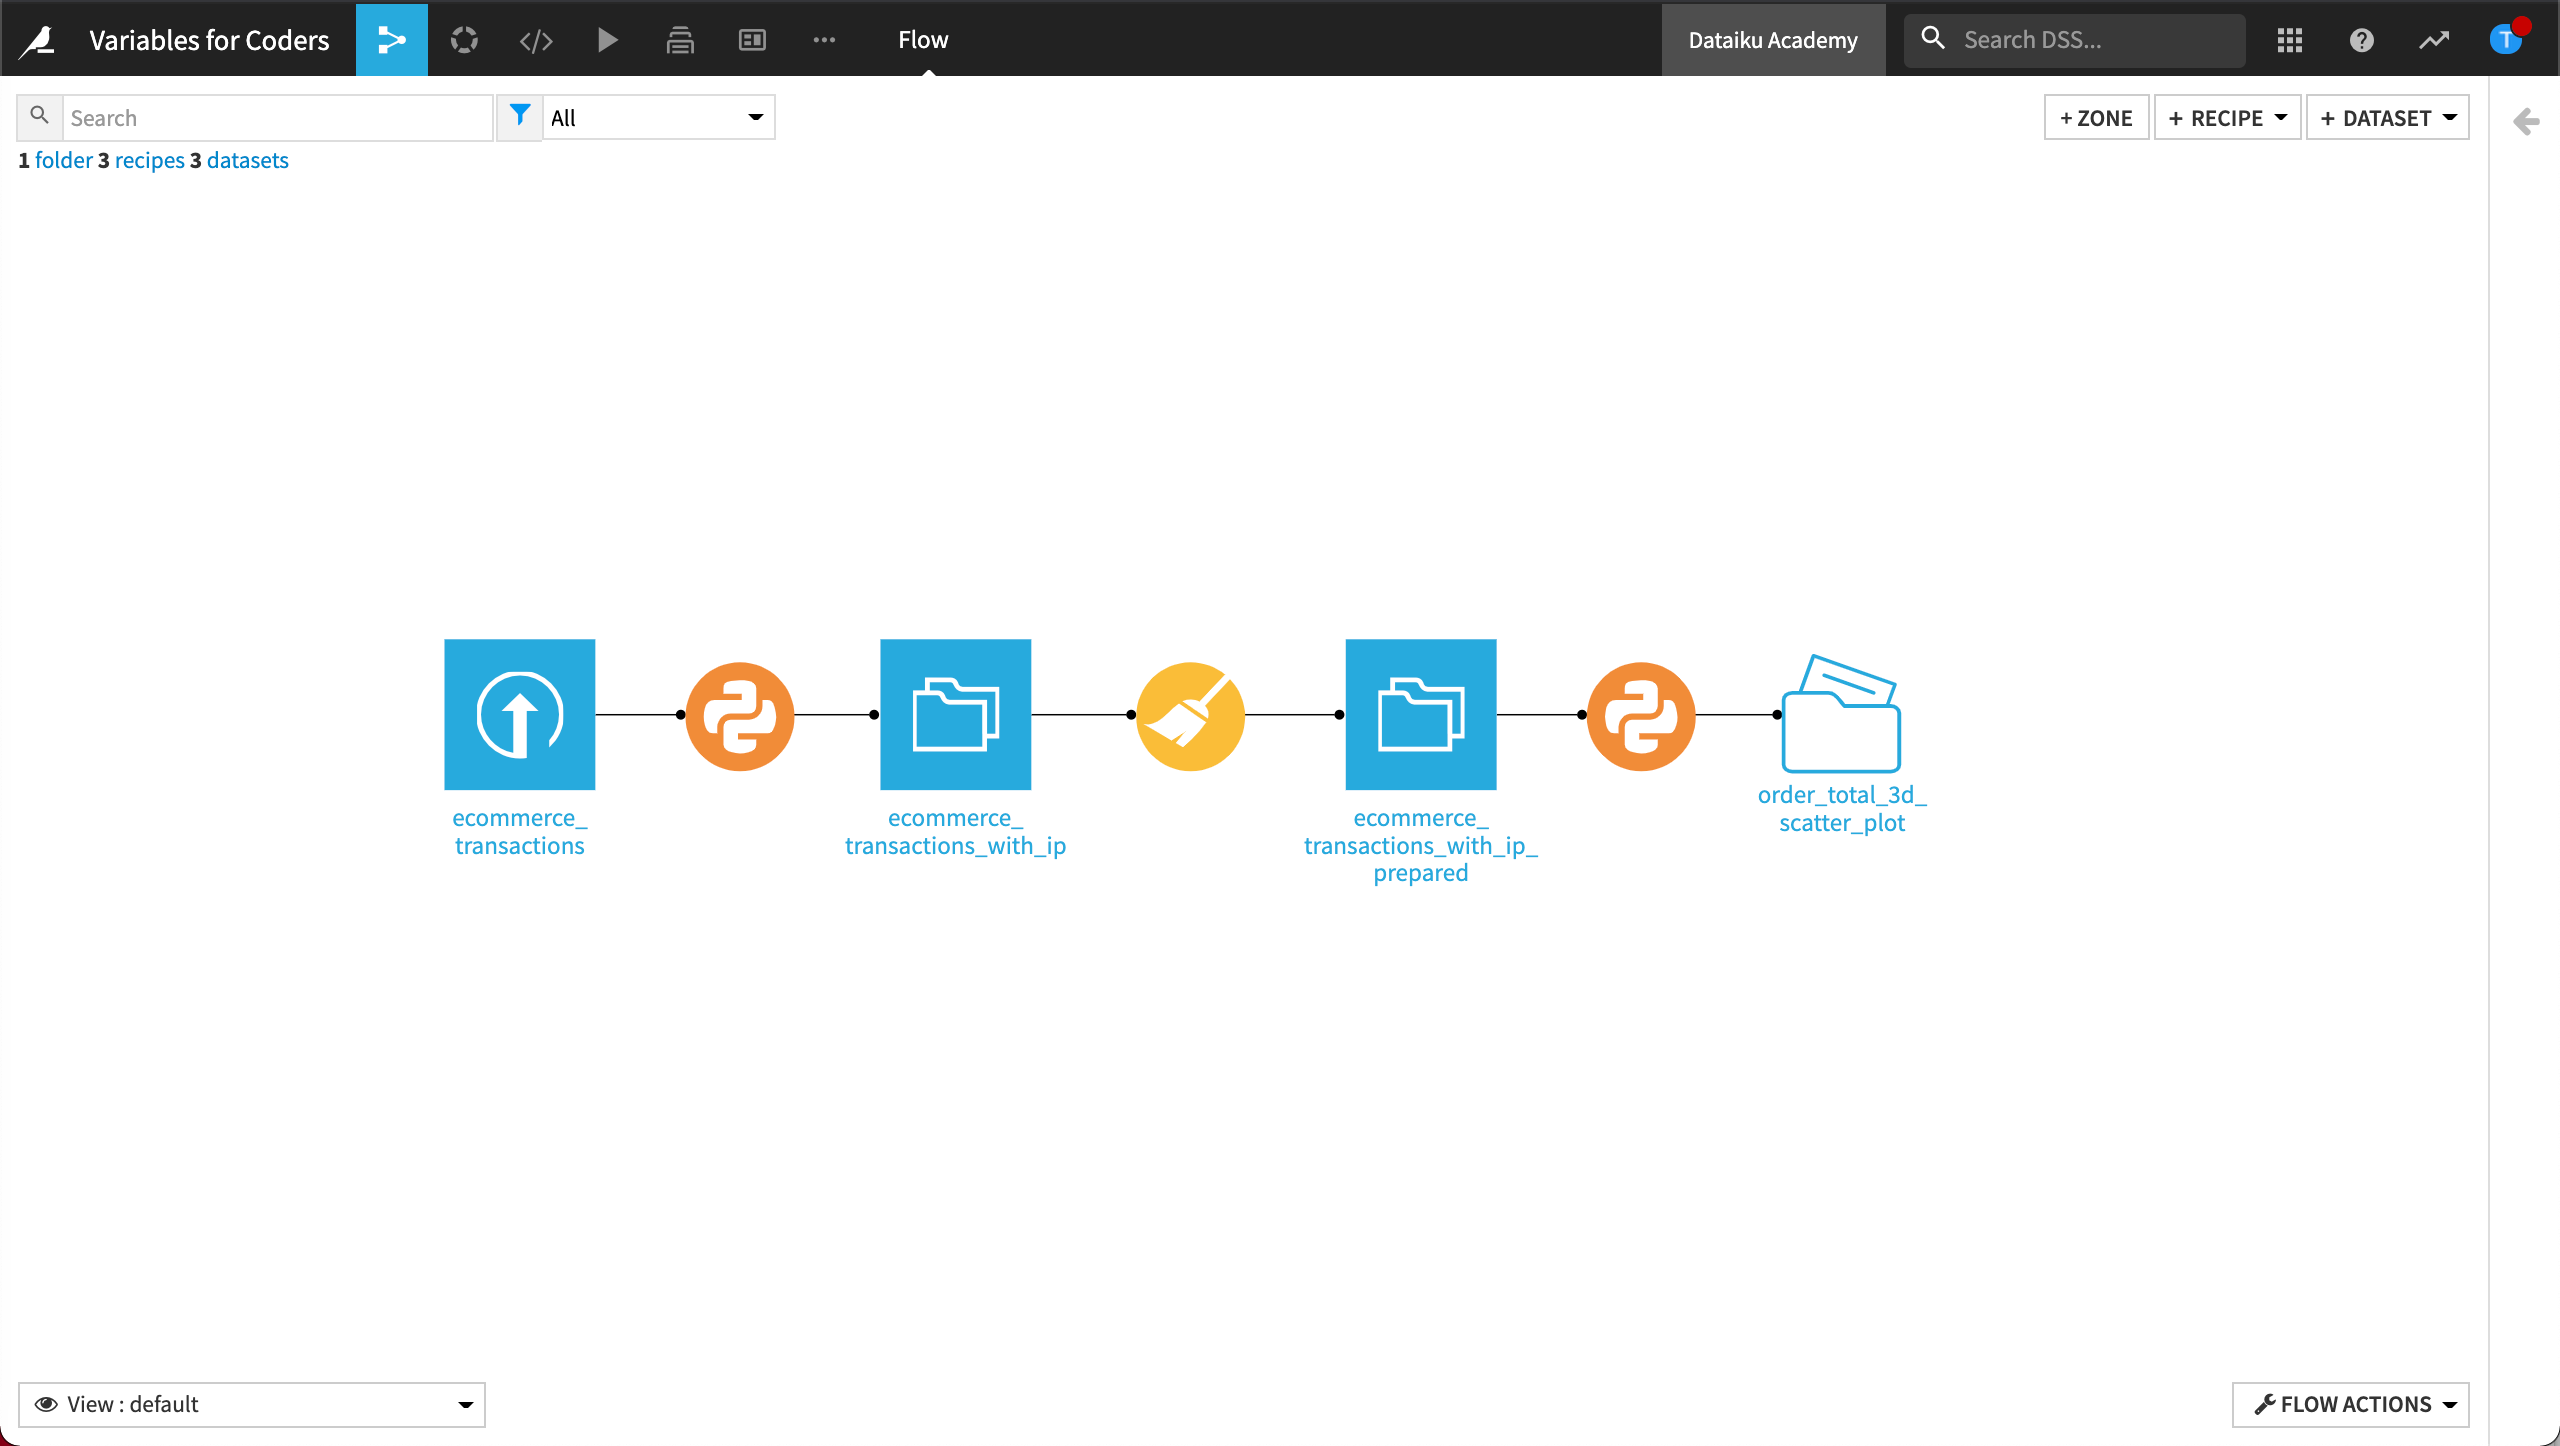
Open the Python recipe which outputs the managed folder.
Notice that the country, “United States”, is hard-coded.
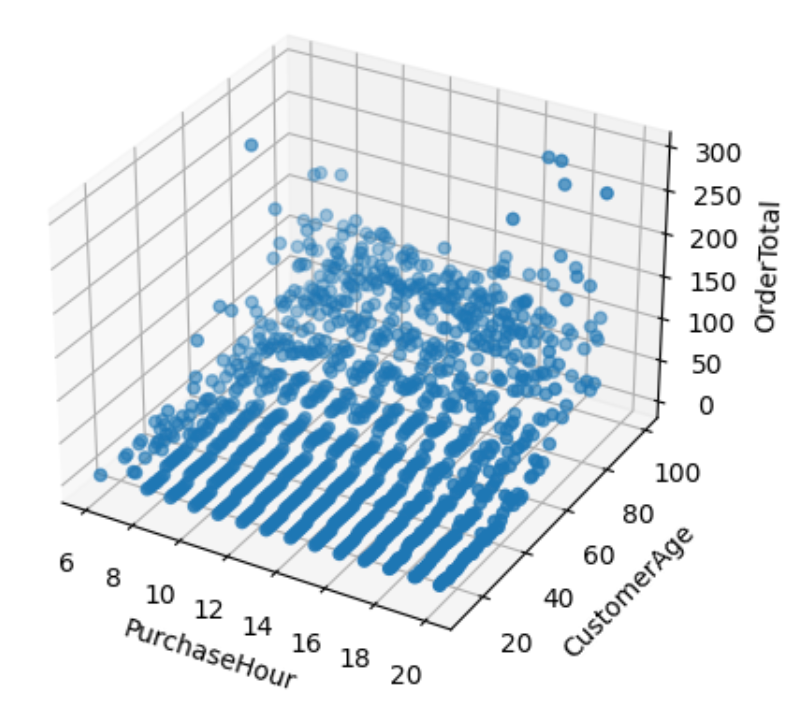
This recipe outputs a 3D scatter plot that displays order totals using a specific country name (in this case, “United States”) based on the customer’s age and time of purchase.
We want to avoid having to manually update the country name each time we build the scatter plot. We’ll replace the text string, United States, with a project variable so that we can programmatically update it.
We also want to output a dataset of transactions for the “most recent date”, grouped by purchase hour, for the specified merchant URL. To meet these business requirements, we’ll define three project variables.
Define Project Variables
In this section, we’ll define our project variables.
From the top navigation bar, go to the More Options menu, then choose Variables.
Define the following project variables under the Global variables section:
{
"country_name": "Germany",
"merchant_url": "costco",
"most_recent_date": "2011-12-09"
}
Using this code, we’ve specified arbitrary values as the initial values for the global variables.
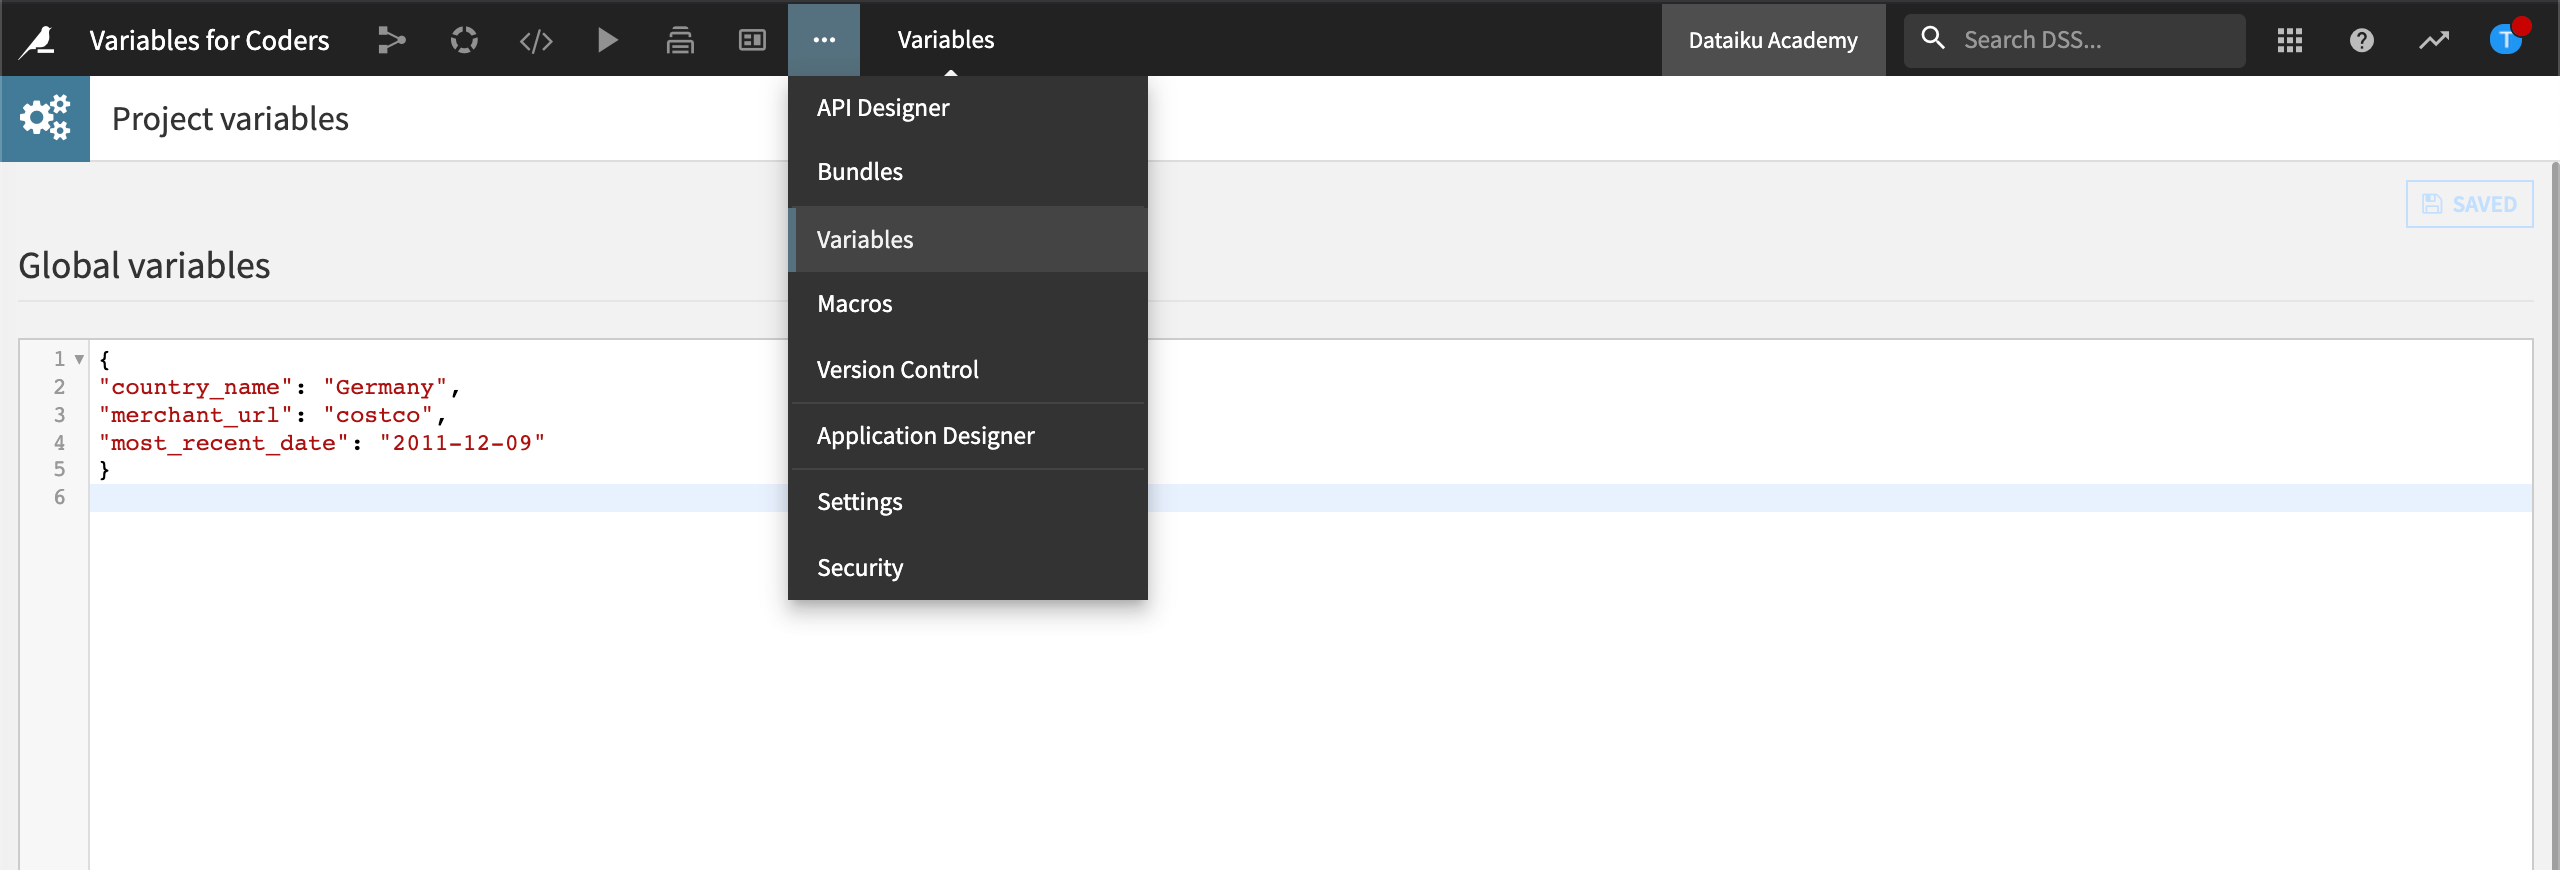
Click Save.
Return to the Flow.
Next, we’ll use these newly defined project variables within code recipes in the Flow.
Modify the Flow to Use the Project Variables
In this section, we’ll refactor the project to use project variables.
Update the Python Recipe
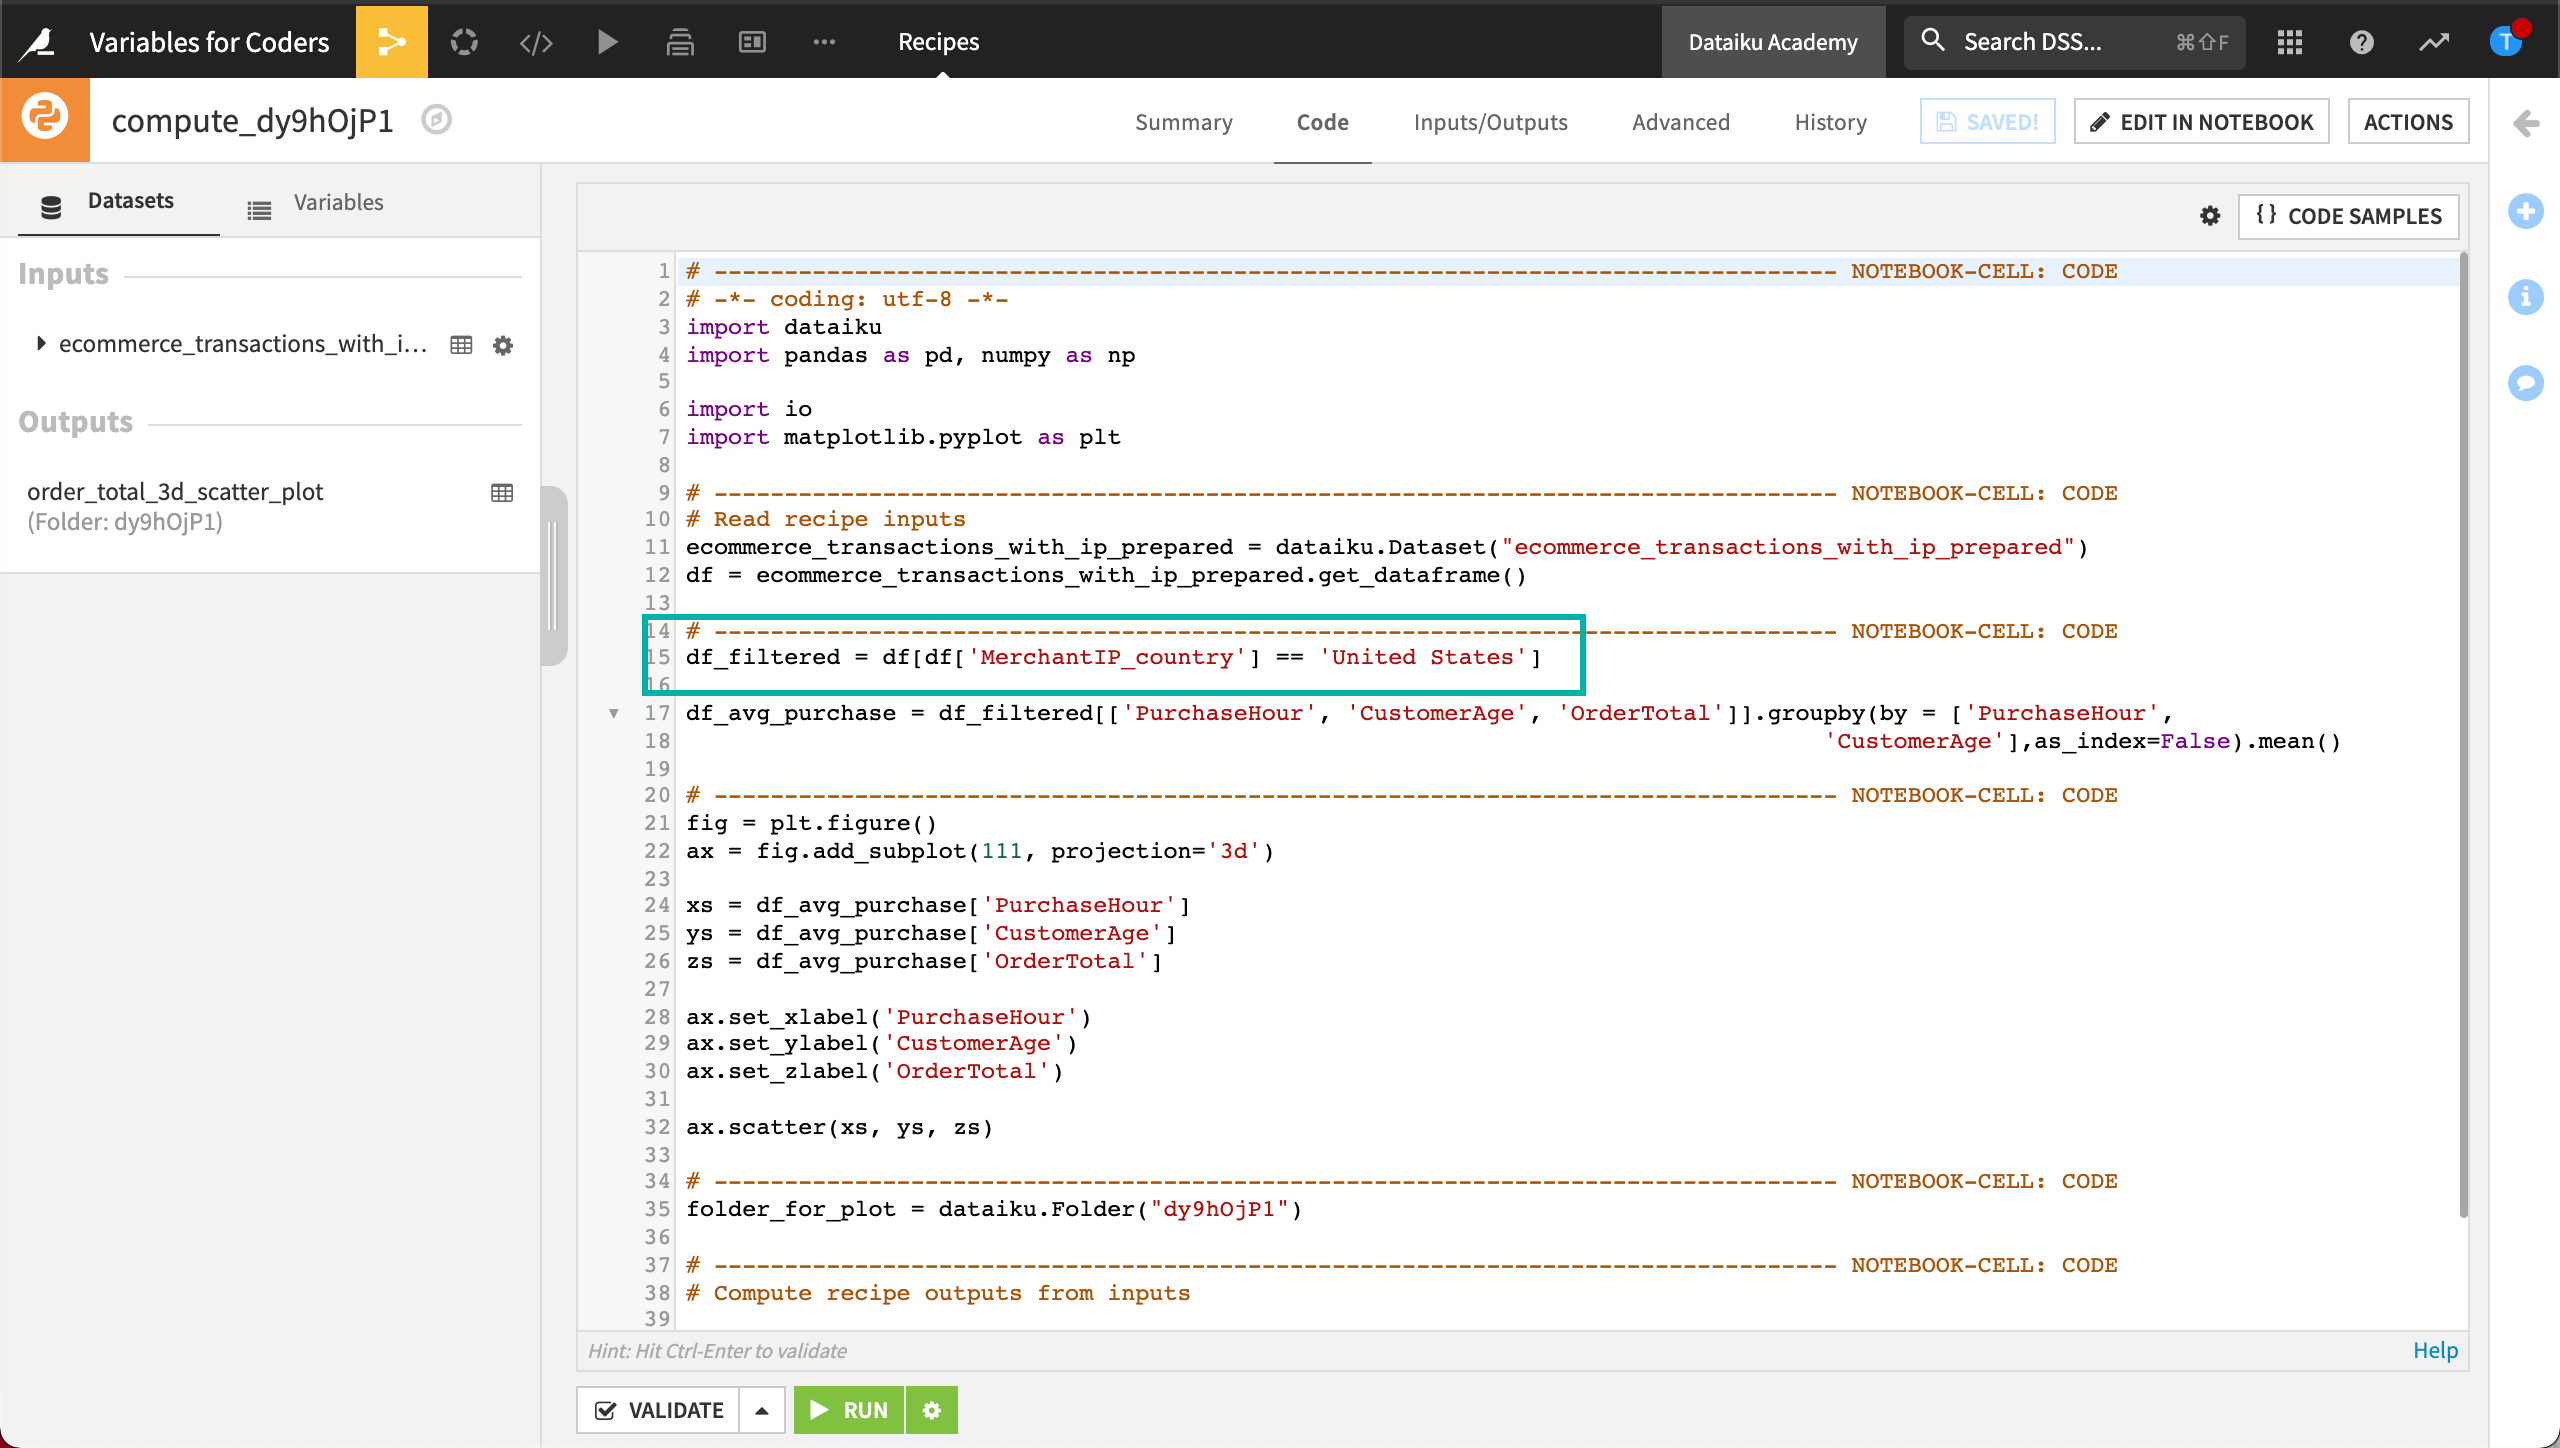
Let’s use the “country_name” variable within our Python recipe to allow a dynamic way of creating the 3D scatter plot. * Open the Python recipe that outputs the managed folder.
In the recipe’s editor, make the following edits:
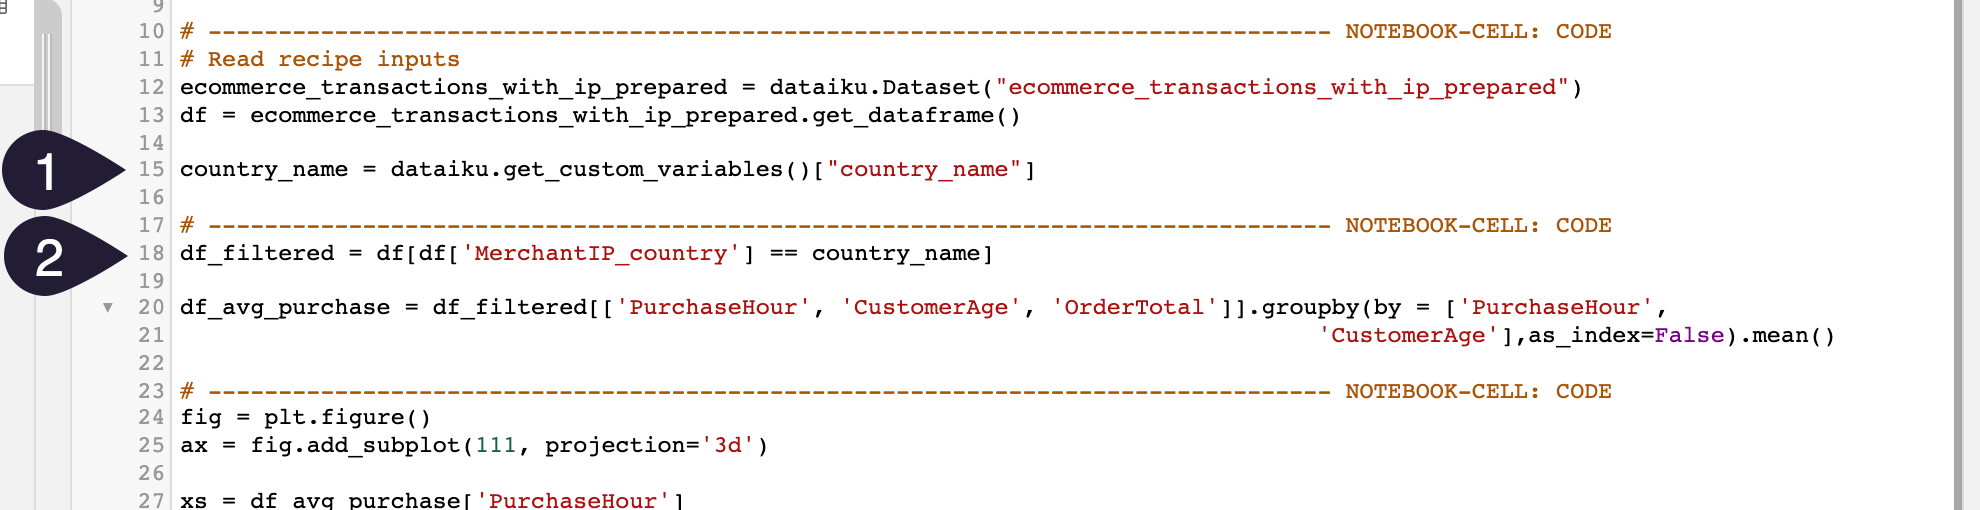
Get a handle on the custom variable,
country_name, just before filtering the DataFrame.
country_name = dataiku.get_custom_variables()["country_name"]
Hint
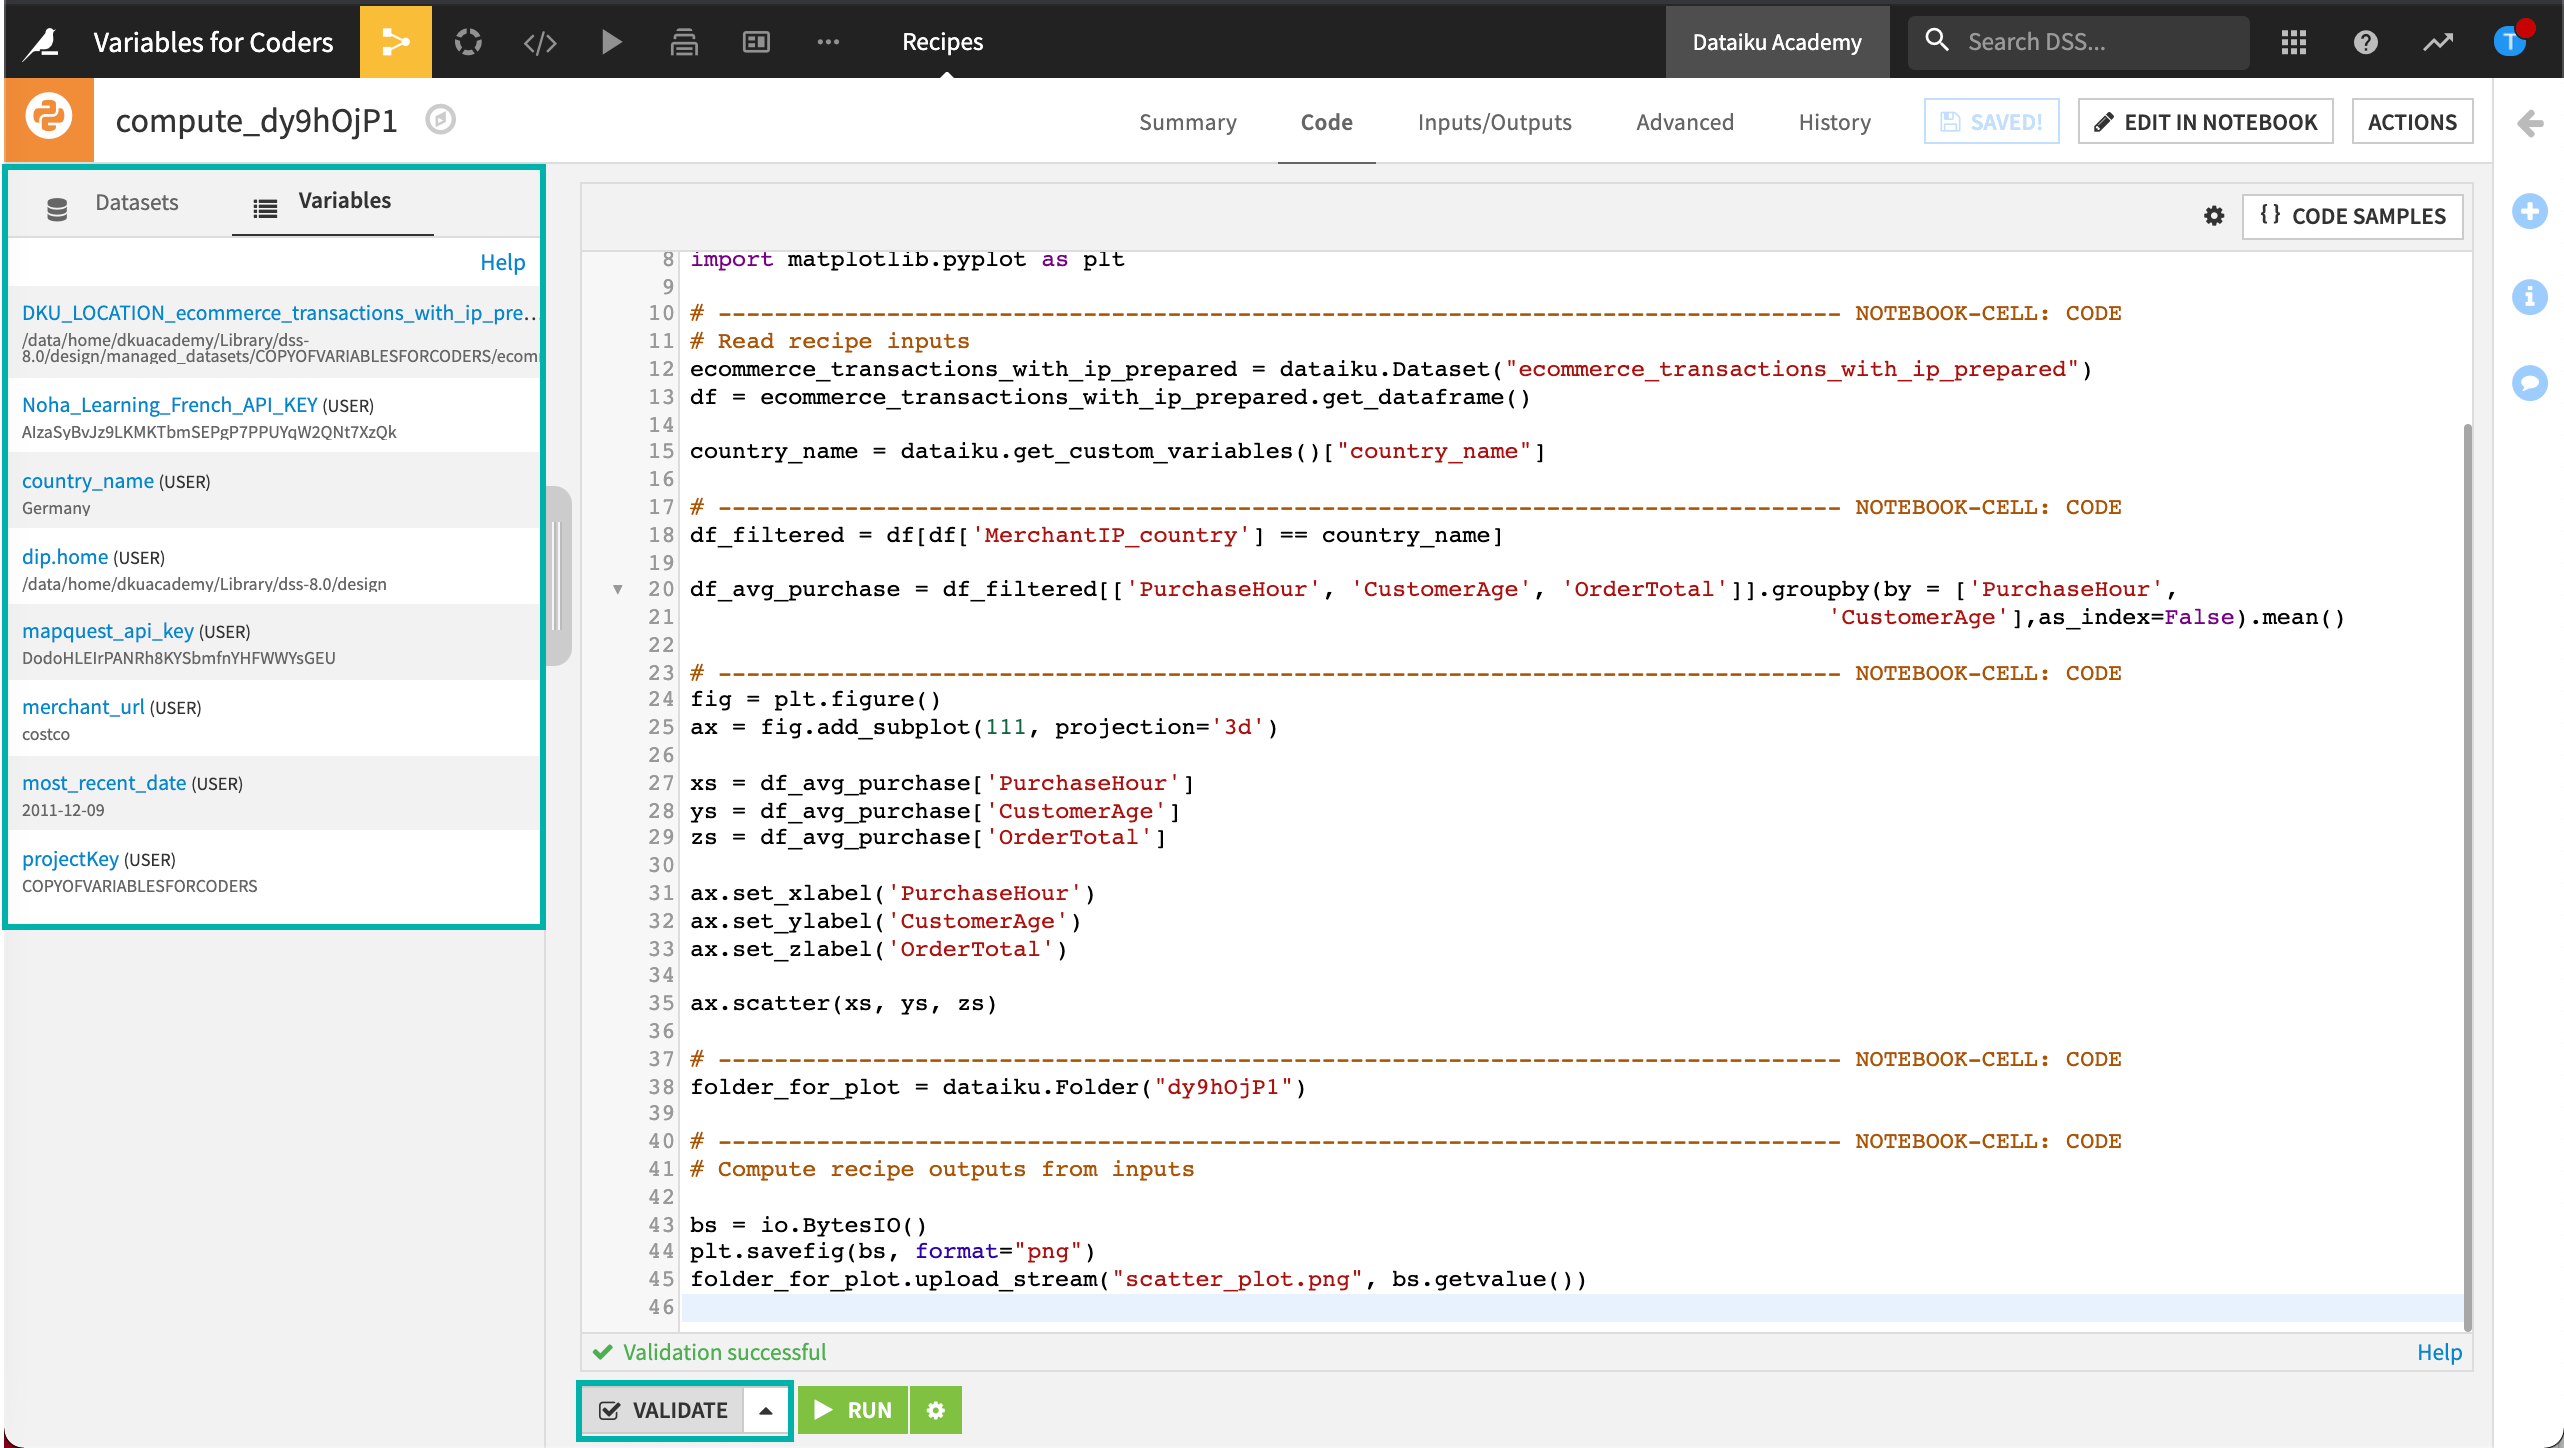
Click the Variables tab in the left-side panel. To see the list of variables, first validate your code. Then click on the variable to insert it into your code.
Replace “United States” with
country_name.
df_filtered = df[df['MerchantIP_country'] == country_name]
Run the recipe.
Wait for the job to complete, then click to view the folder order_total_3d_scatter_plot.
Open the new scatter plot.
The plot is for Germany transactions, the country defined in our project variables. As an exercise, you can try to customize the name of the output image file by using the variable country_name. Later, we’ll create a scenario and a Dataiku application so that others can choose the country to be plotted.
Create a Group Recipe
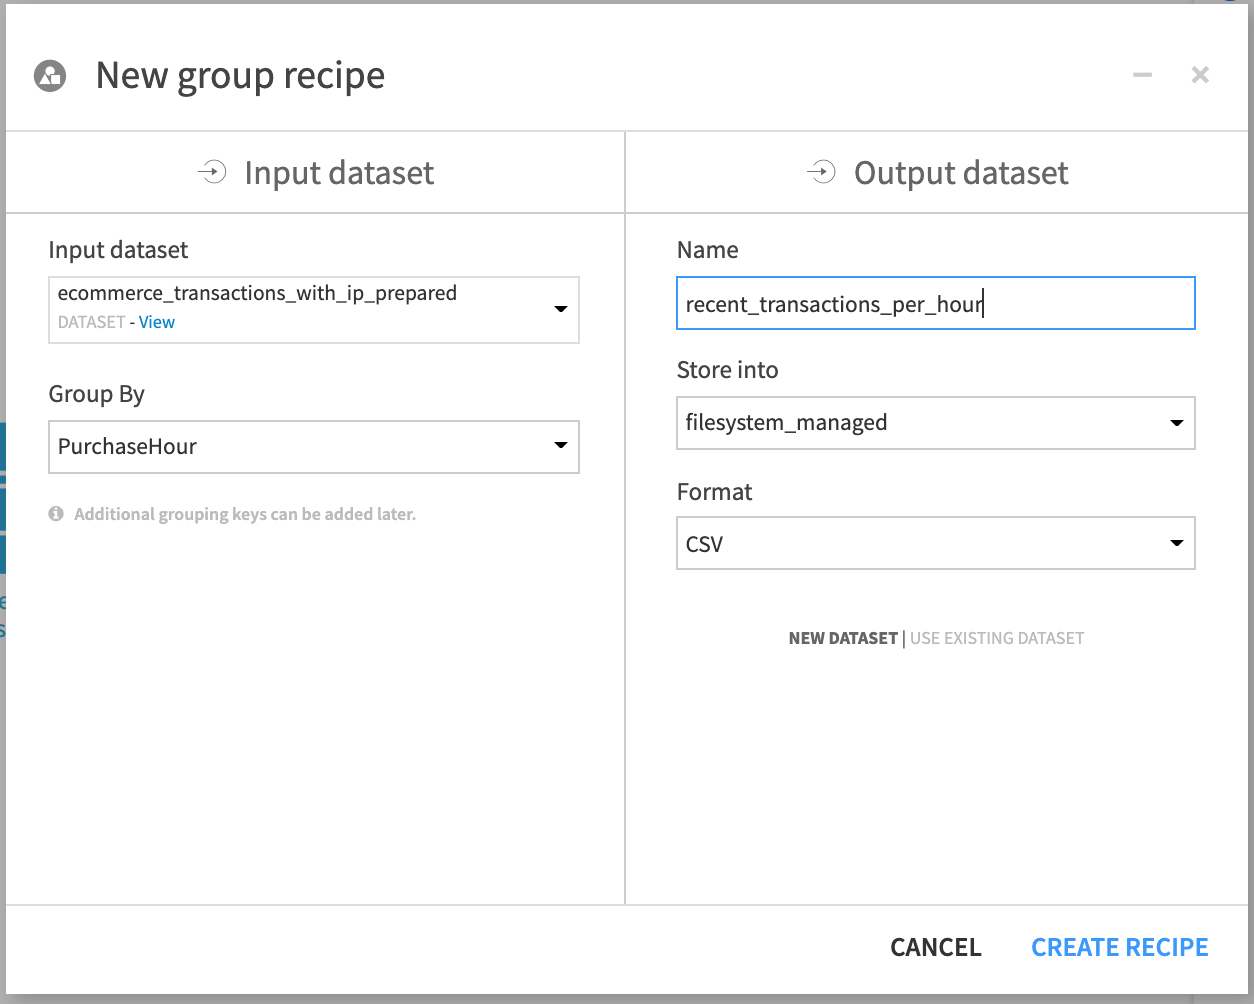
Recall that we want to be able to output a dataset of transactions for “the most recent date”, grouped by purchase hour, for a merchant URL. To do this, let’s create a Group recipe.
Return to the Flow and select the ecommerce_transactions_with_ip_prepared dataset.
Open the Actions right-side panel and select the Group recipe.
Configure the New Group recipe to group by PurchaseHour, and name the output dataset recent_transactions_per_hour.
Click Create Recipe.
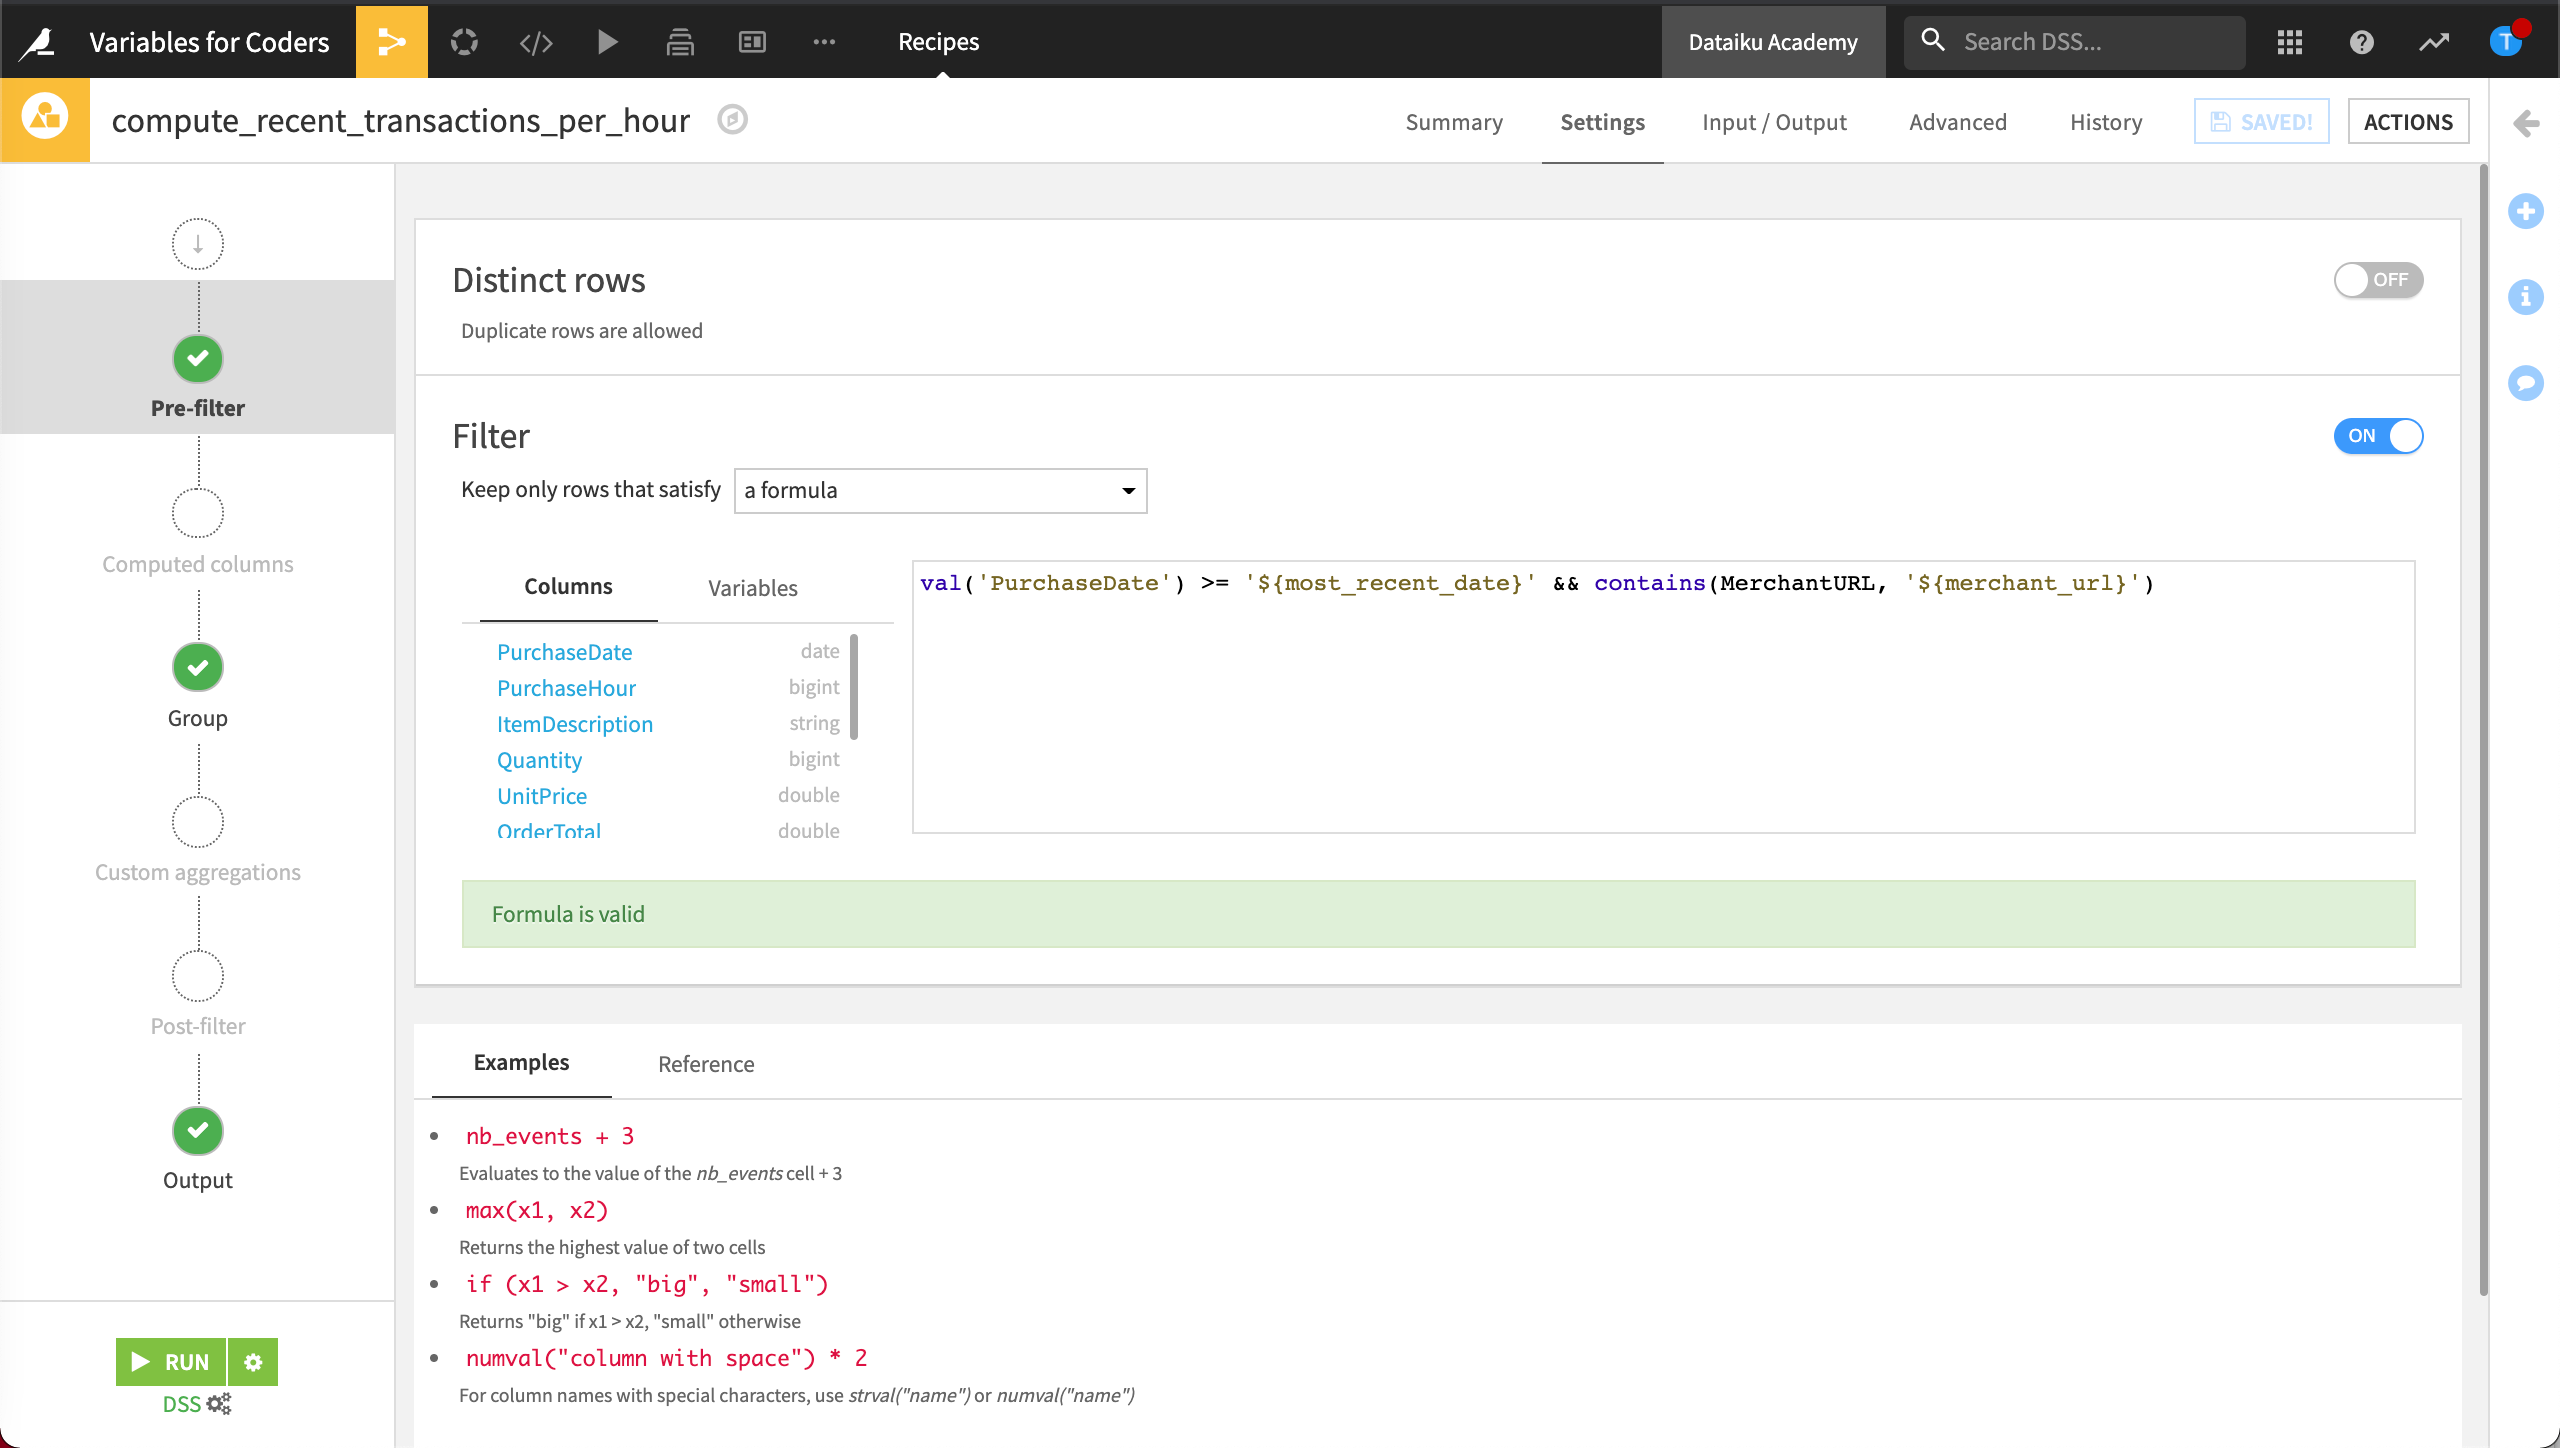
Go to the recipe’s Pre-filter step and turn on the Filter.
Keep only rows that satisfy a formula.
Type the following formula in the formula editor.
val('PurchaseDate') >= '${most_recent_date}' && contains(MerchantURL, '${merchant_url}')
Note
The incorrect syntax will result in an empty output dataset. For more about variables and which syntax to use with different code recipes, visit Custom variables expansion.
Save and Run the recipe.
The output dataset displays all records where the PurchaseDate is greater than or equal to the “most recent date” (as defined in our variables), grouped by purchase hour.
With the MerchantURL set to the value of our merchant URL variable, we could now programmatically update which merchant URL to use when creating this output dataset.
Update Variables Using an Application
We want to allow other team members to run the Flow with the values they want without having to give them project administrator rights. It would also be nice if these users could work simultaneously and independently of each other. Now that our variables are defined and the Flow is modified, we can create a Dataiku application that will take care of these needs.
A Dataiku application provides a way for non-coders on your team to update variables via an interactive interface.
Create a Scenario to Build the Scatter Plot
Our objective is to build an application that allows a team member to select a country such as “United States,” “Spain,” or “Germany,” to create a scatter plot for the selected country, and publish the scatterplot to a dashboard.
Our application will need a scenario it can run. Before we can start building our application, we’ll need to create the scenario.
To do this:
Visit the Jobs menu, then choose Scenarios.
Click + Create Your First Scenario.
Name the scenario
Build Scatter Plotthen click Create.
Let’s add a step to our scenario.
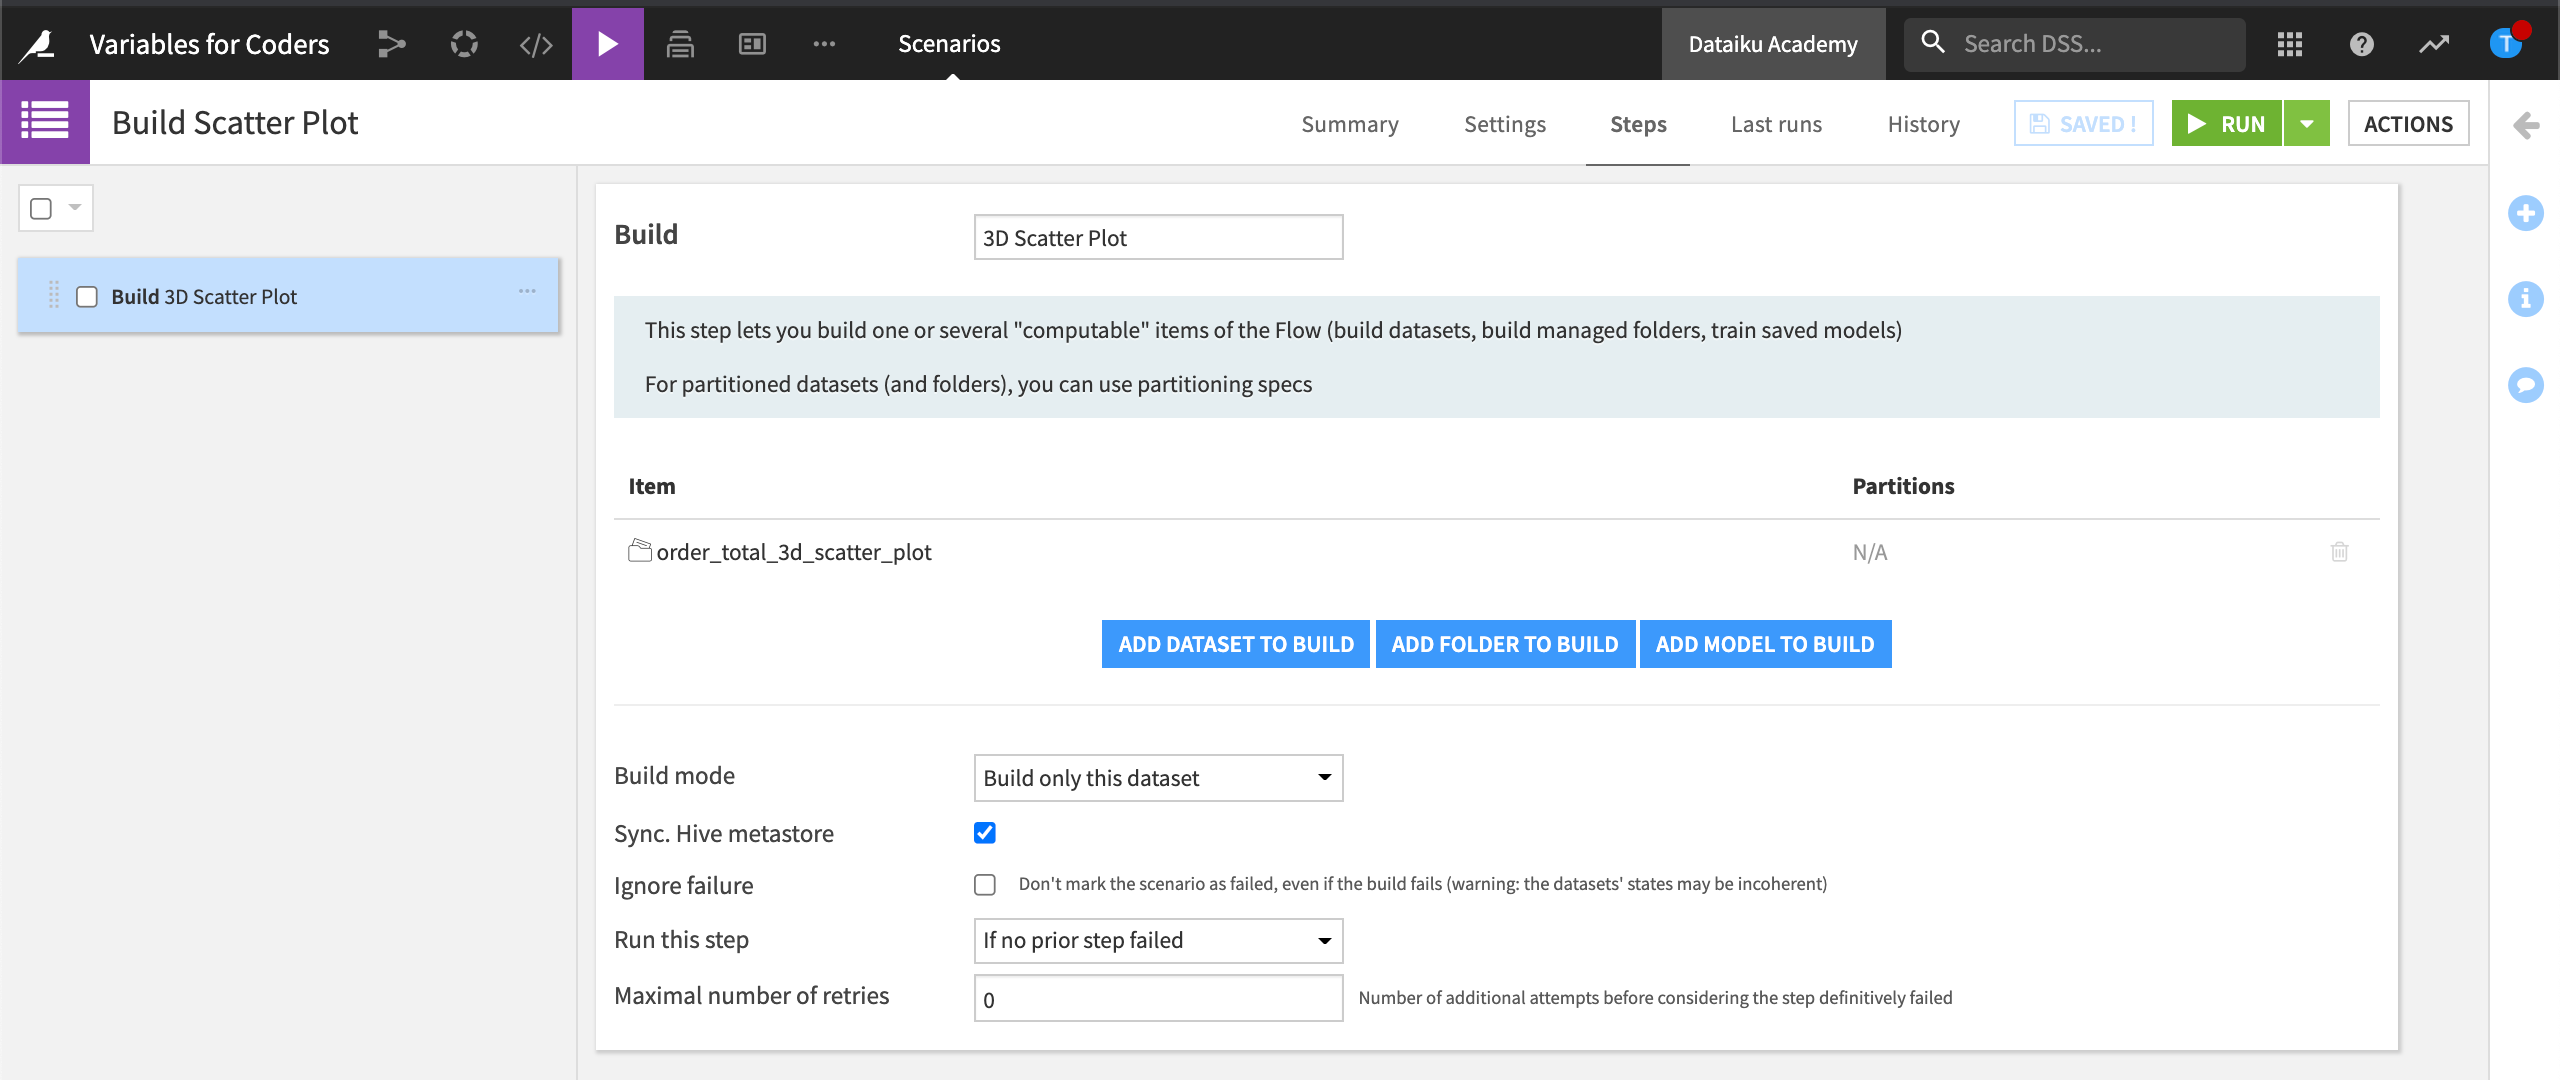
Go to the Steps tab, then click Add Step.
Select Build/Train and name it
3D Scatter Plot.Click Add Folder to Build, select the order_total_3D_scatter_plot folder, then click Add.
Set the Build mode to Build only this dataset.
Save the scenario, then Run it to test it.
Build the Application
Now that we have created the scenario, we can start building our application that will allow a user to choose which country’s data to plot.
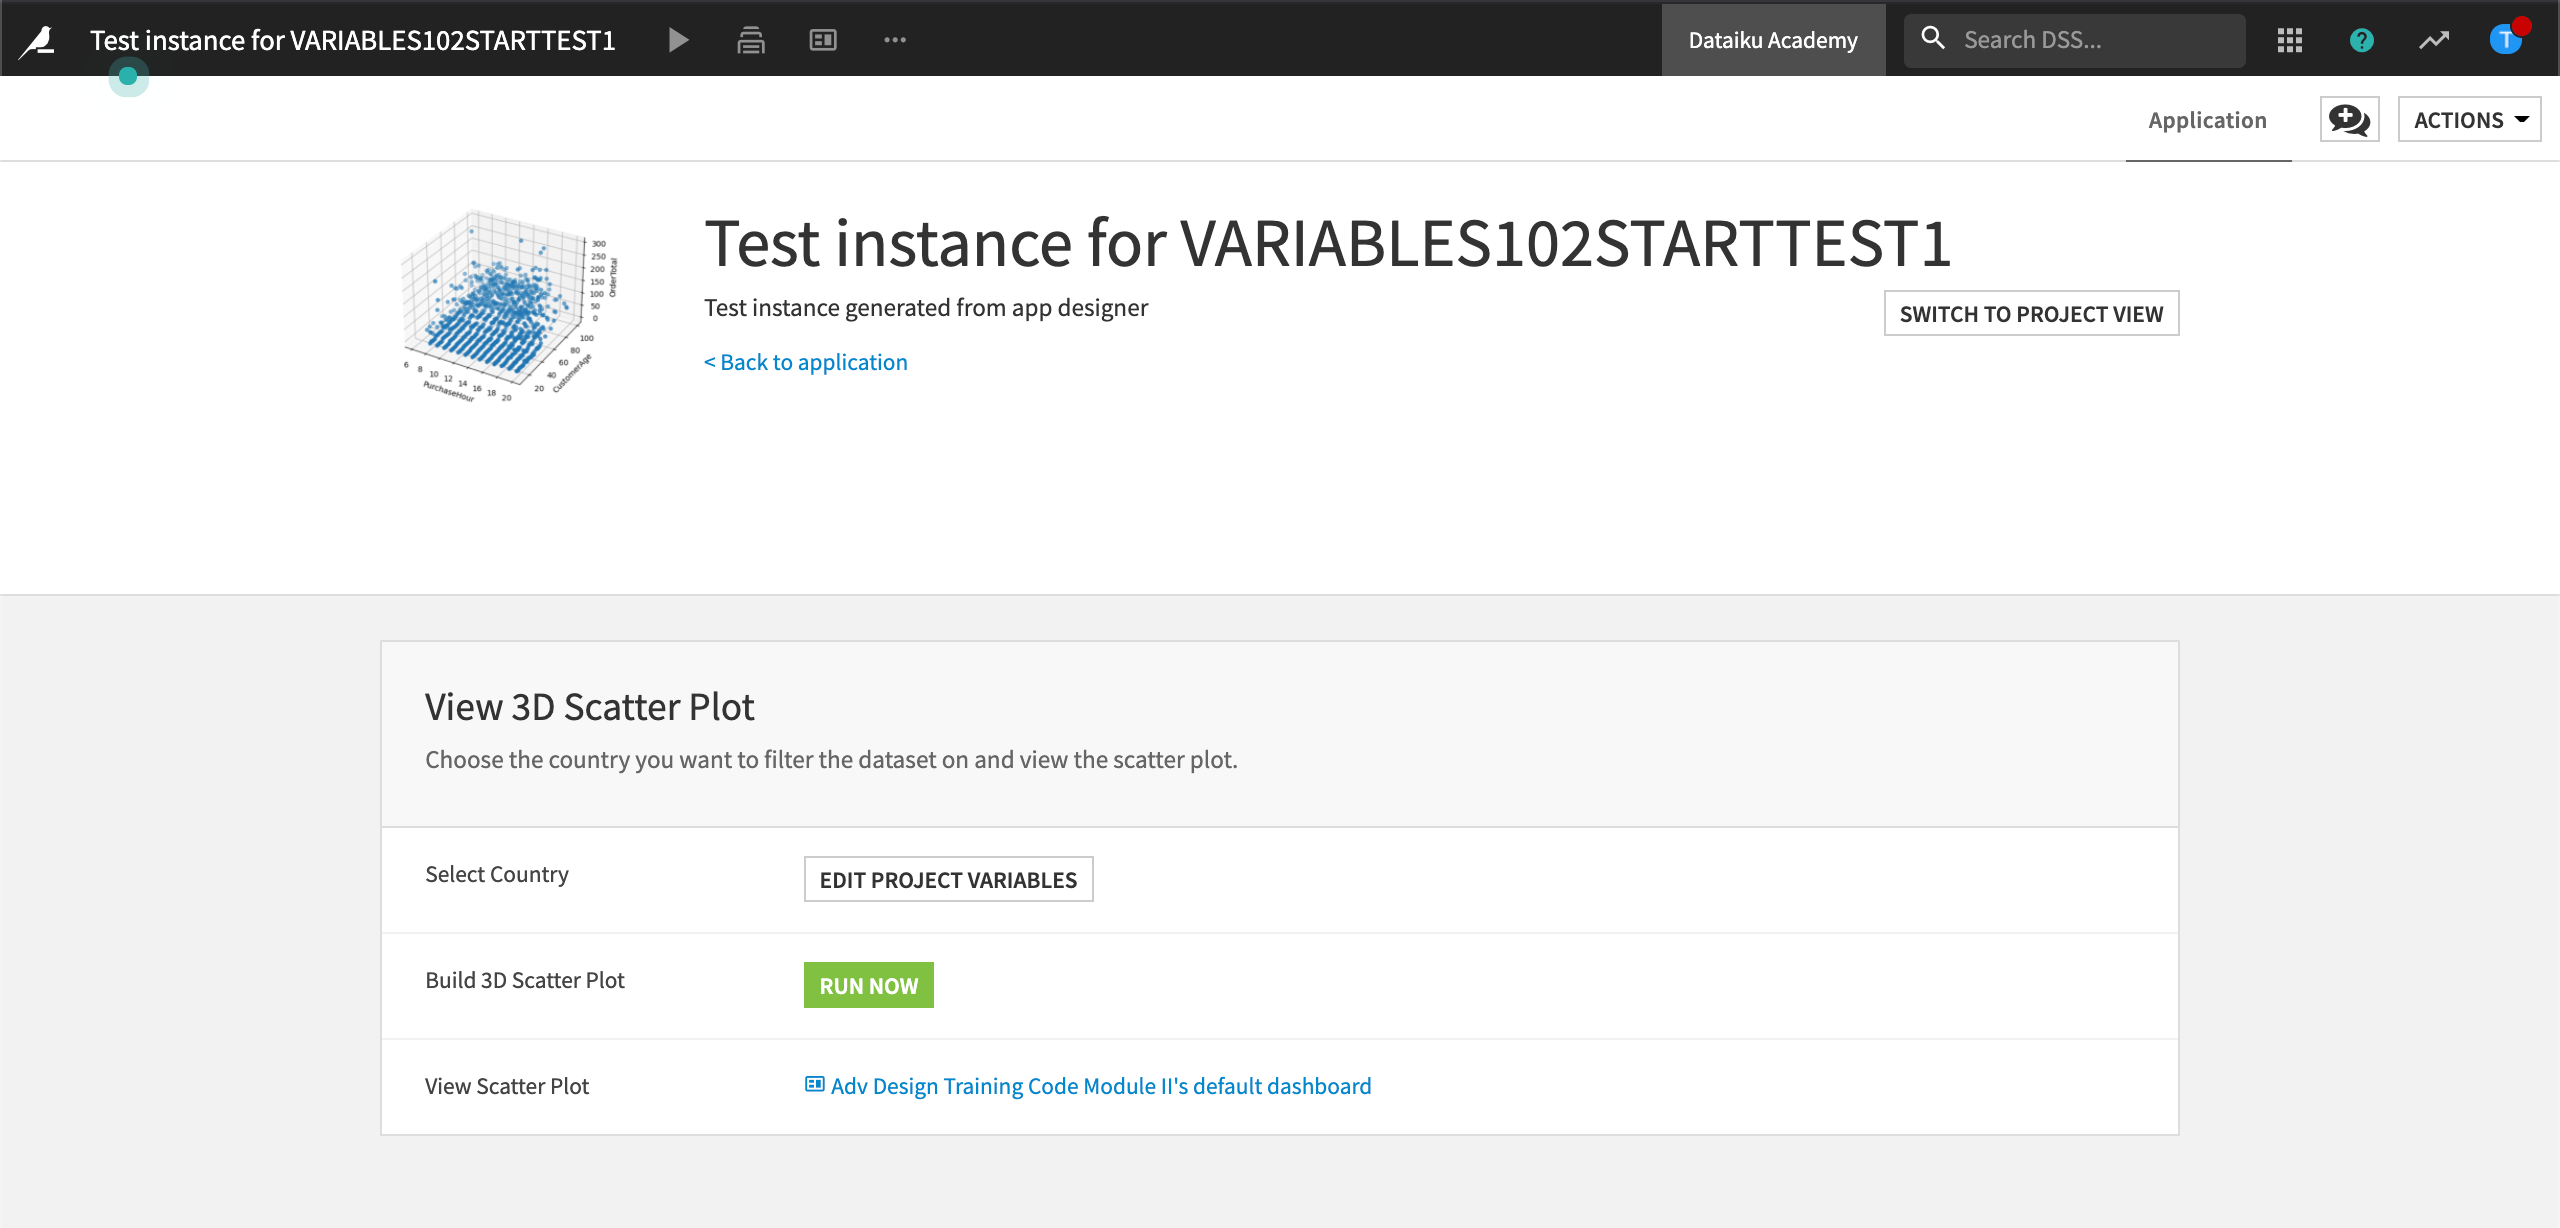
When you’ve completed this tutorial, you application will look similar to this:
To build the application:
Visit the More Options menu, then choose Application designer.
Click Convert into visual application.
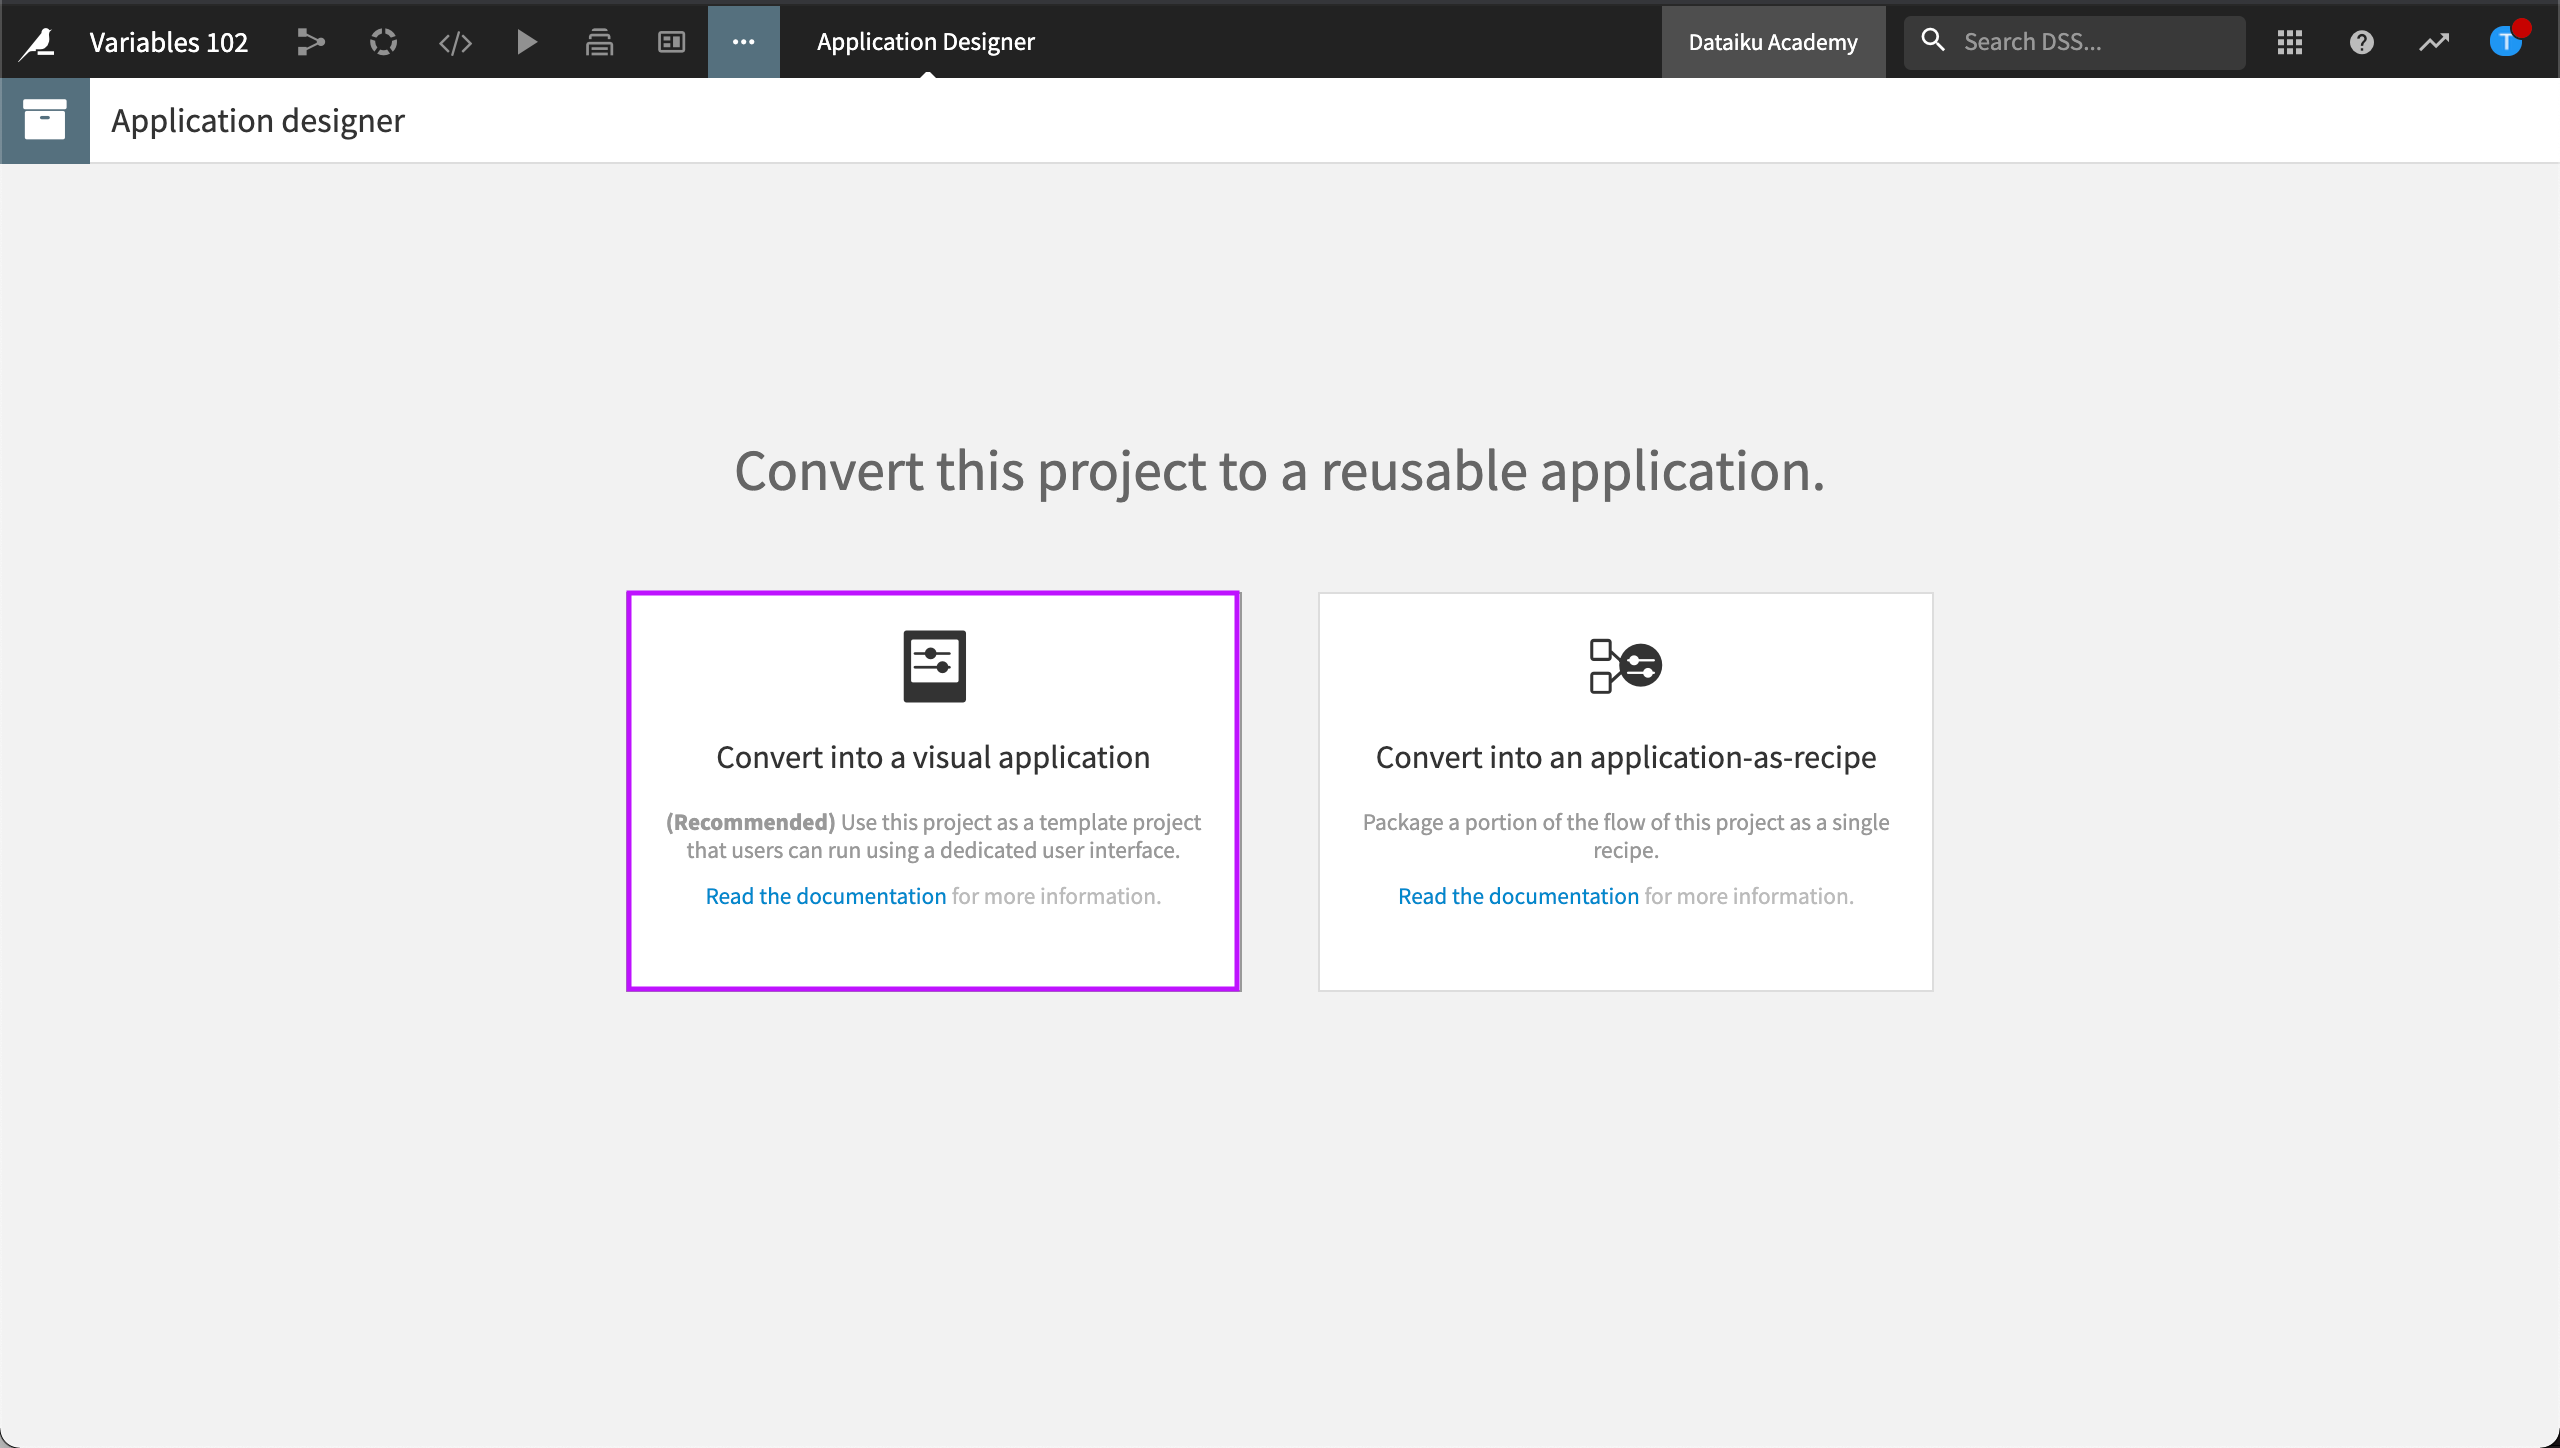
Dataiku DSS displays the Application Designer.
Let’s design our application.
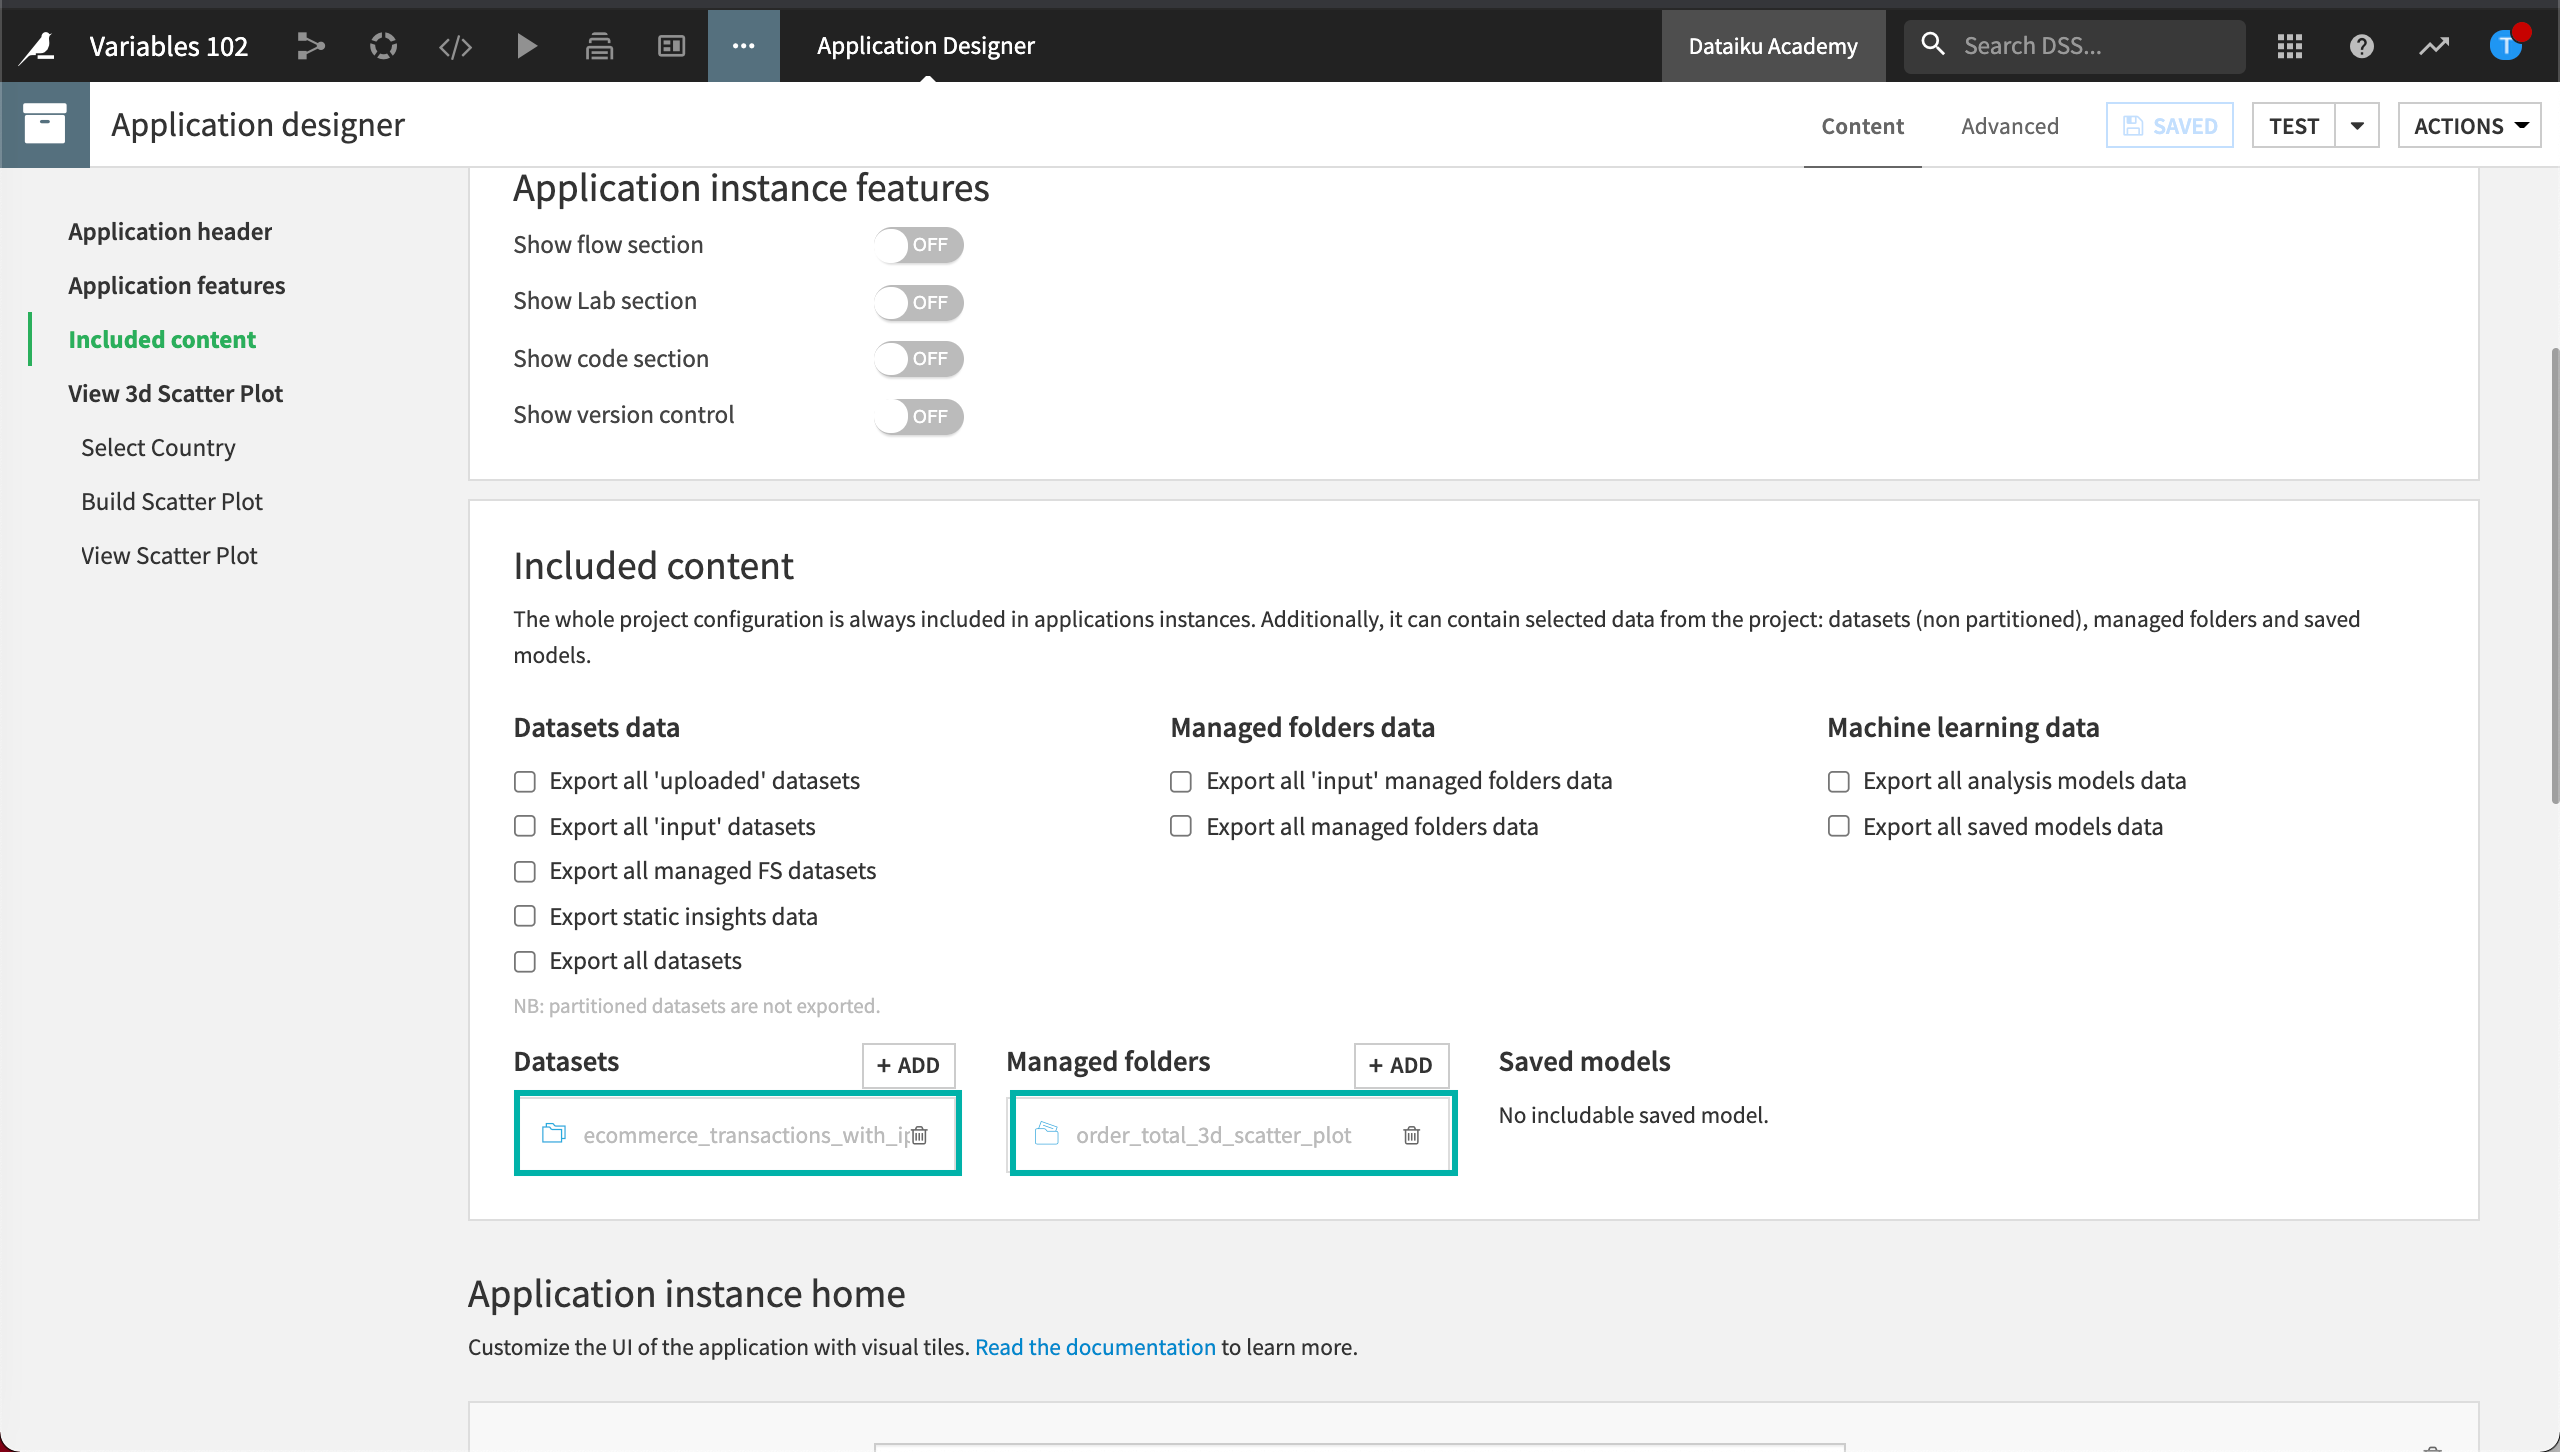
In the Included Content section, click +Add to add a dataset.
Select the dataset, ecommerce_transactions_with_ip_prepared.
Add a Managed folder and select the order_total_3d_scatter_plot folder.
Save your changes.
Now, we’ll need to give the user the ability to edit the variables. To do this:
Click Add Section.
Title the section, “View 3D Scatter Plot”, and give it a description like, “Choose the country you want to filter the dataset on and view the scatter plot”.
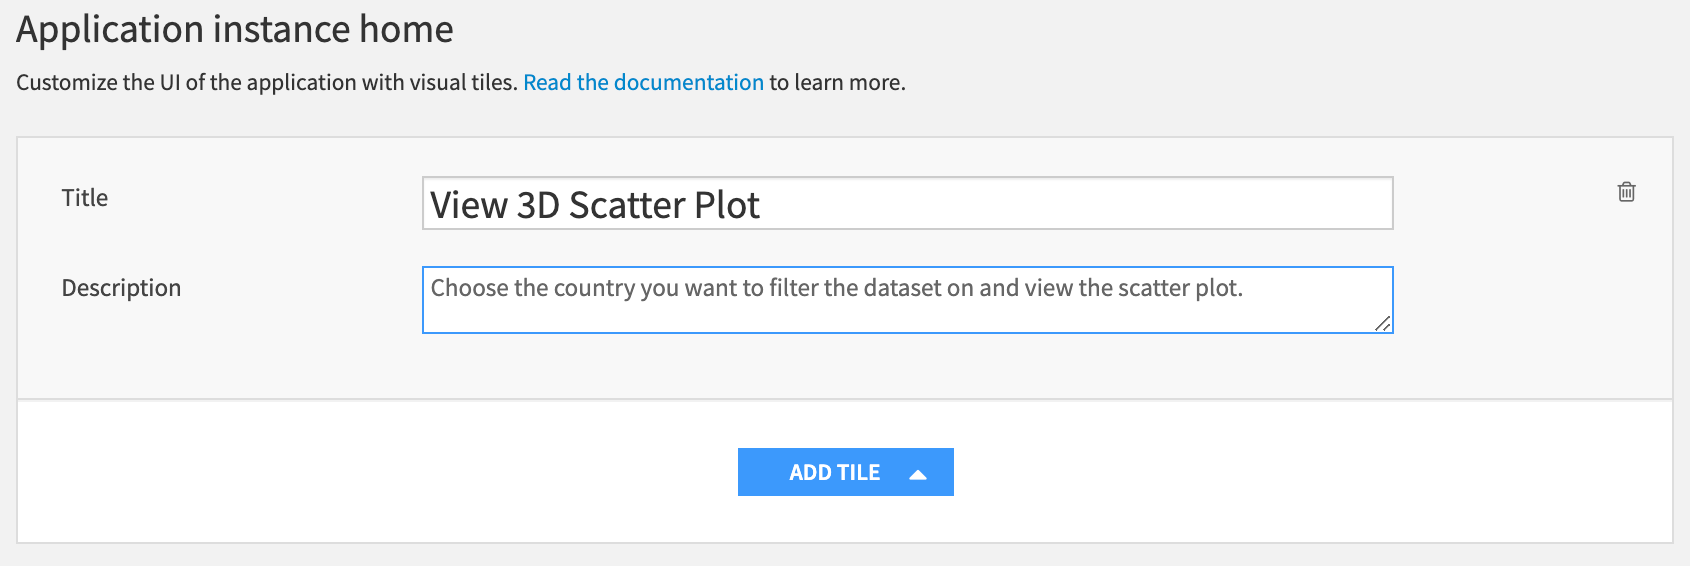
Click ADD TILE, then choose Edit project variables.
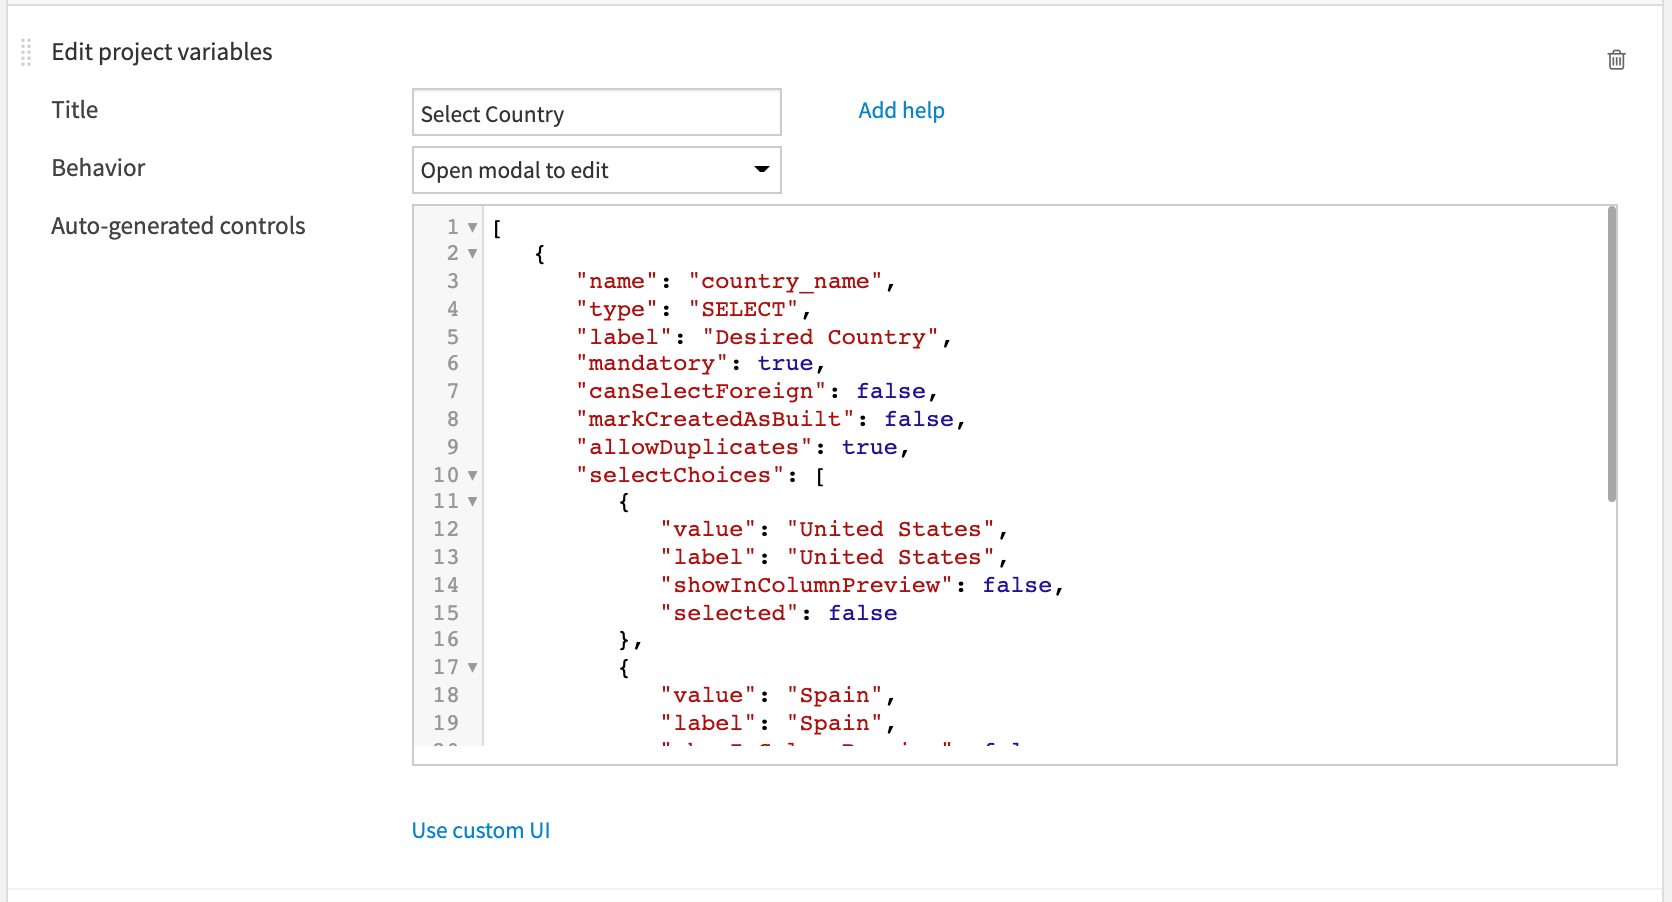
Add the title,
Select Country, and set the behavior to ‘Open modal to edit.’Replace the starter script in the Auto-generated controls with the following:
[
   {
      "name": "country_name",
      "type": "SELECT",
      "label": "Desired Country",
      "mandatory": true,
      "canSelectForeign": false,
      "markCreatedAsBuilt": false,
      "allowDuplicates": true,
      "selectChoices": [
         {
            "value": "United States",
            "label": "United States",
            "showInColumnPreview": false,
            "selected": false
         },
         {
            "value": "Spain",
            "label": "Spain",
            "showInColumnPreview": false,
            "selected": false
         },
         {
            "value": "Germany",
            "label": "Germany",
            "showInColumnPreview": false,
            "selected": false
         }
      ],
      "getChoicesFromPython": false,
      "canCreateDataset": false
   }
]
Save your changes.
Note
This is just one way to allow the user to interact with the application. There are other types of interactions available. Visit Dataiku Applications: Edit Project Variables to find out more.
Next, we need to tell the application to run the existing scenario in order to produce the new scatter plot. To do this:
Click Add Tile.
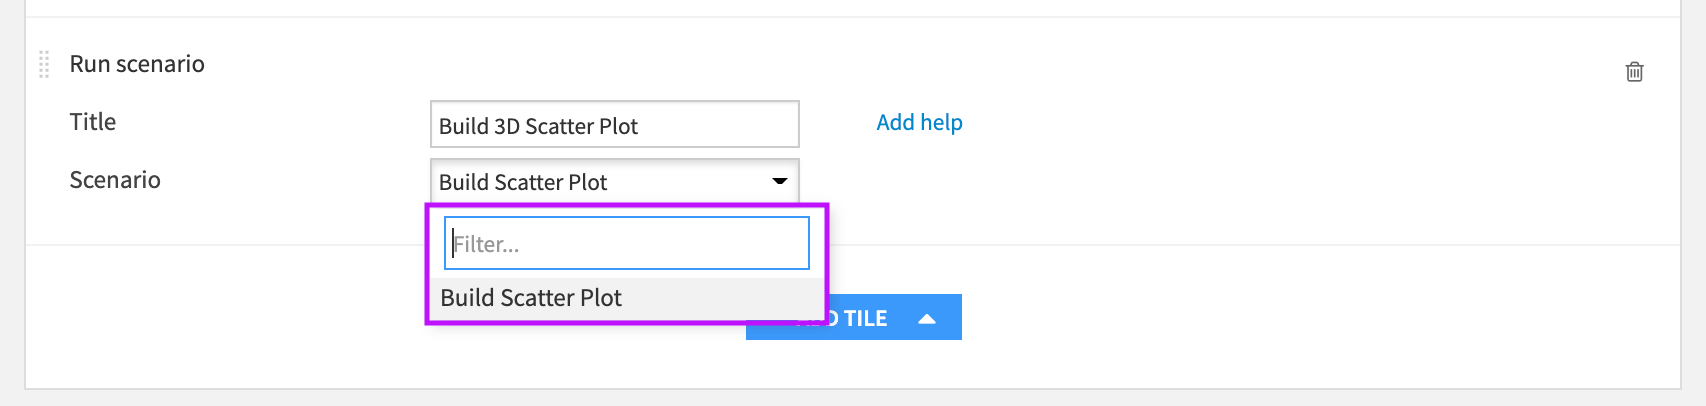
Select Run scenario.
Name it
Build 3D Scatter Plotand choose the scenario “Build Scatter Plot”.
Finally, we’ll add a button that allows the user to view the scatter plot. To do this:
Click Add Tile and select View folder.
Name it
View Scatter Plotand select the order_total_3d_scatter_plot folder.Save the application.
Let’s test our new application.
Click the dropdown arrow next to the Test button in the top right corner of the page.
Select Create or update test instance (full).
Dataiku DSS begins to create the test instance. After a short while, Dataiku displays the test instance. The title of the test instance depends on the title of your project.
To test the app, select a country for which you haven’t yet seen the scatter plot.
Note
If Dataiku DSS displays an error when you try to view the scatter plot in the folder, check your scenario step to ensure the Build mode is set to Build only this dataset. Then, ensure your application includes the required dataset and folder in the Included Content.
What’s Next?
Congratulations! You’ve completed this lesson!
In a short period of time, we were able to refactor a project with hard-coded information using project variables that we could then programmatically update.
Specifically, we learned how to:
Define project-level variables.
Use project variables in a Python recipe.
Create a scenario enabling us to build a Dataiku application where users could choose the value of a variable.
Now you can continue your learning journey, by completing the other courses available in the Developer course series!