Concept: Fit Curves and Distributions
Let’s summarize what we just learned in the concept video. Then, we’ll continue with the hands-on lesson where you can apply your knowledge.
Distribution Fitting
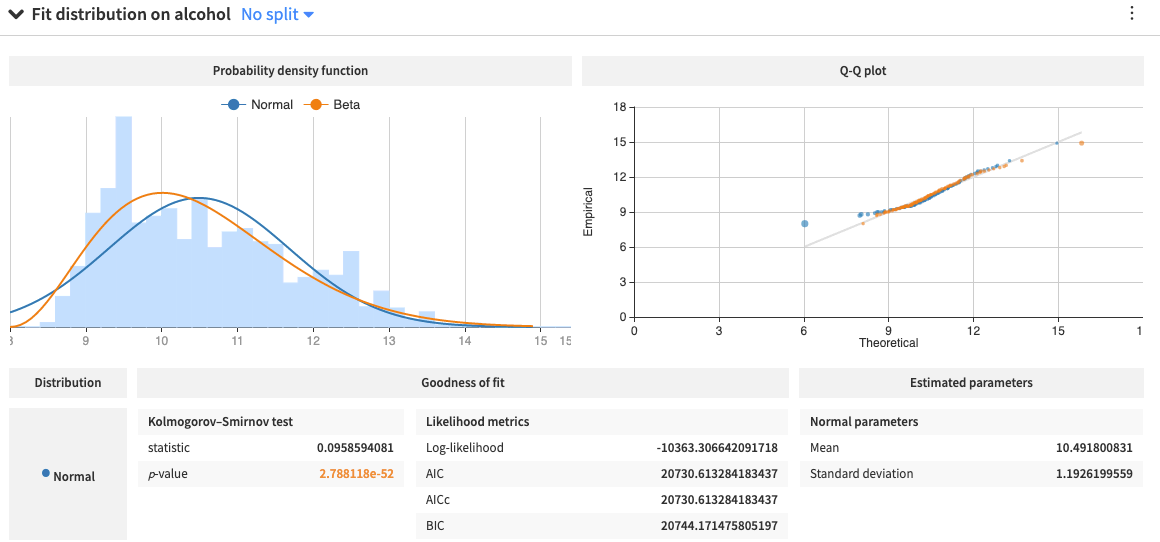
Using the Fit Distribution card in Dataiku DSS, we can fit univariate distributions such as the Gaussian (normal), exponential, beta distributions, and more, to the data in each numerical column of our data.
The card displays goodness-of-fit metrics, the estimated parameters of the distributions, and a Q-Q plot that compares the quantiles of the data to the quantiles of the fitted distributions. Observing points far from the identity line in a Q-Q plot indicates a poor distribution fit.
We can also fit a bivariate normal (or Joint normal) distribution to two variables that are jointly distributed, or we can visualize the 2-dimensional kernel density estimate (or 2D KDE) plot, by using the 2D Fit Distribution card.
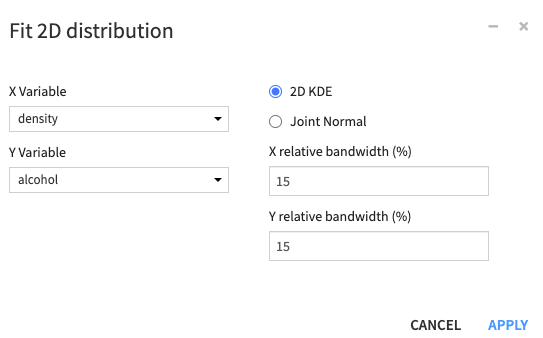
DSS uses a Gaussian kernel for the 2D KDE plot and accepts values for the X and Y relative bandwidth parameters, used to scale the horizontal and vertical KDE bandwidths. The smaller the parameter values, the less smooth the KDE plot appears.
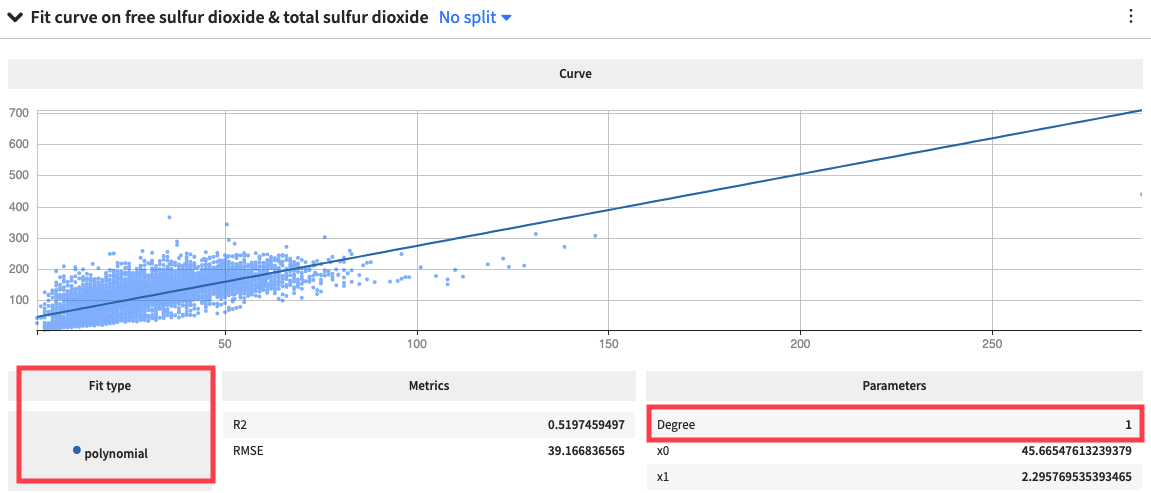
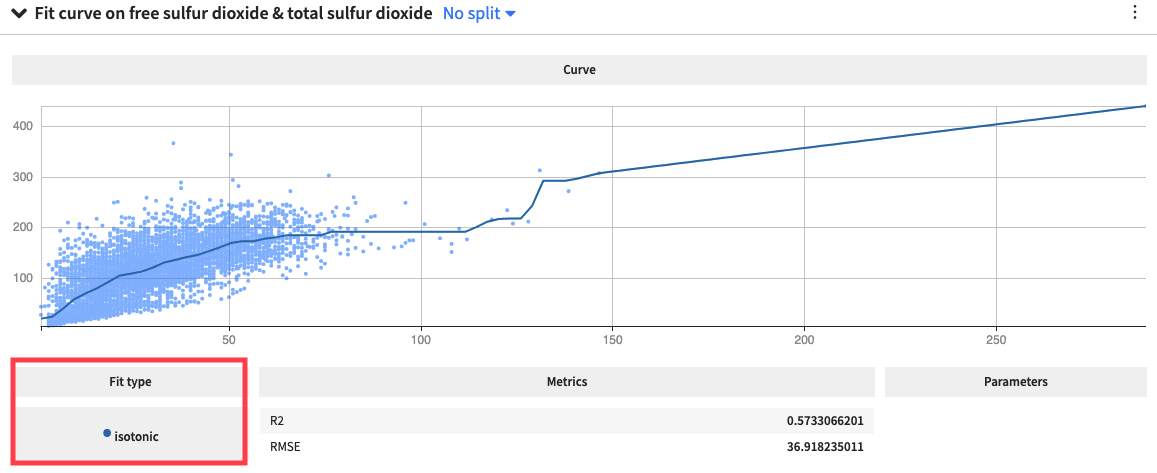
Curve Fitting
Similarly, for the numerical columns, the Fit Curve card allows us to model the relationship between two variables, by using either an Isotonic curve, which uses a free-form linear model to fit the data, and is strictly non-decreasing or non-increasing
or by using a Polynomial curve, which uses a polynomial function of a specified degree.