Concept Summary: Introduction to Machine Learning
Data science teams across industries use algorithms and statistical methods to get insights from the various data sources available to them. Data sources can be structured, such as a spreadsheet, or unstructured, such as an image or a tweet. These data sources might include things like social comments and shares, weather data, or economic data such as the job or housing market.
One example of how machine learning is used includes the social media industry relying on machine learning to classify sentiment, like tweets, into positive or negative categories, to help understand customers. Another example is the automobile industry where machine learning enables predictive maintenance, making manufacturing more efficient and less costly.
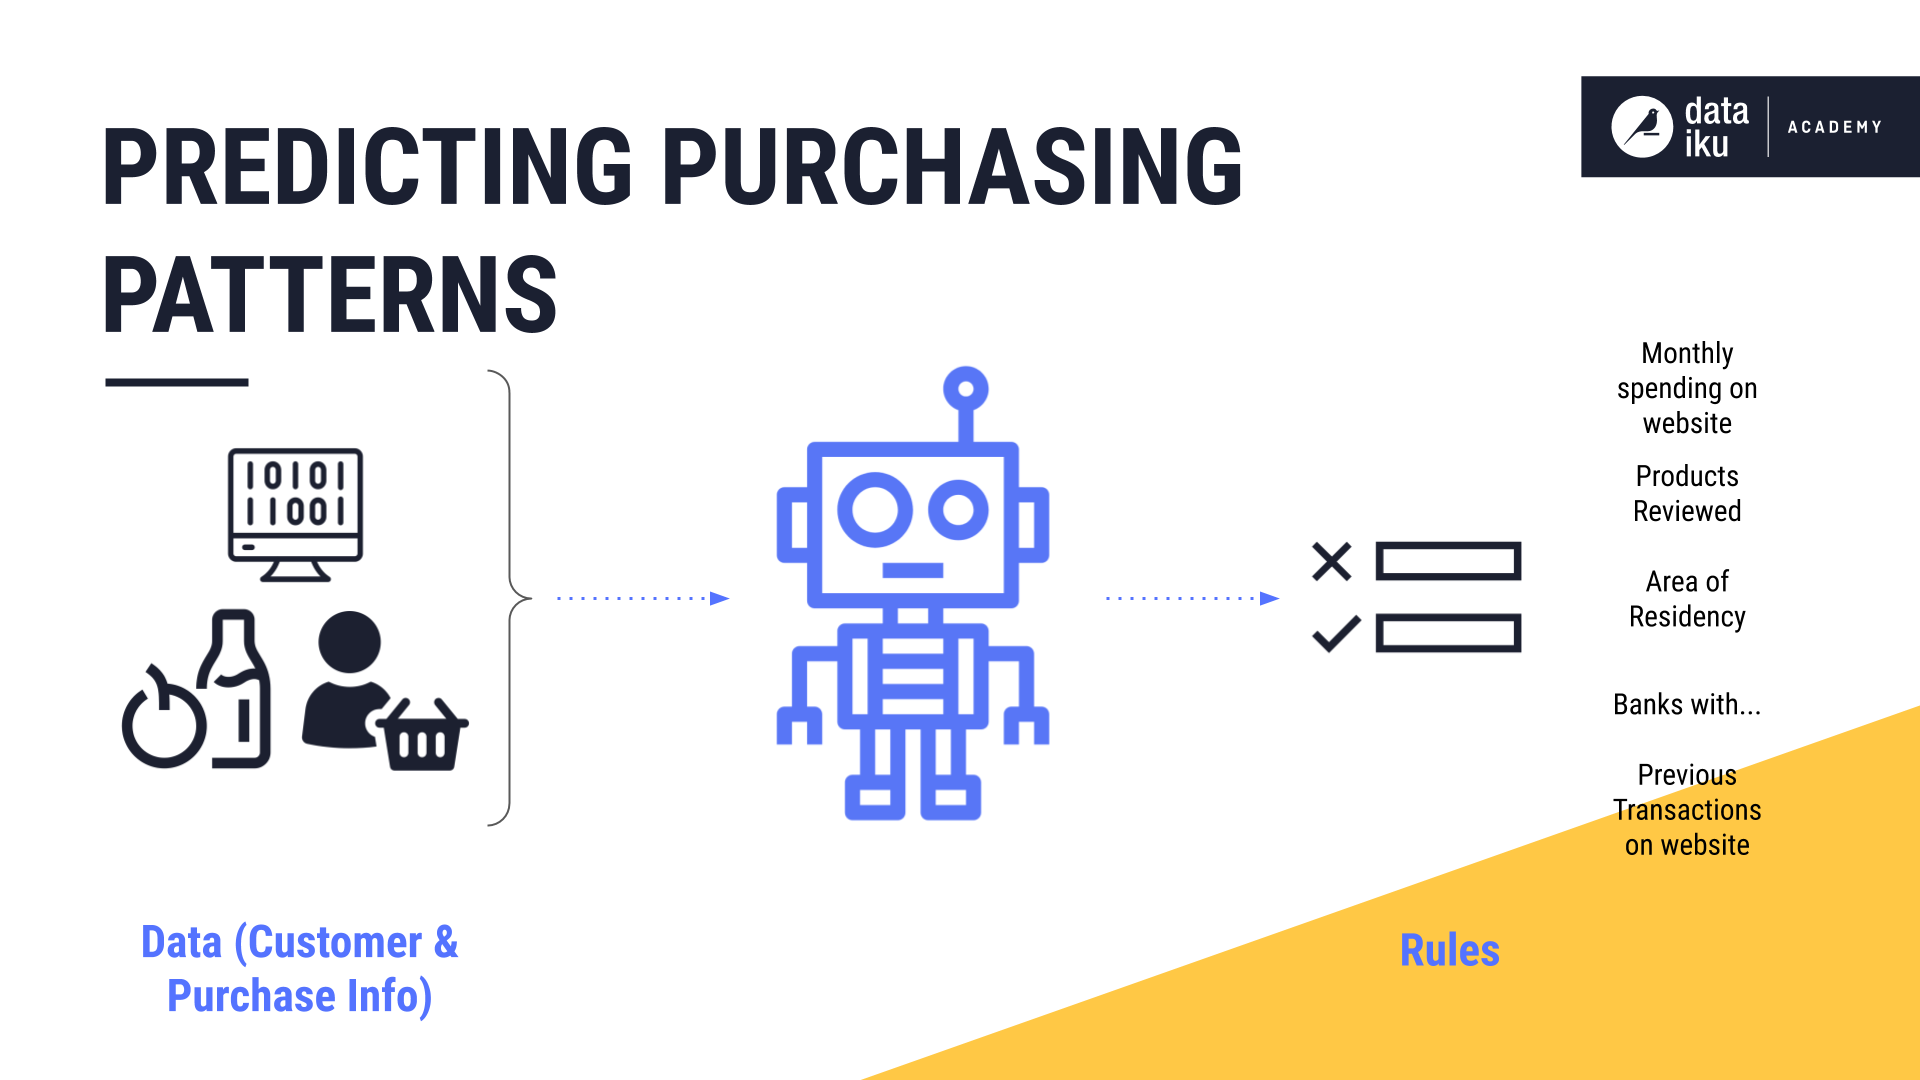
To solve these problems, data science teams teach machines to learn rules. One example of such rules is predicting purchase patterns, where a machine learns the specific purchases that indicate a customer belongs to a particular customer segment which might be more interested in product A rather than product B.
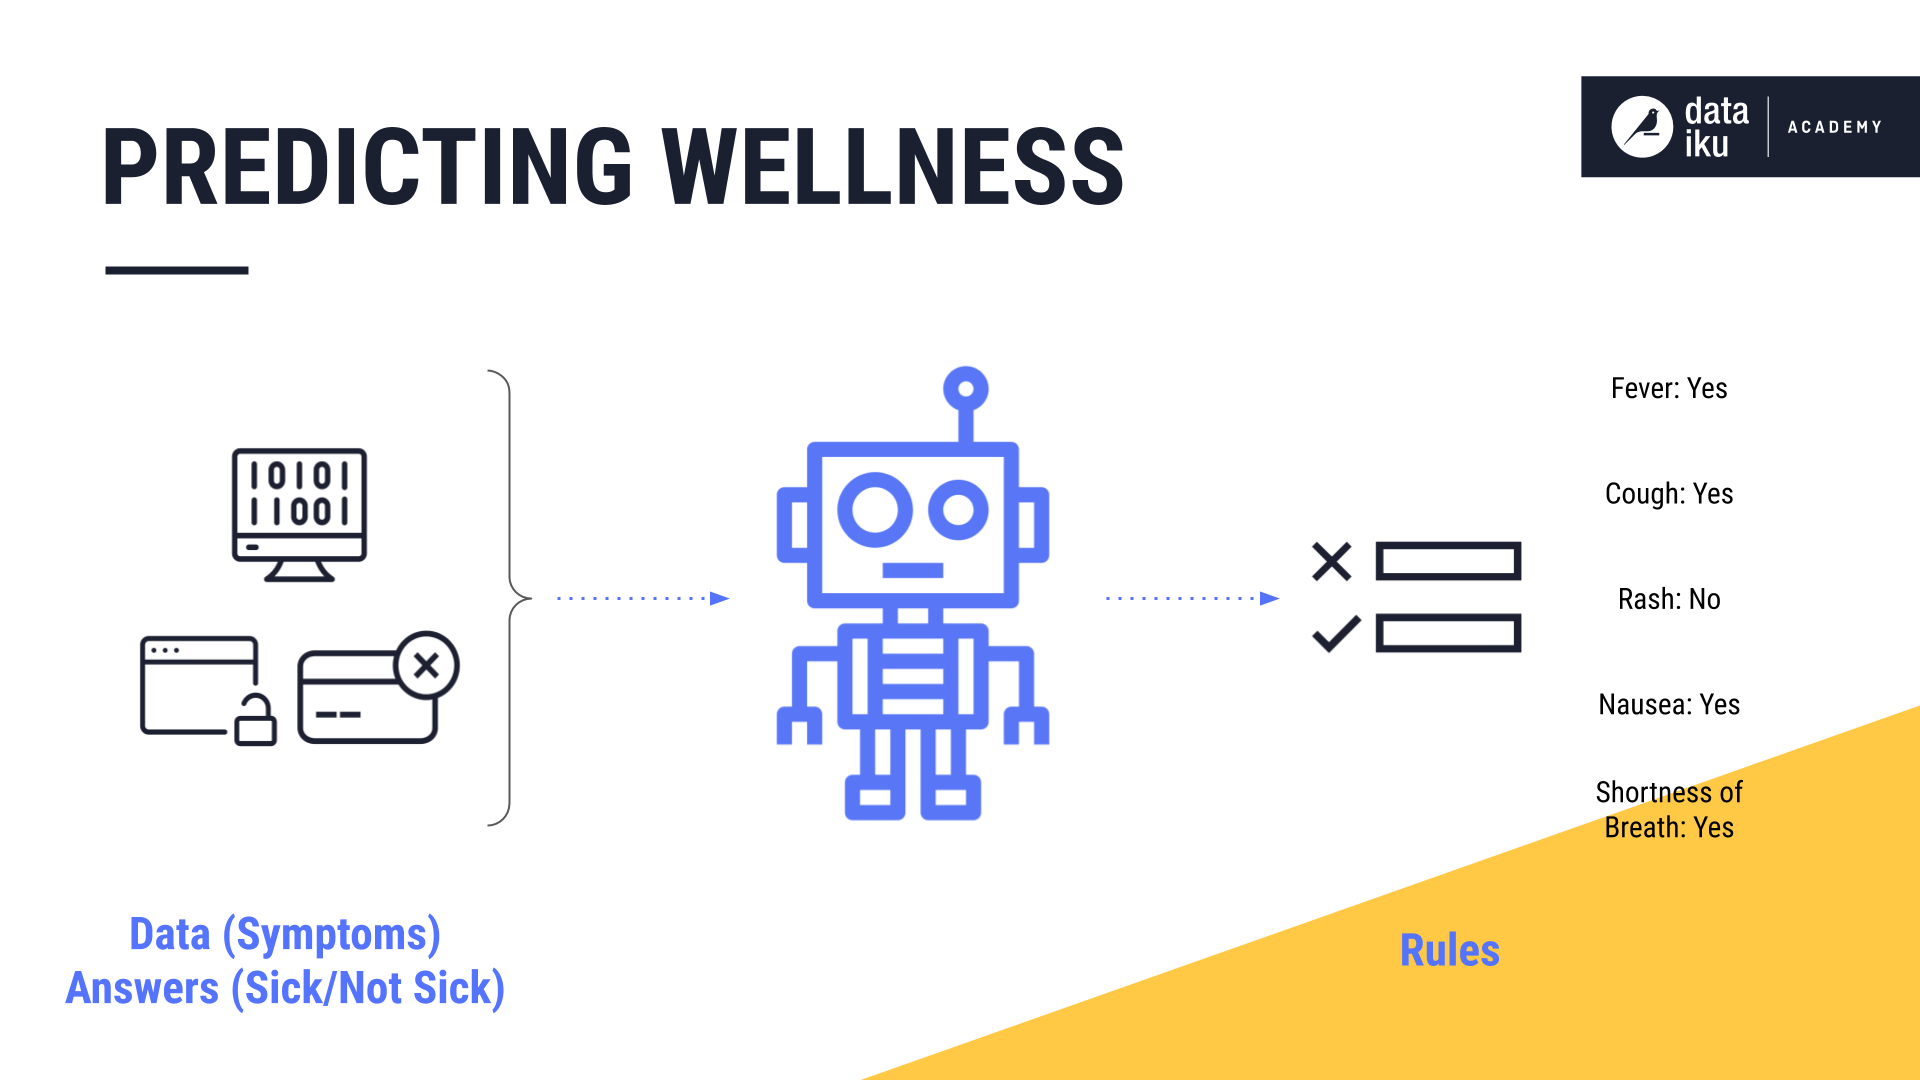
Another example is predicting wellness, where a machine learns the specific symptoms that indicate whether a person is likely sick or not sick.
To learn these patterns and rules, most machine learning techniques fall into one of two categories: supervised and unsupervised learning.
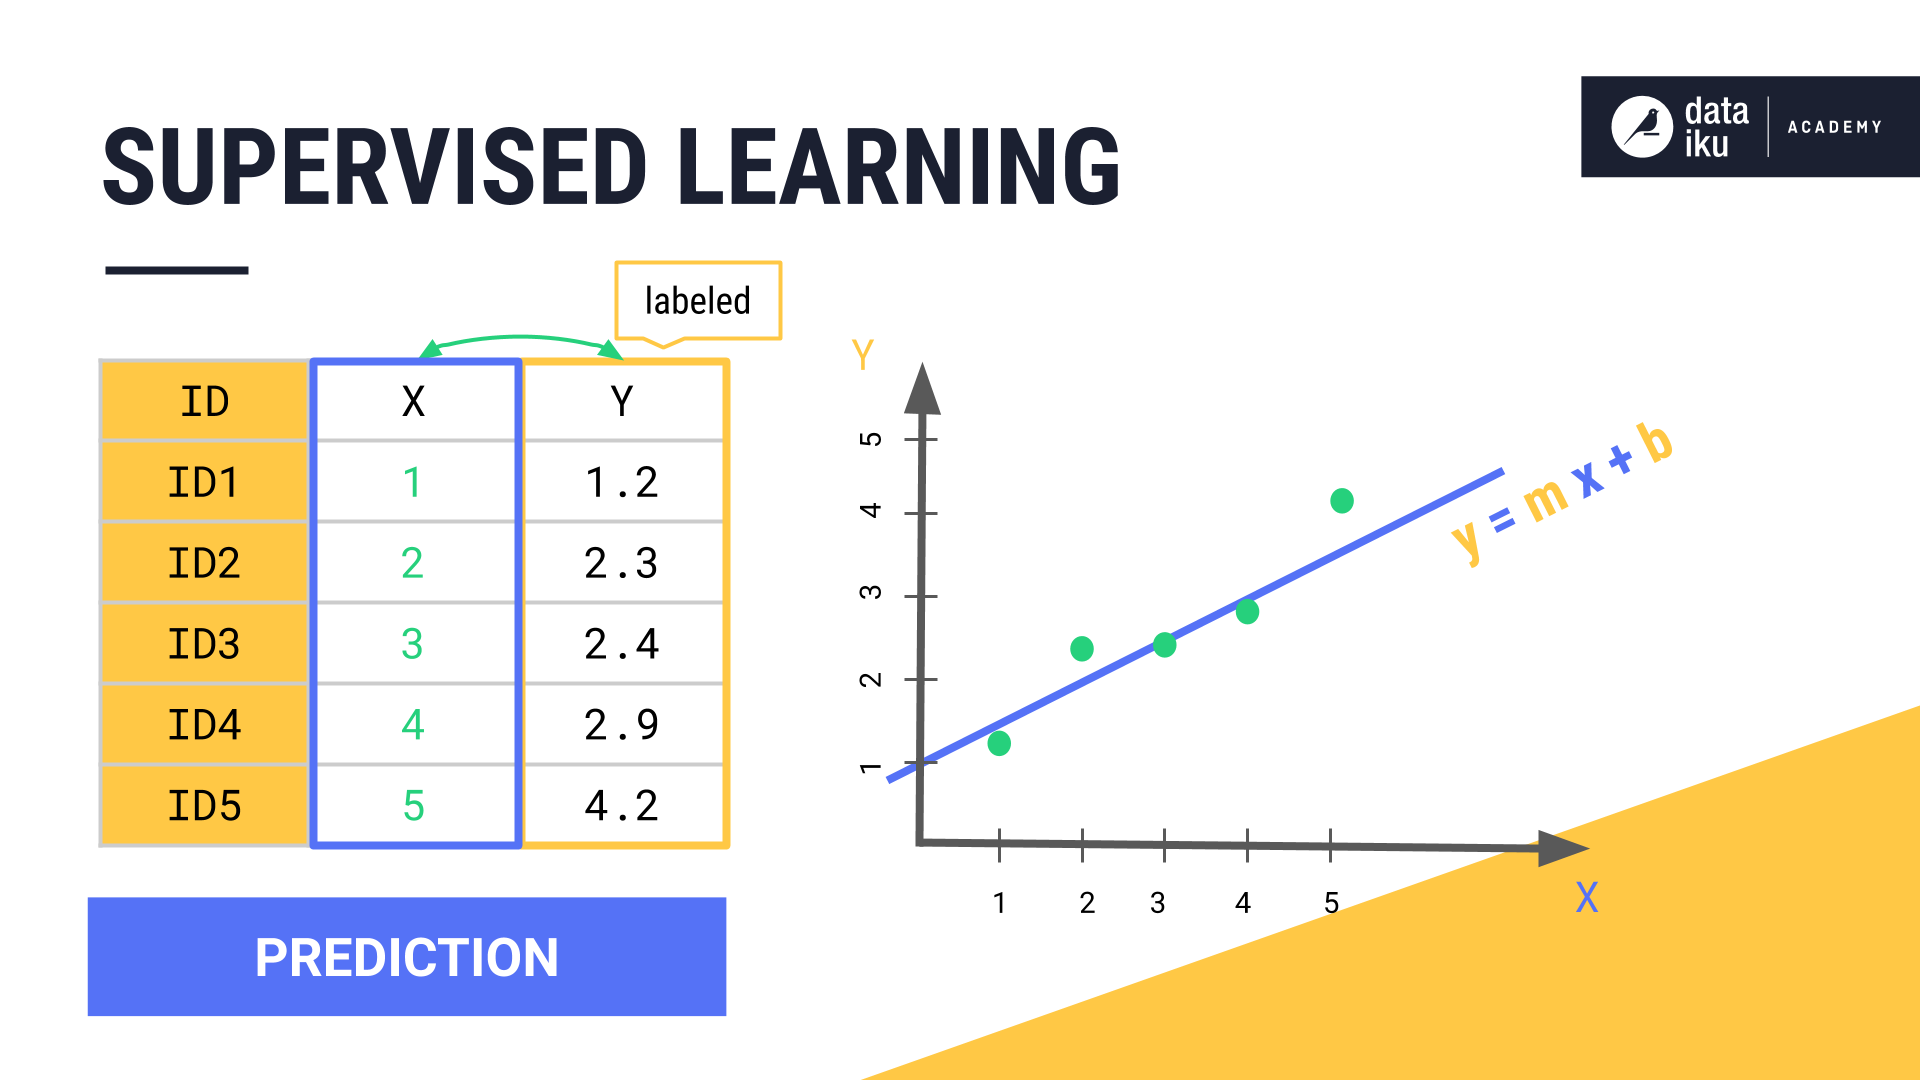
Supervised learning applies when each input has a corresponding output, and we want to find a mapping between the inputs and outputs in the data. This kind of data is also known as labeled data. The algorithm will then use the labeled data to create a mapping of input features to the known outputs. This mapping can then be applied to unlabeled inputs to predict outputs, also known as predictions. Throughout this course, we’ll refer to supervised learning as prediction.
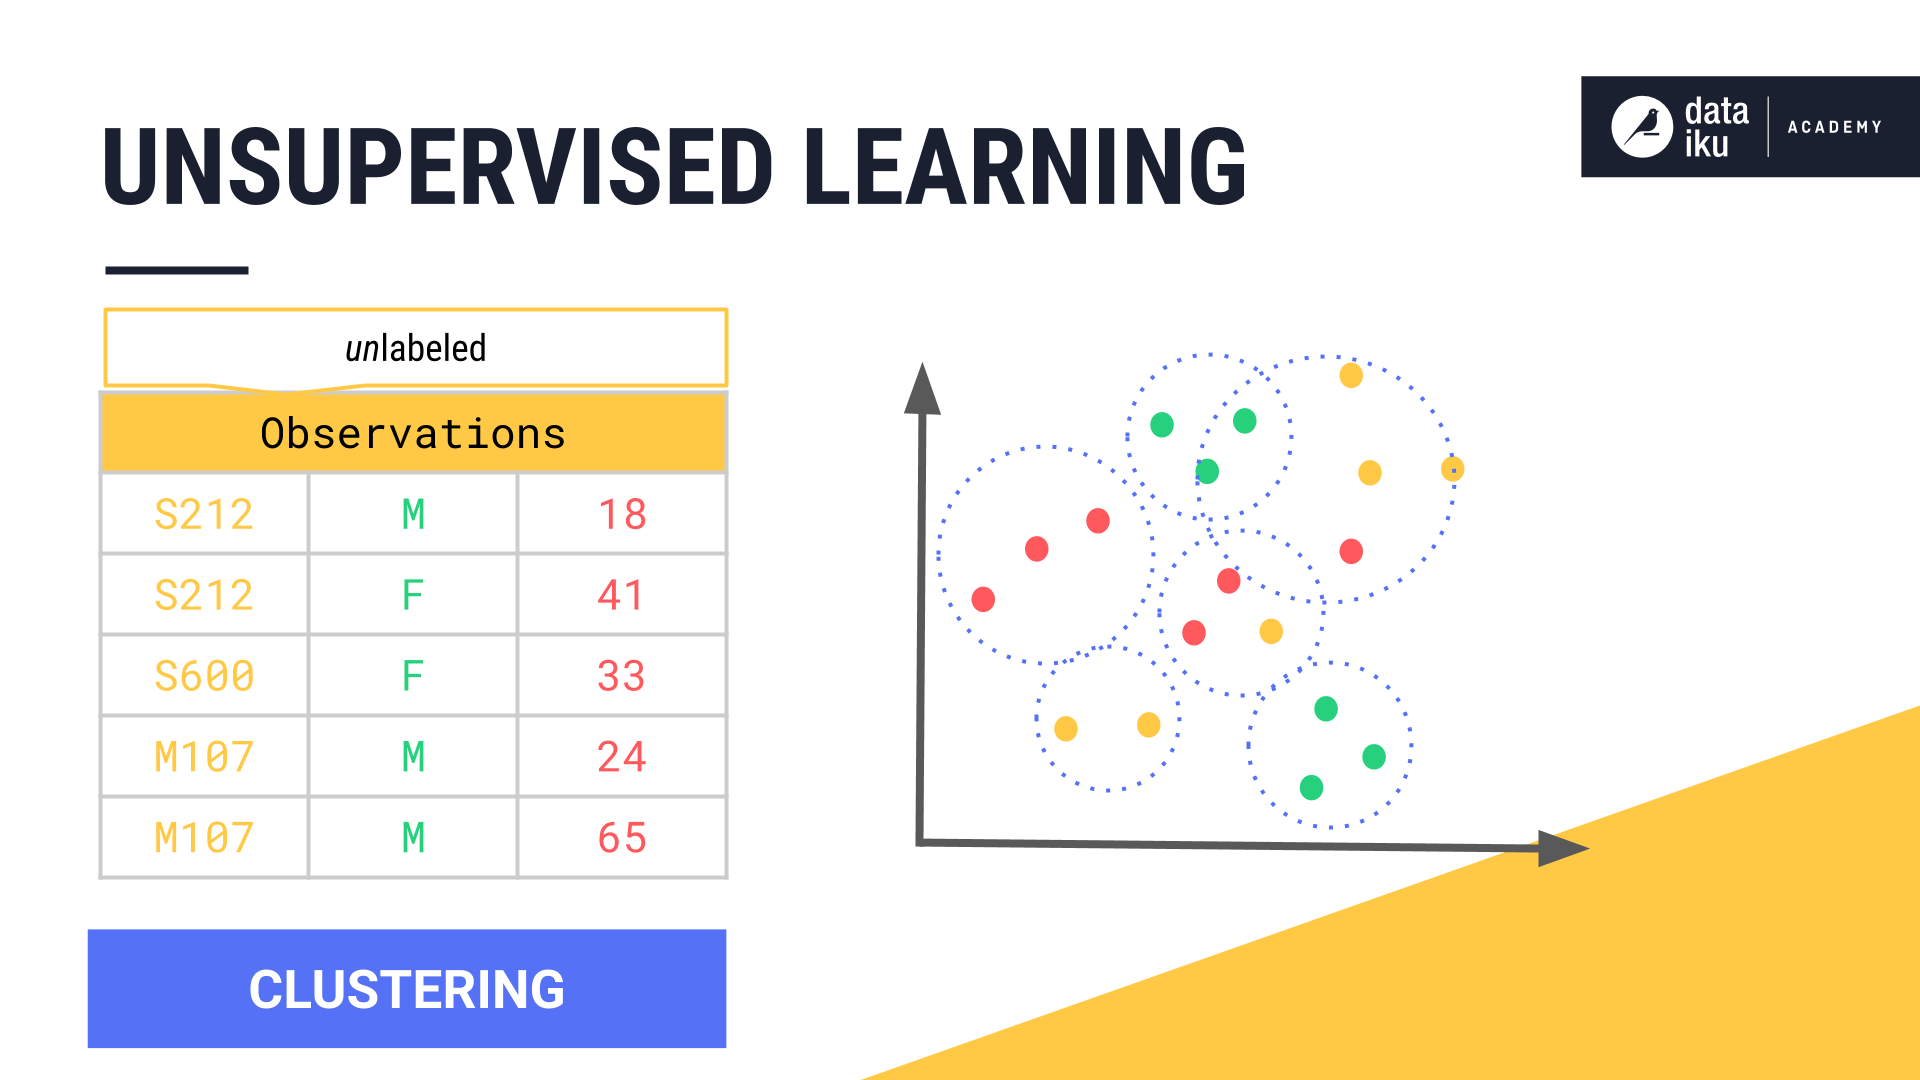
Unsupervised learning applies when the input data is unlabelled. In other words, there is no known correct output, or label, associated with each observation used to train the model. The goal of unsupervised learning is to identify patterns, similarities, densities, and structure in the data. While there are a handful of unsupervised learning techniques including dimensionality reduction, we will focus on clustering, which is far and away the most common technique of unsupervised learning.
Note
New, unseen, data fed to the trained model, as part of a production workflow, is typically unlabeled. We apply our model to this unlabelled data in order to get predictions or identify patterns.
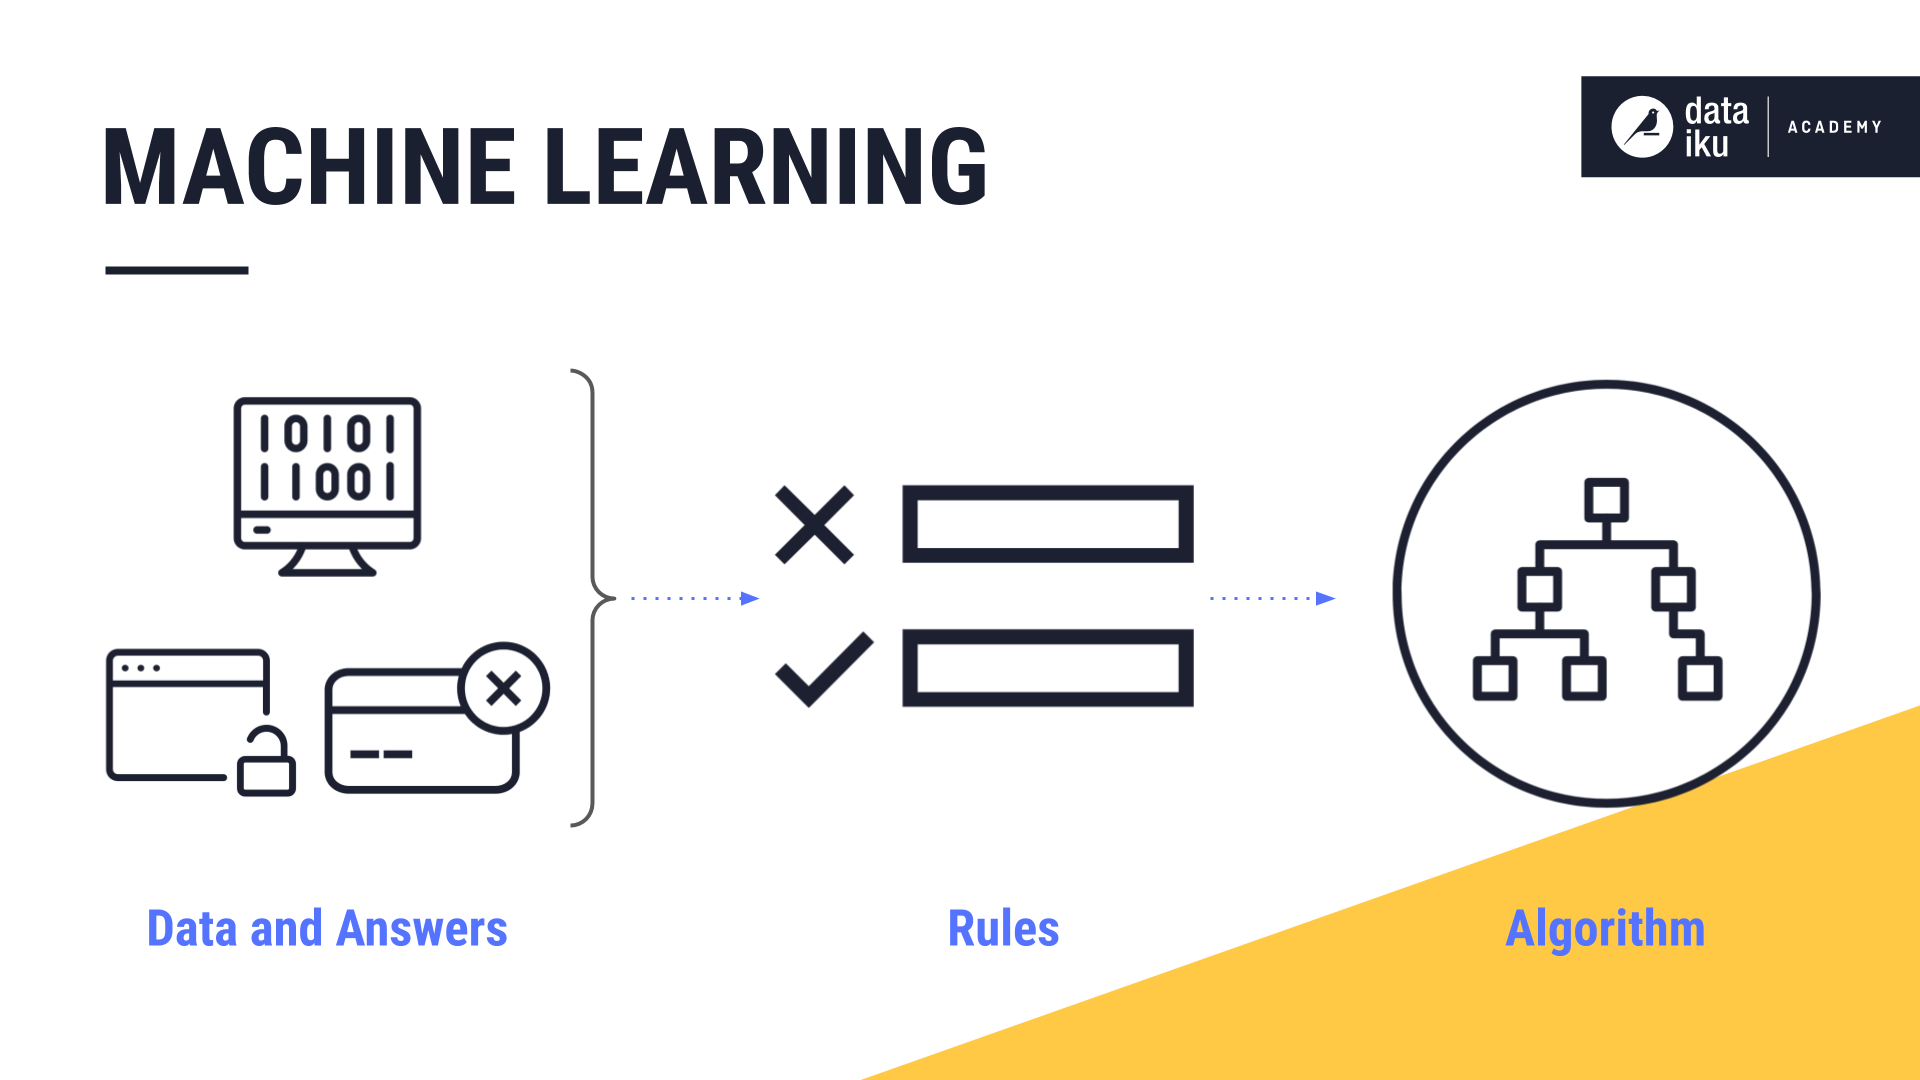
A machine learns when we provide data, such as past experiences and answers, as inputs. It can then look at patterns in the data in order to learn rules. These rules form the basis of algorithms.
Algorithms are the core of a machine learning model and are made up of sets of rules that a computer can follow. The basic idea behind an algorithm is to give it enough information so that it learns without being explicitly programmed, and improves its learning, over time, in an automated way. It learns from patterns, historical records, and events, the way humans do.
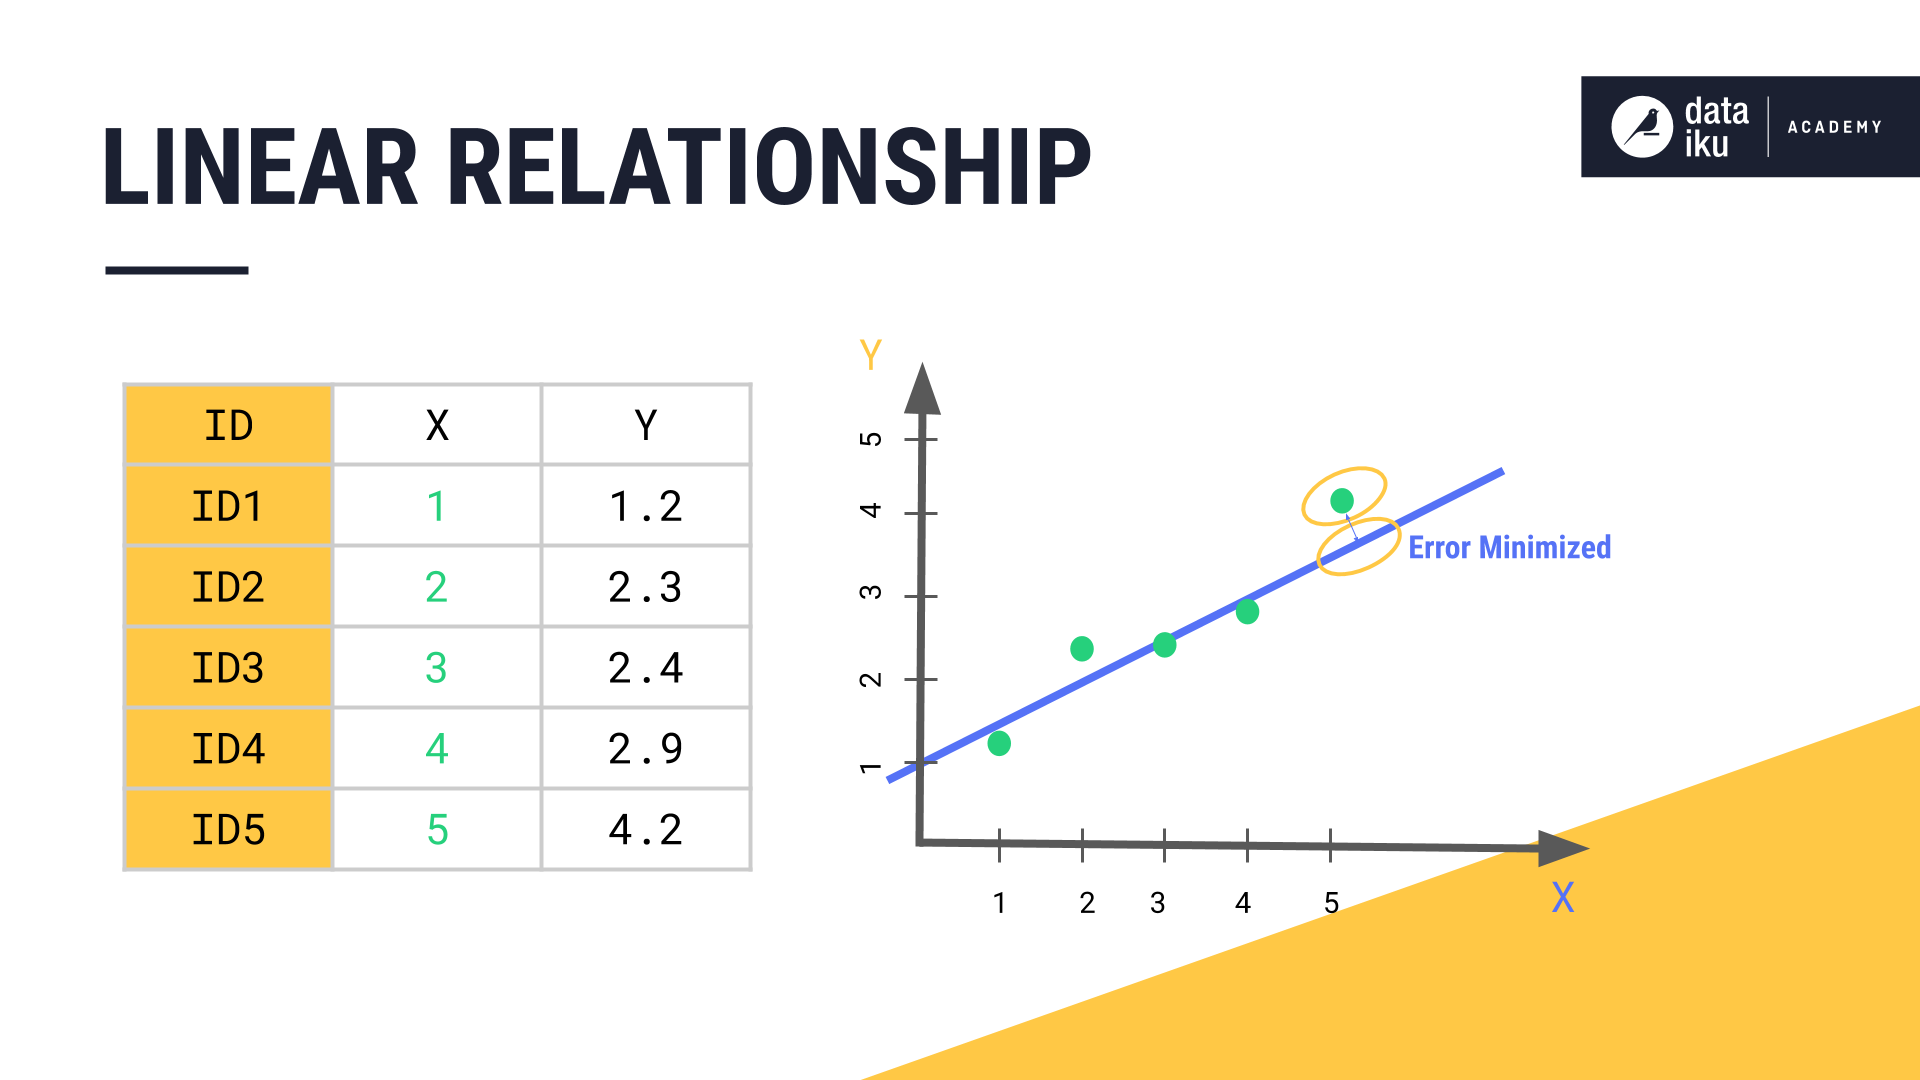
A common type of machine learning task is prediction, where we want to know an outcome, y, given an input, x. A prediction task works by taking a sufficient number of inputs, x, and a sufficient number of known outcomes, y, and mapping them. The goal is to find a relationship between x and y that will allow a machine learning model to determine the values of y from the values of x.
This relationship between x and y can be linear or non-linear. The graph of a linear relationship is a straight line, because the changes in y are constant for each change in x. The graph of a non-linear relationship is curved, because the changes in y are not constant for each change in x. In our simple linear regression example, for every change in the number of study hours, there is a constant change in the outcome or score. However, if we used the exam time itself as the predictor of the exam outcome, the graph would not be linear, it would be a curve that peaks and then drops as time increases due to factors such as test fatigue.
In the case of a linear relationship, the algorithm ends up determining the location of a straight line through the plotted points, such that the distance between the plotted points and the line, also known as the error, is minimized.
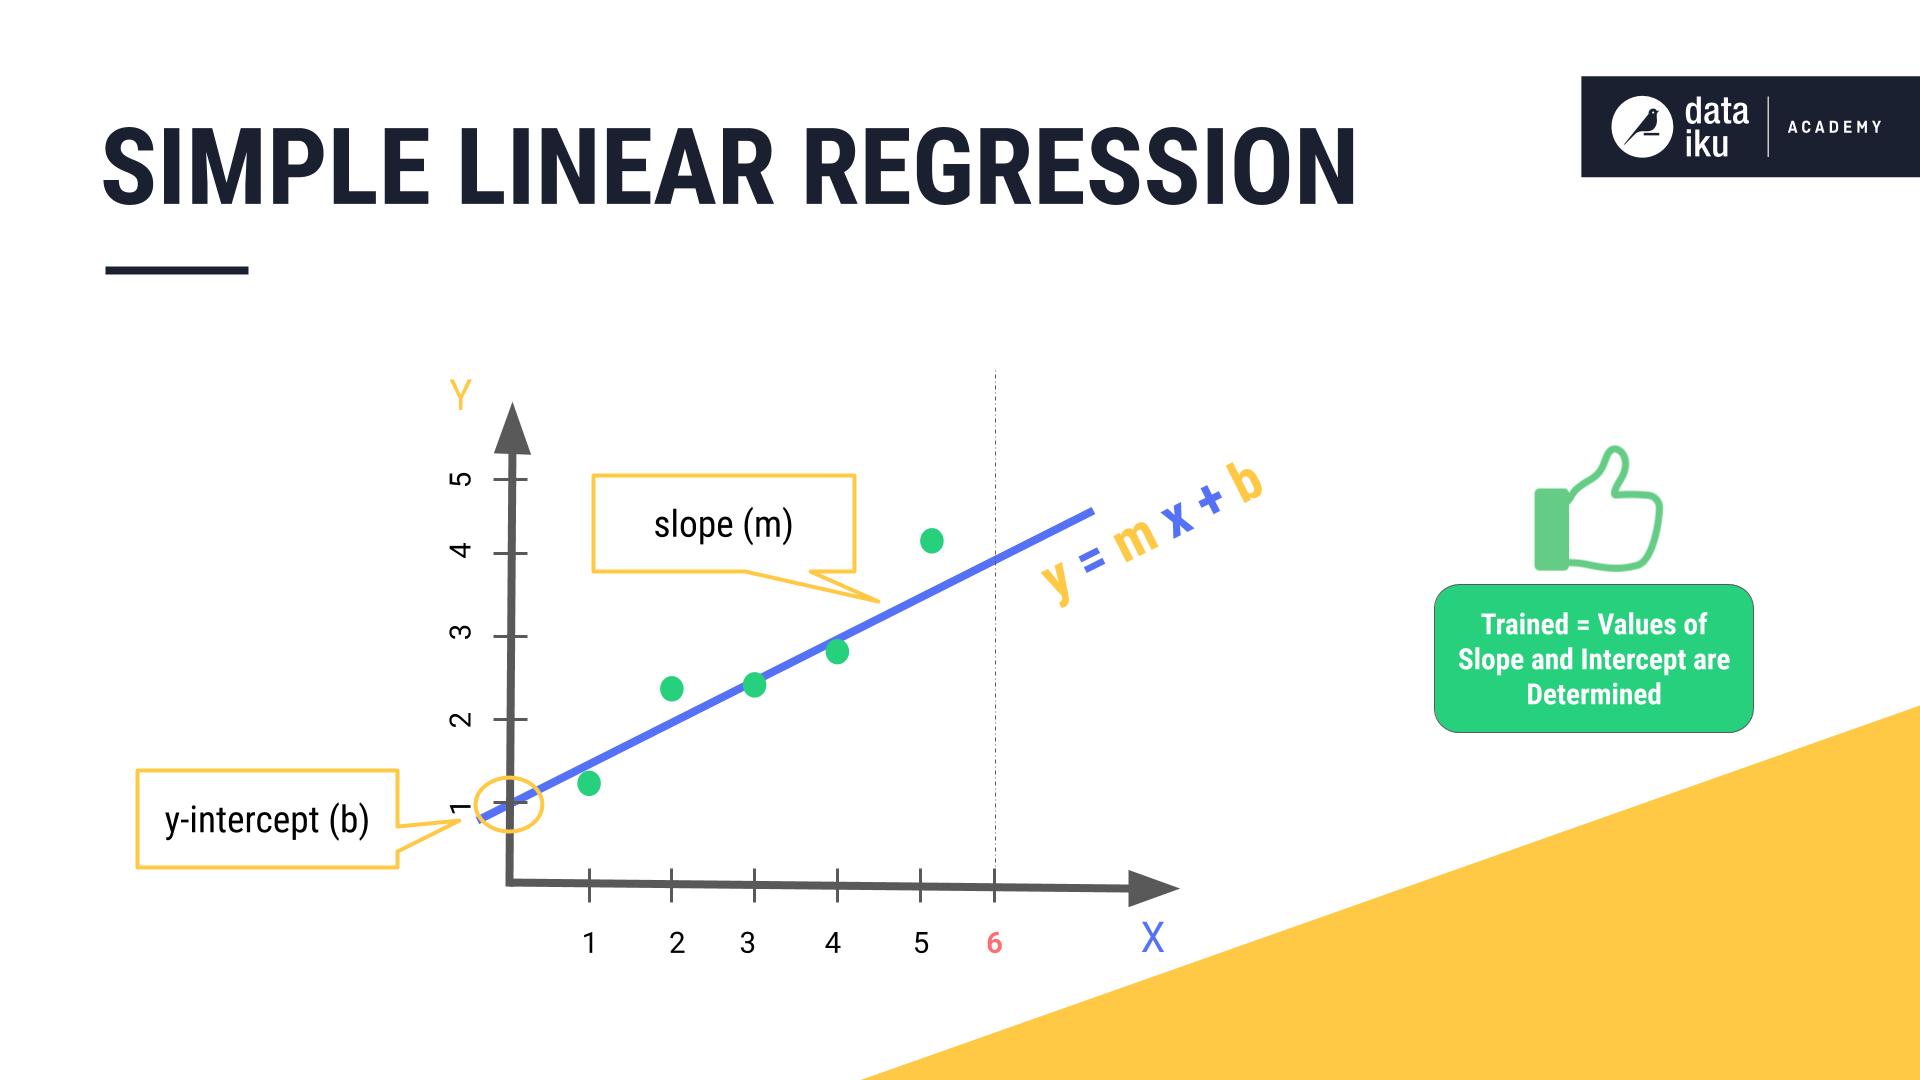
The equation of a simple linear regression line is y = mx + b, where the constant value m is the slope or gradient of the line, and the constant b is the y-intercept value. When the algorithm determines the values of the slope and intercept, then it is said to be trained on the data. The algorithm can then take in new data where only the values of x are known, and use these values to predict the values of y.
What’s next
In the next section, we’ll take a closer look at the concept of labeled and unlabeled data and how labeled data is used in supervised machine learning.