How to segment your data using statistical quantiles
You can create statistical quantiles without code in Dataiku DSS in two ways:
The Split recipe allows you to break down each quantile into separate datasets, so it can be useful if you’re planning to separately handle a small amount of quantiles like quartiles or deciles.
The Window recipe allows you to create a new column containing the quantile value, which can be easier to set up for a large amount of quantiles like centiles.
In statistics and probability, quantiles are cut points dividing the range of a probability distribution into continuous intervals with equal probabilities, or dividing the observations in a sample in the same way. In the two examples below, let’s assume that you want to create quantiles based on a numerical column called “score”.
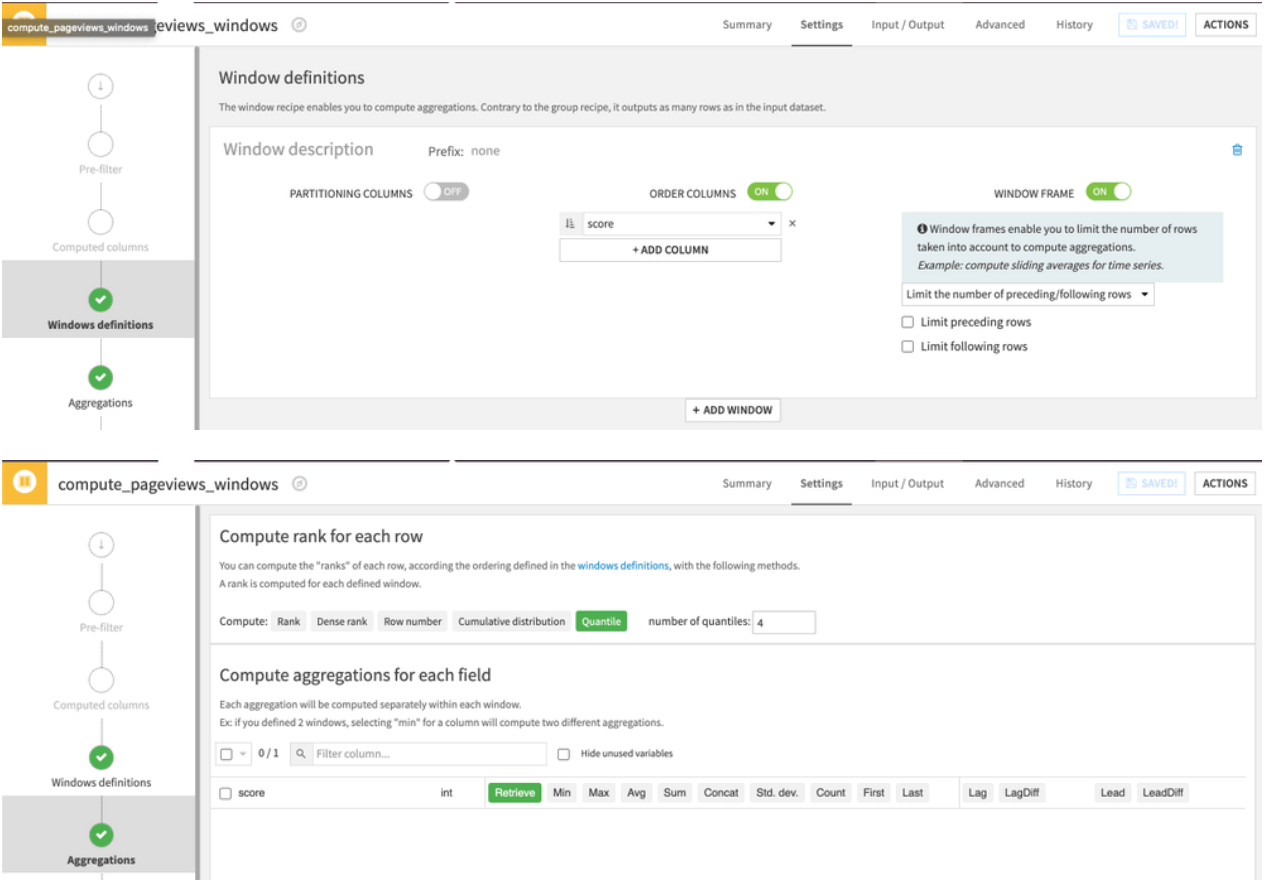
Using a Window recipe
Configure the Windows recipe to reorder the rows according to the scoring column, enable the window frame with no limits set, and configure the number of quantiles you want in the aggregations screen in addition to retrieving all the existing columns.
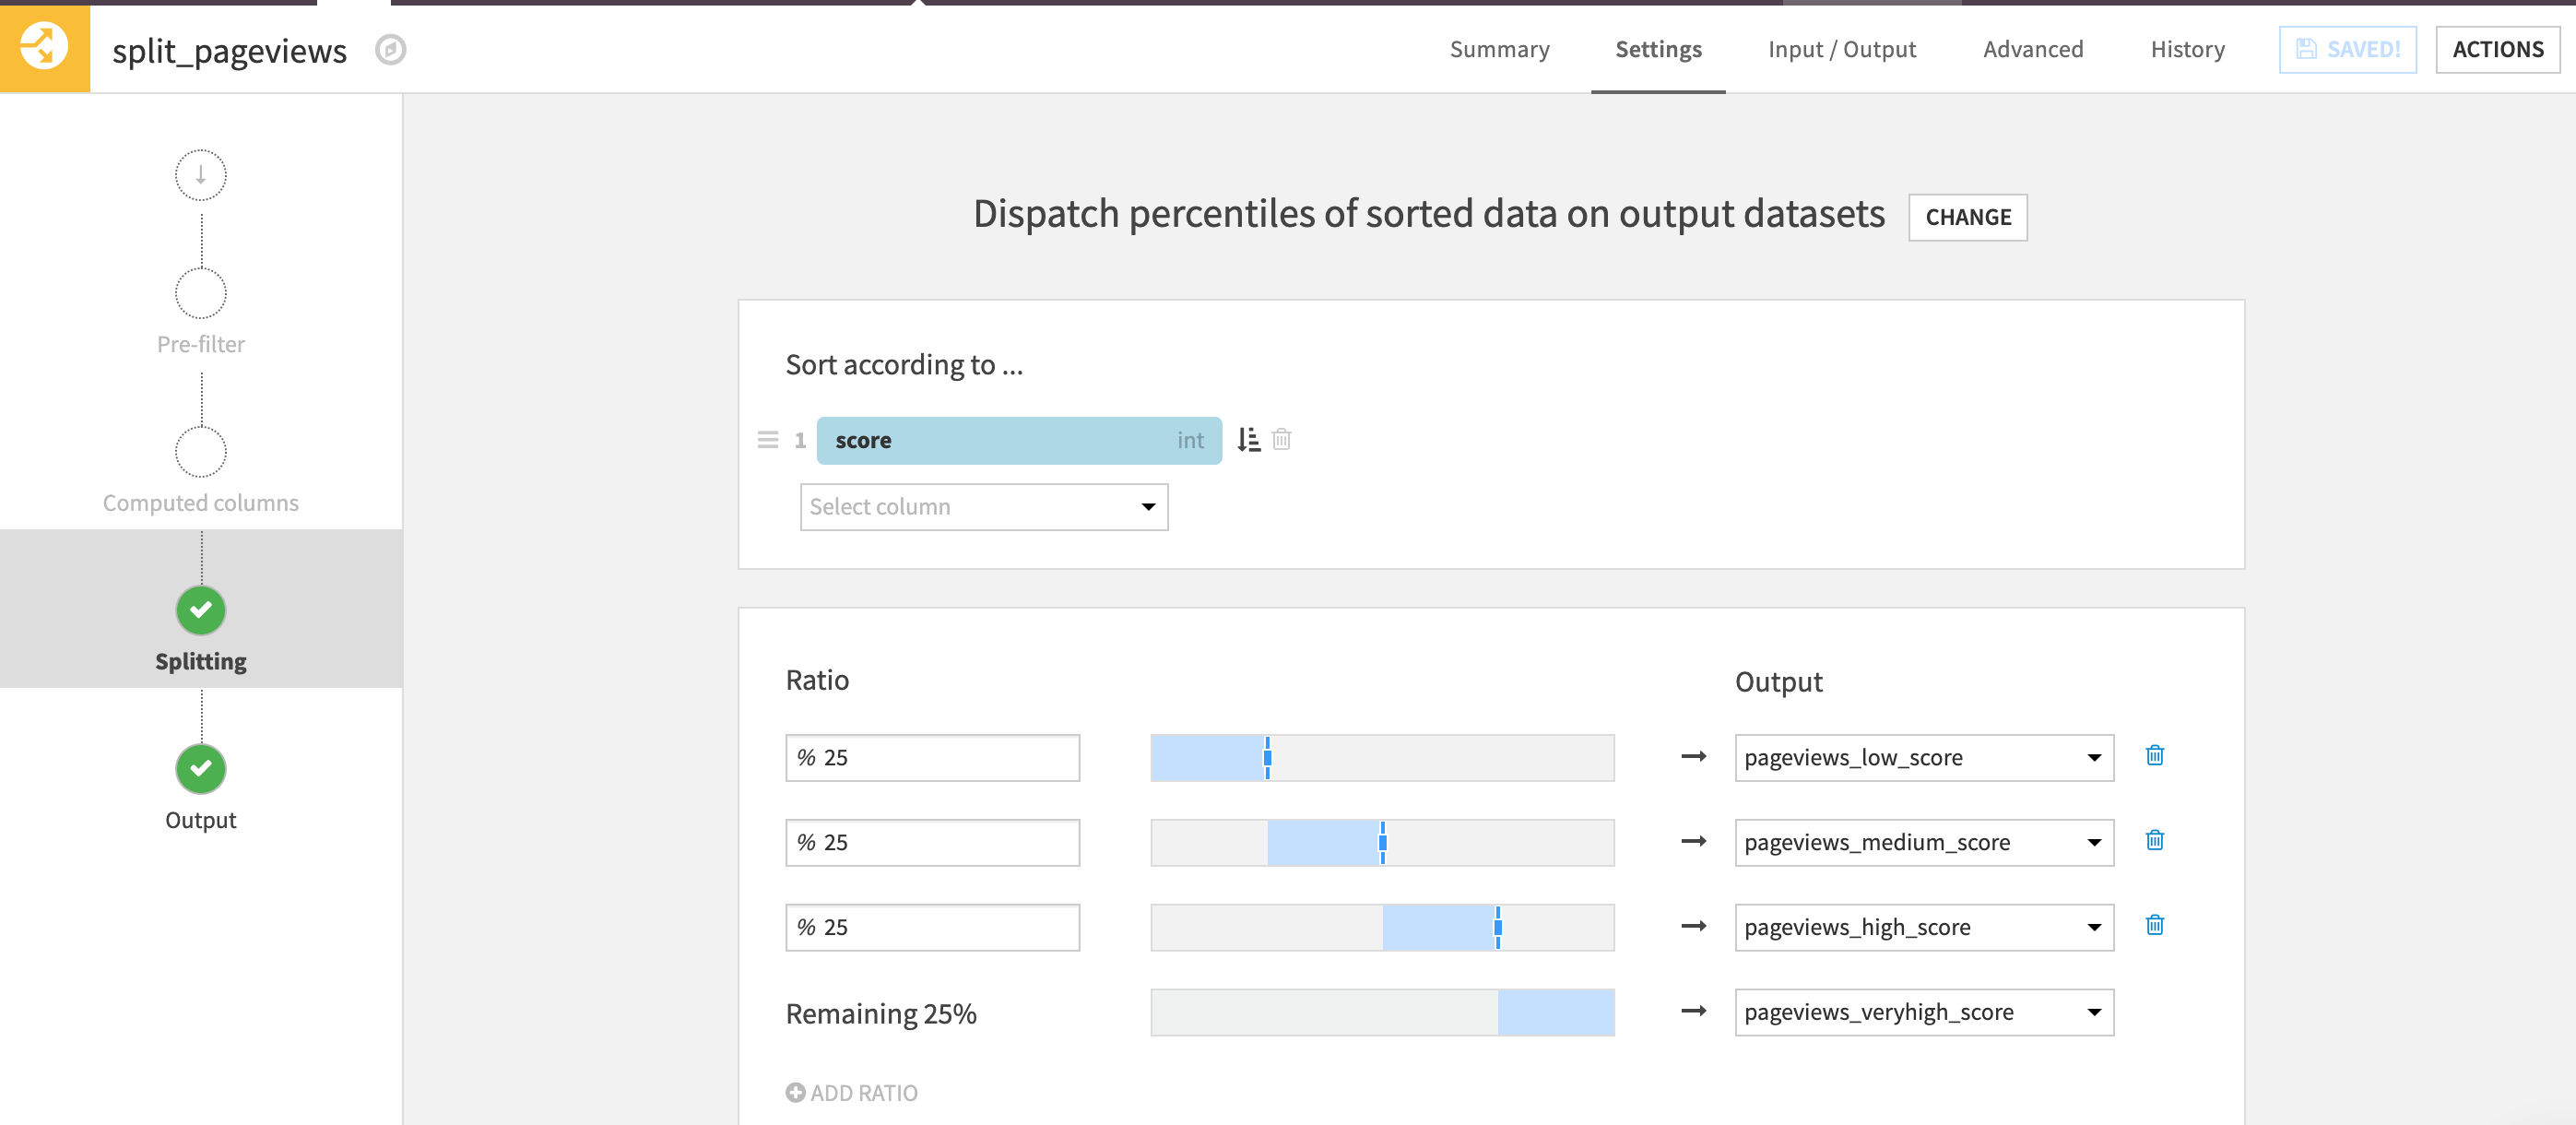
Using a Split recipe
Configure the Split recipe with the “Dispatch percentiles of sorted data” mode, order the rows according to the scoring column, and assign each portion of the rows in separate datasets.
Next Steps
In addition, to interactively compute statistical quantiles, you can refer to the quantiles table of the Interactive Statistics worksheets.
For more details about interactive statistics, please refer to this course.
You can read more about different Dataiku DSS recipes:
You can also watch this presentation on Customer Predictive Analytics to learn how Dataiku DSS was used to perform data preparation. This resulted in using a machine learning algorithm to assess the probability of a customer returning to the website a certain number of days after their visit.