Data Pipelines
If you have learned how to manipulate data in the Basics courses, you’re ready to build a more complex data pipeline.
This tutorial introduces two fundamental Dataiku concepts:
the difference between recursive and non-recursive dataset build options
how to propagate schema changes downstream in a Flow.
Prerequisites
This tutorial assumes that you have completed the Basics courses prior to beginning this one!
Create the Project
From the Dataiku homepage, click +New Project > DSS Tutorials > Visual Recipes > Tutorial: Data Pipelines.
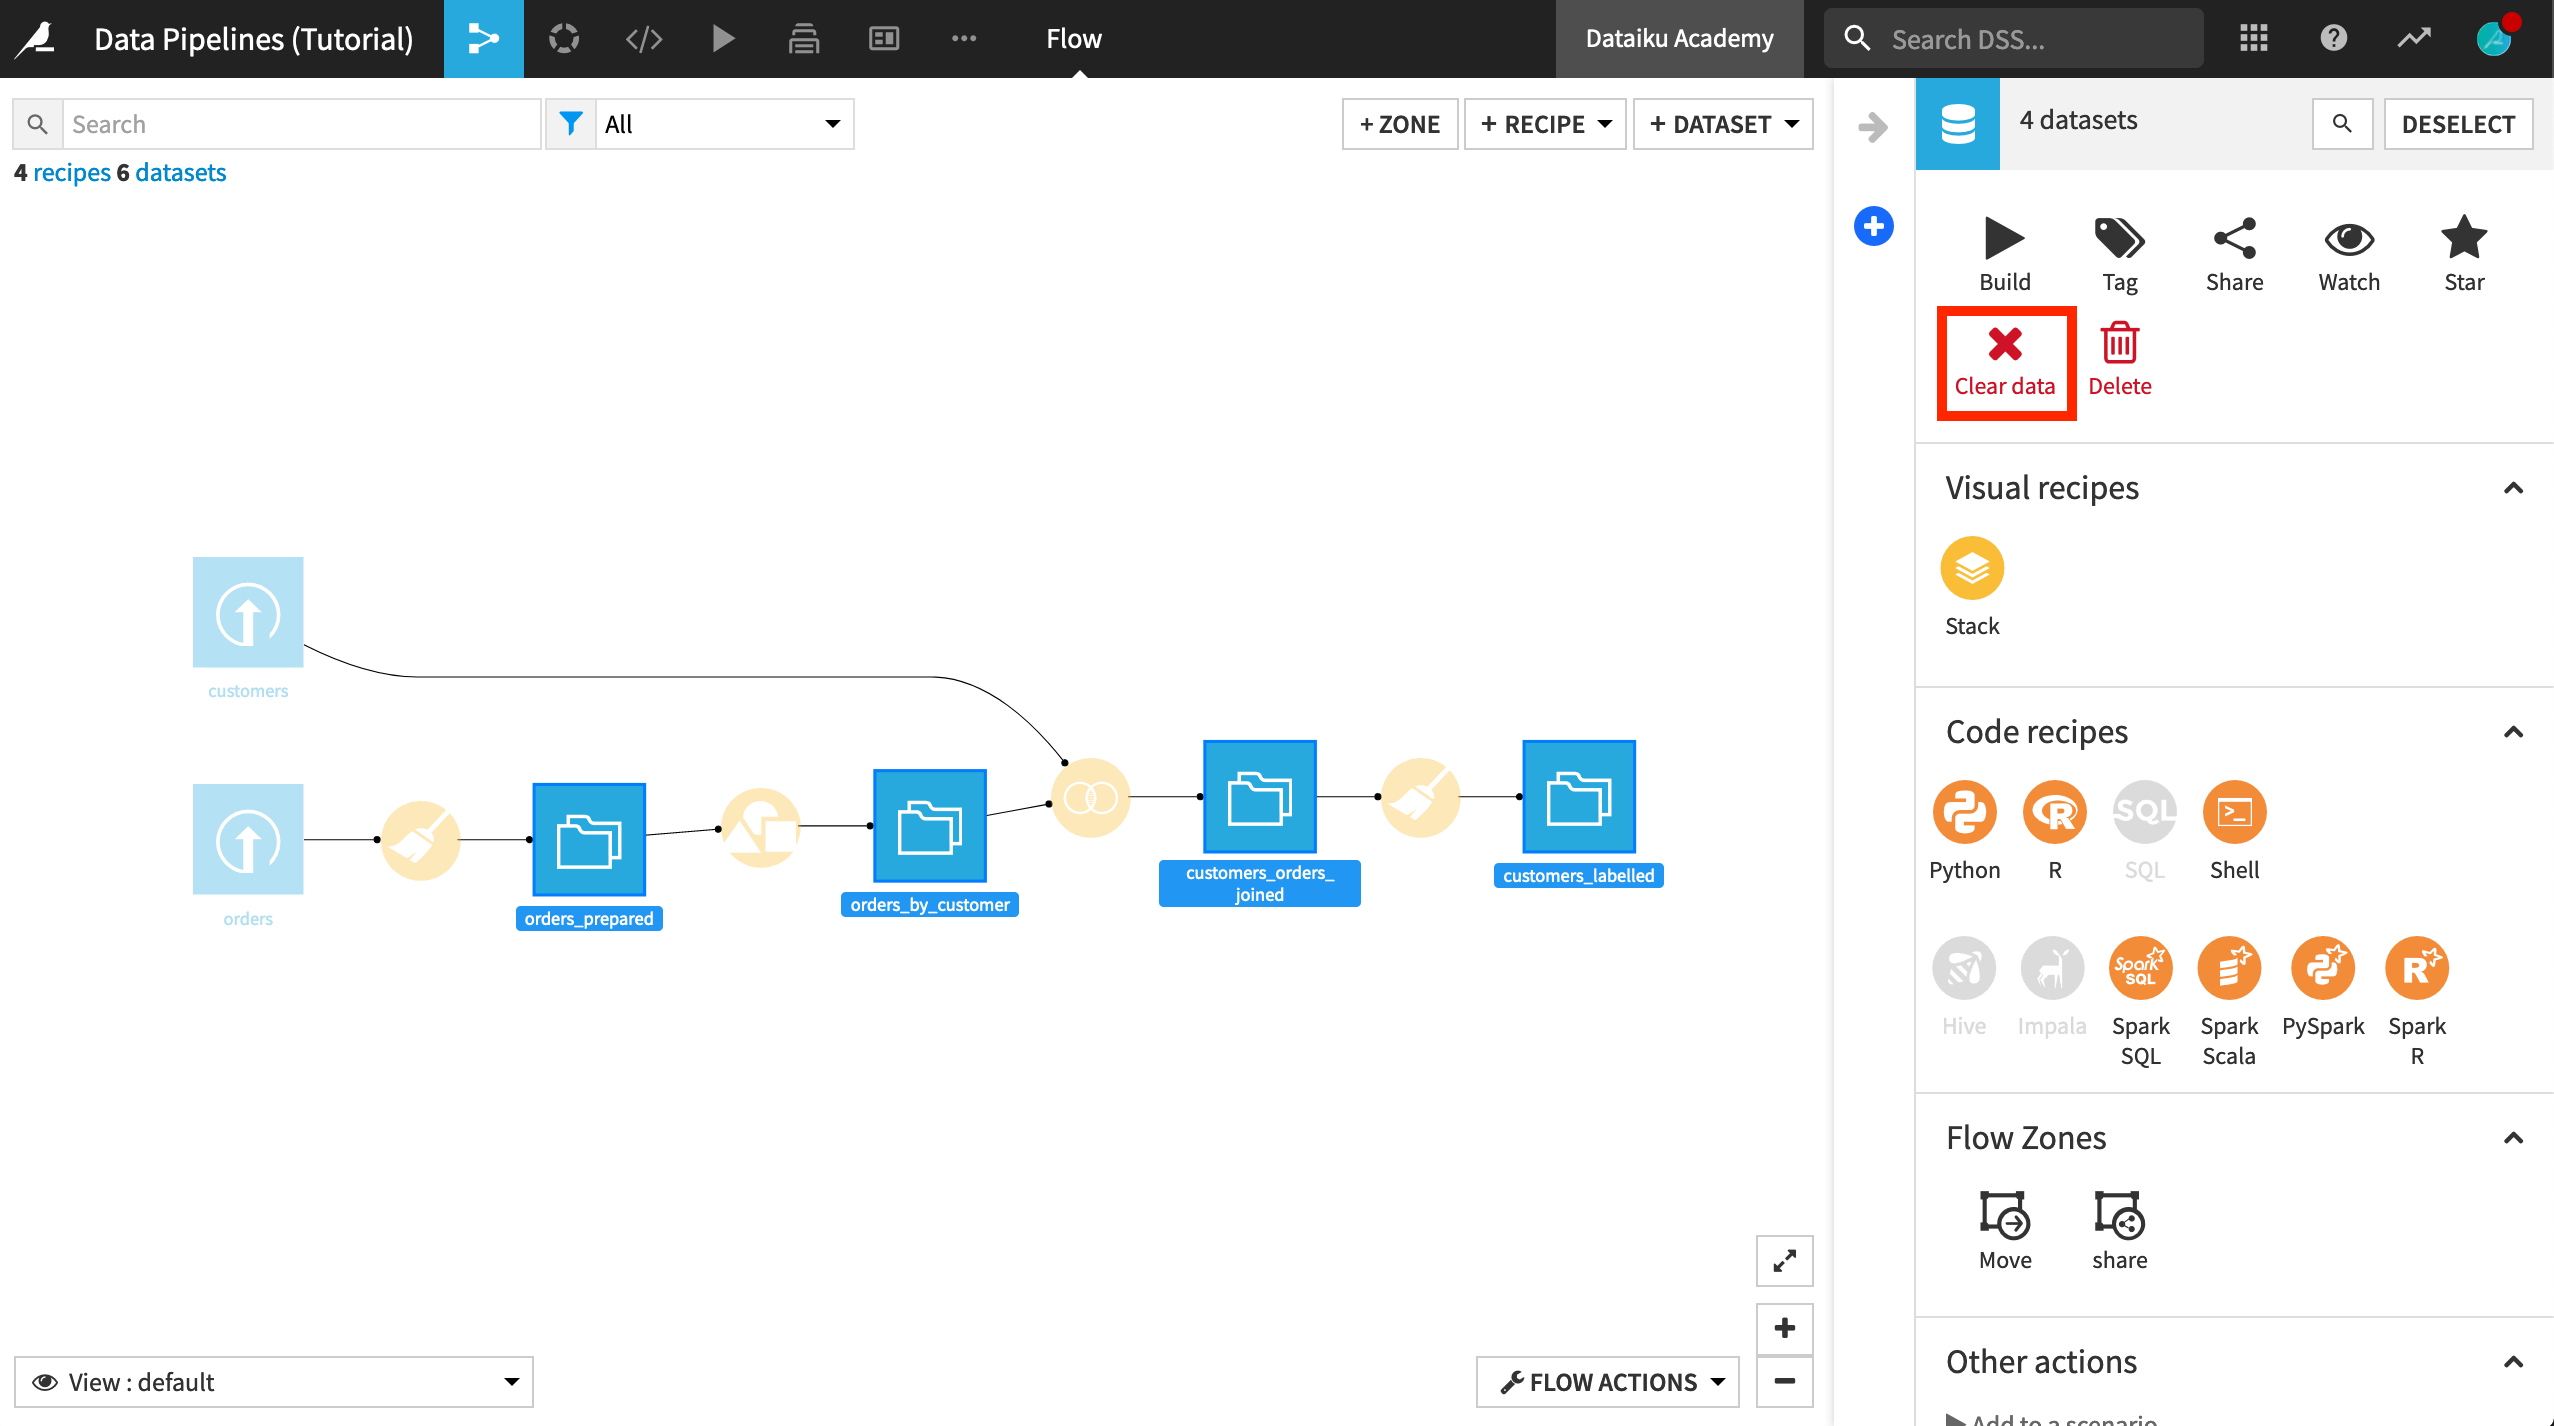
In this tutorial, we are going to practice building the Flow in different ways, and so let’s start by clearing all of the datasets except for the two uploaded input datasets.
Select the four downstream datasets (orders_prepared, orders_by_customer, customers_orders_joined, customers_labelled).
From the Actions sidebar, choose Clear data.
Update the Prepare Recipe
In the Basics courses, we looked at the total purchase history of each customer. In this Flow, we want to break down the purchase history by year. As a first step, we’ll need to update the first Prepare recipe so that it extracts the year from the column order_date.
Open the first Prepare recipe.
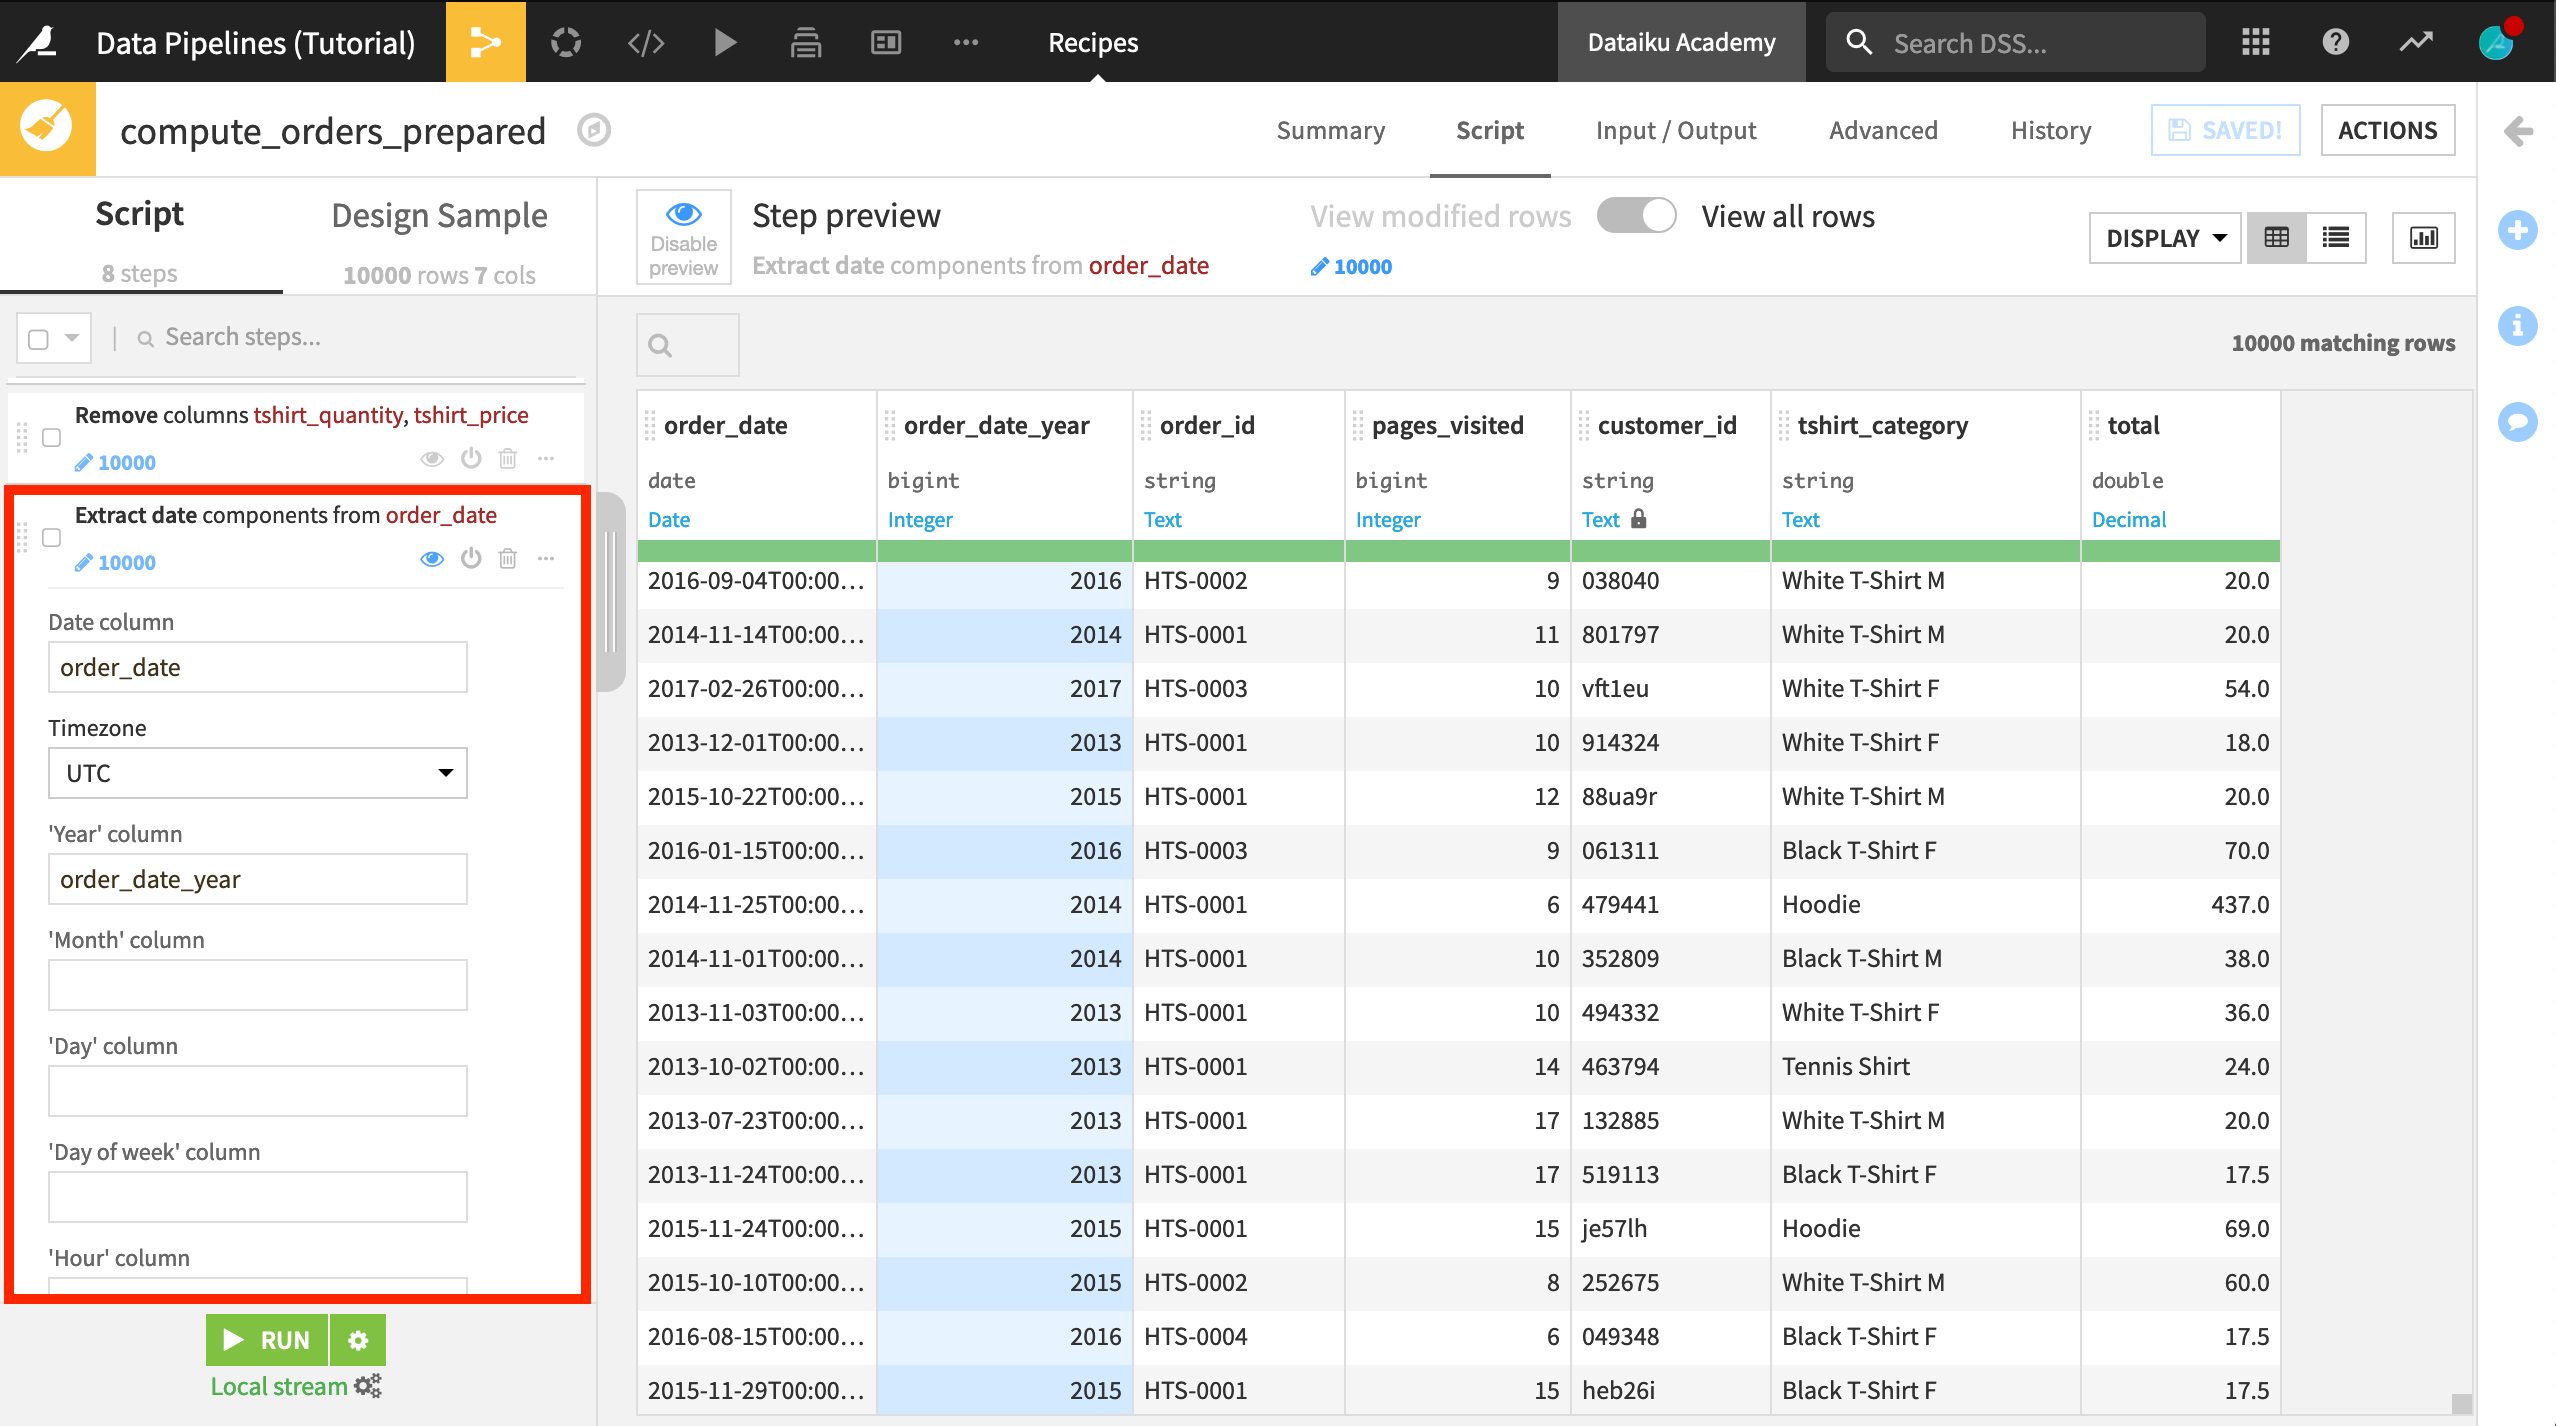
Click on the order_date column heading, and select Extract date components from the dropdown list.
In the newly created step in the script, clear the entries for month and day so that only order_date_year is created.
Click Save, and accept the schema changes, but do not run the recipe yet.
Note
Recipe Run Options
After accepting the schema changes, it is not necessary to run the recipe at this time. The next few visual recipes can be created by saving and updating the schema each time, without building the datasets. Wait for instructions to build the dataset to better understand Dataiku’s Run options.
Create a New Branch in the Flow
The current Flow groups the orders_prepared dataset by customer using a Group recipe to produce the orders_by_customer dataset. This dataset contains the total purchase history of each customer.
We’re going to keep this part of the Flow, but create a new branch by copying the Group recipe and adding order_date_year as a group key.
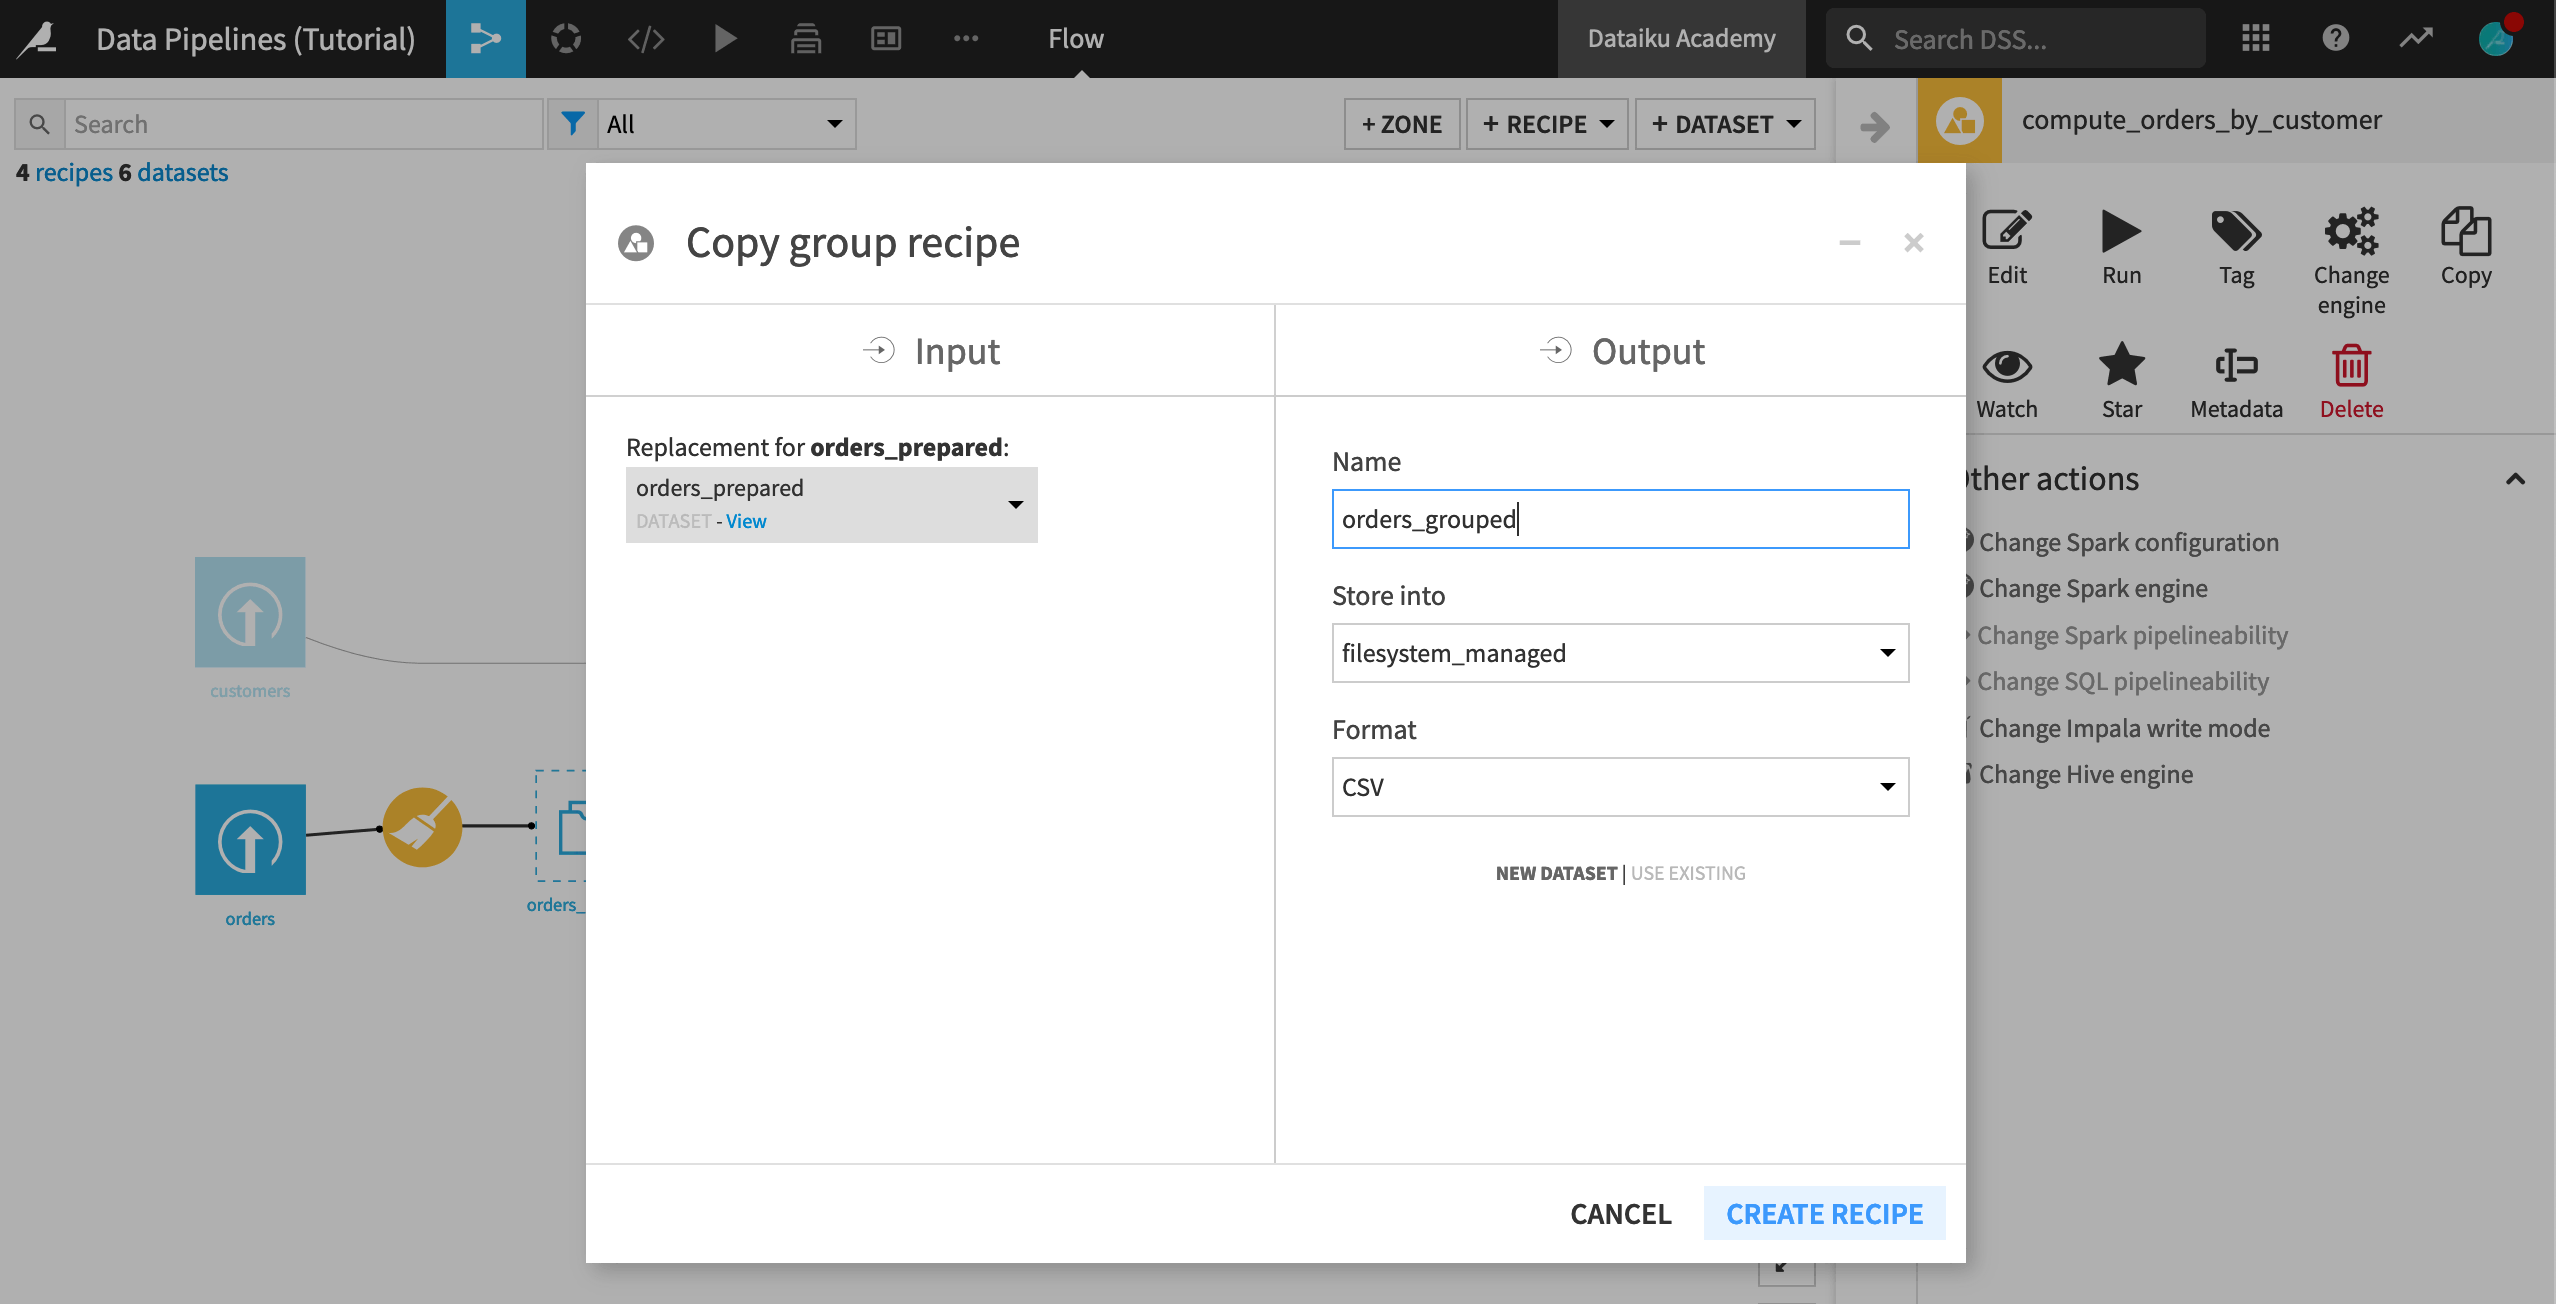
Select the Group recipe, and from the Actions menu, select Copy.
Leave orders_prepared as the input dataset.
Name the output dataset
orders_grouped.Click Create Recipe.
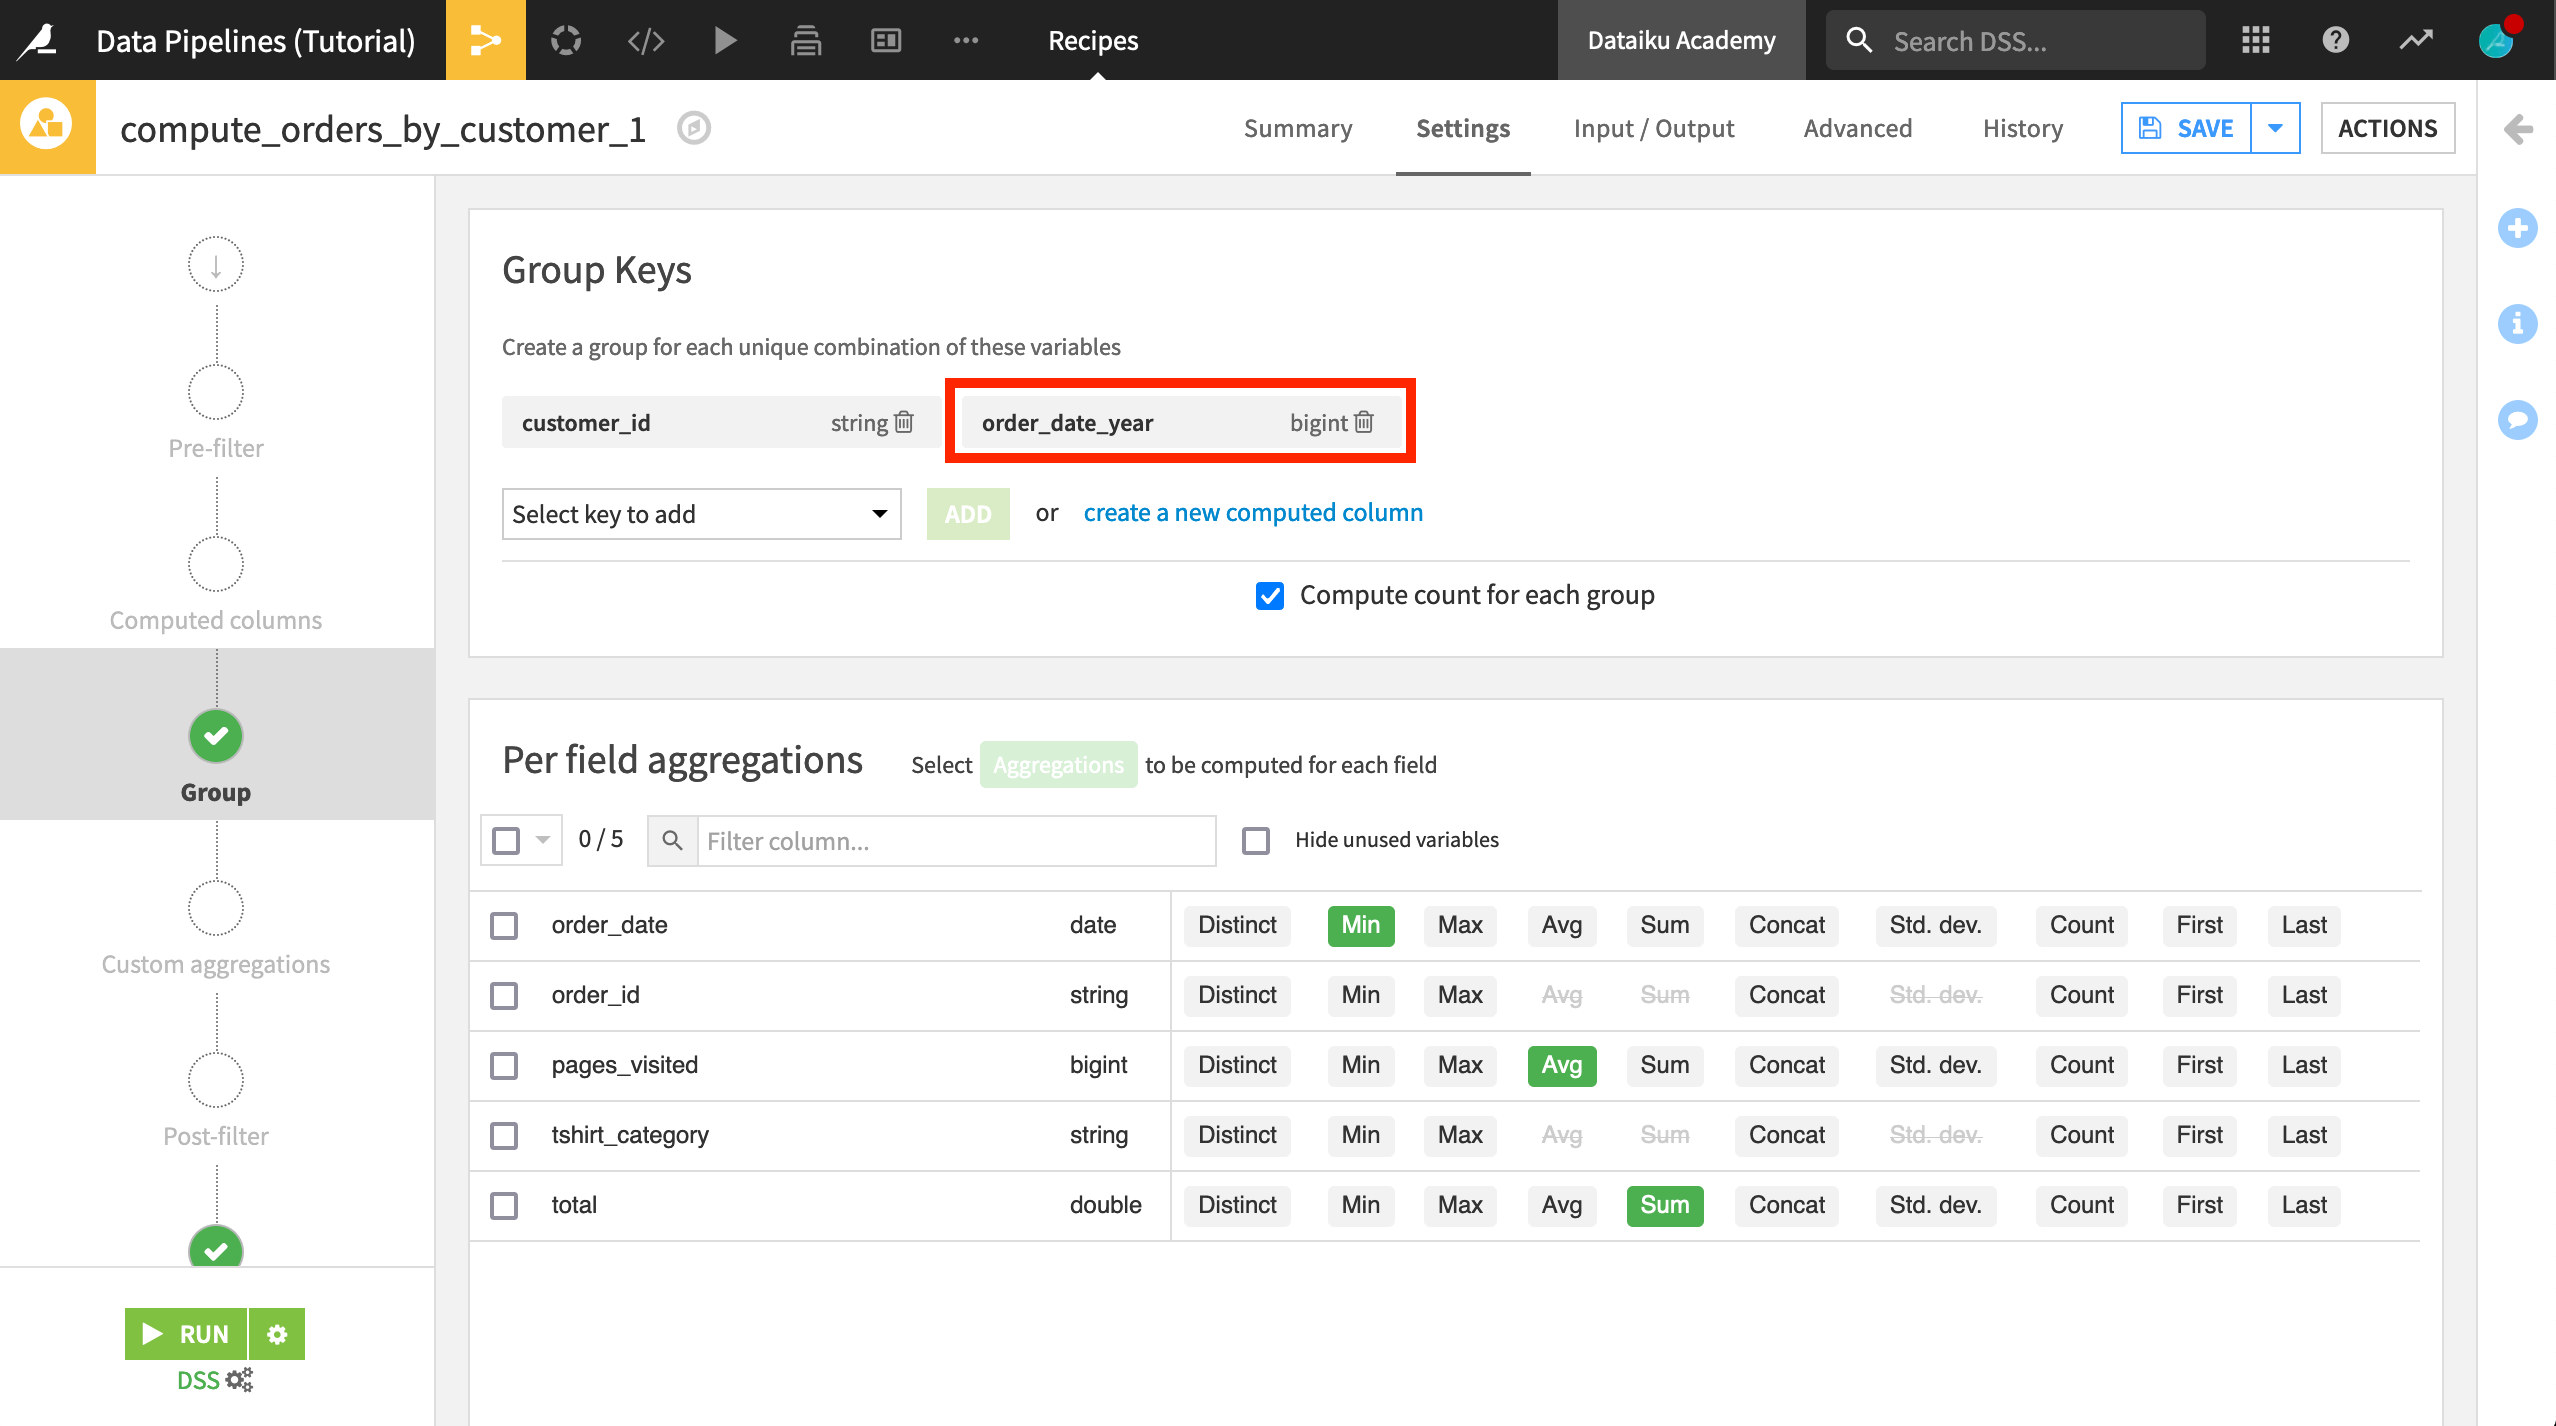
In the Group recipe, add order_date_year as a group key.
Click Save, and accept the schema changes. (Once again, do not run the recipe).
Use the Window Recipe to Compute Customer Ranks by Year
Although it is not yet built, we now have the schema of a dataset that groups purchases by customer and year. Our next step is to get a ranking of each customer’s spending in each year. We can do this with the Window recipe.
With the empty orders_grouped dataset selected:
Choose Actions > Window.
Click Create Recipe.
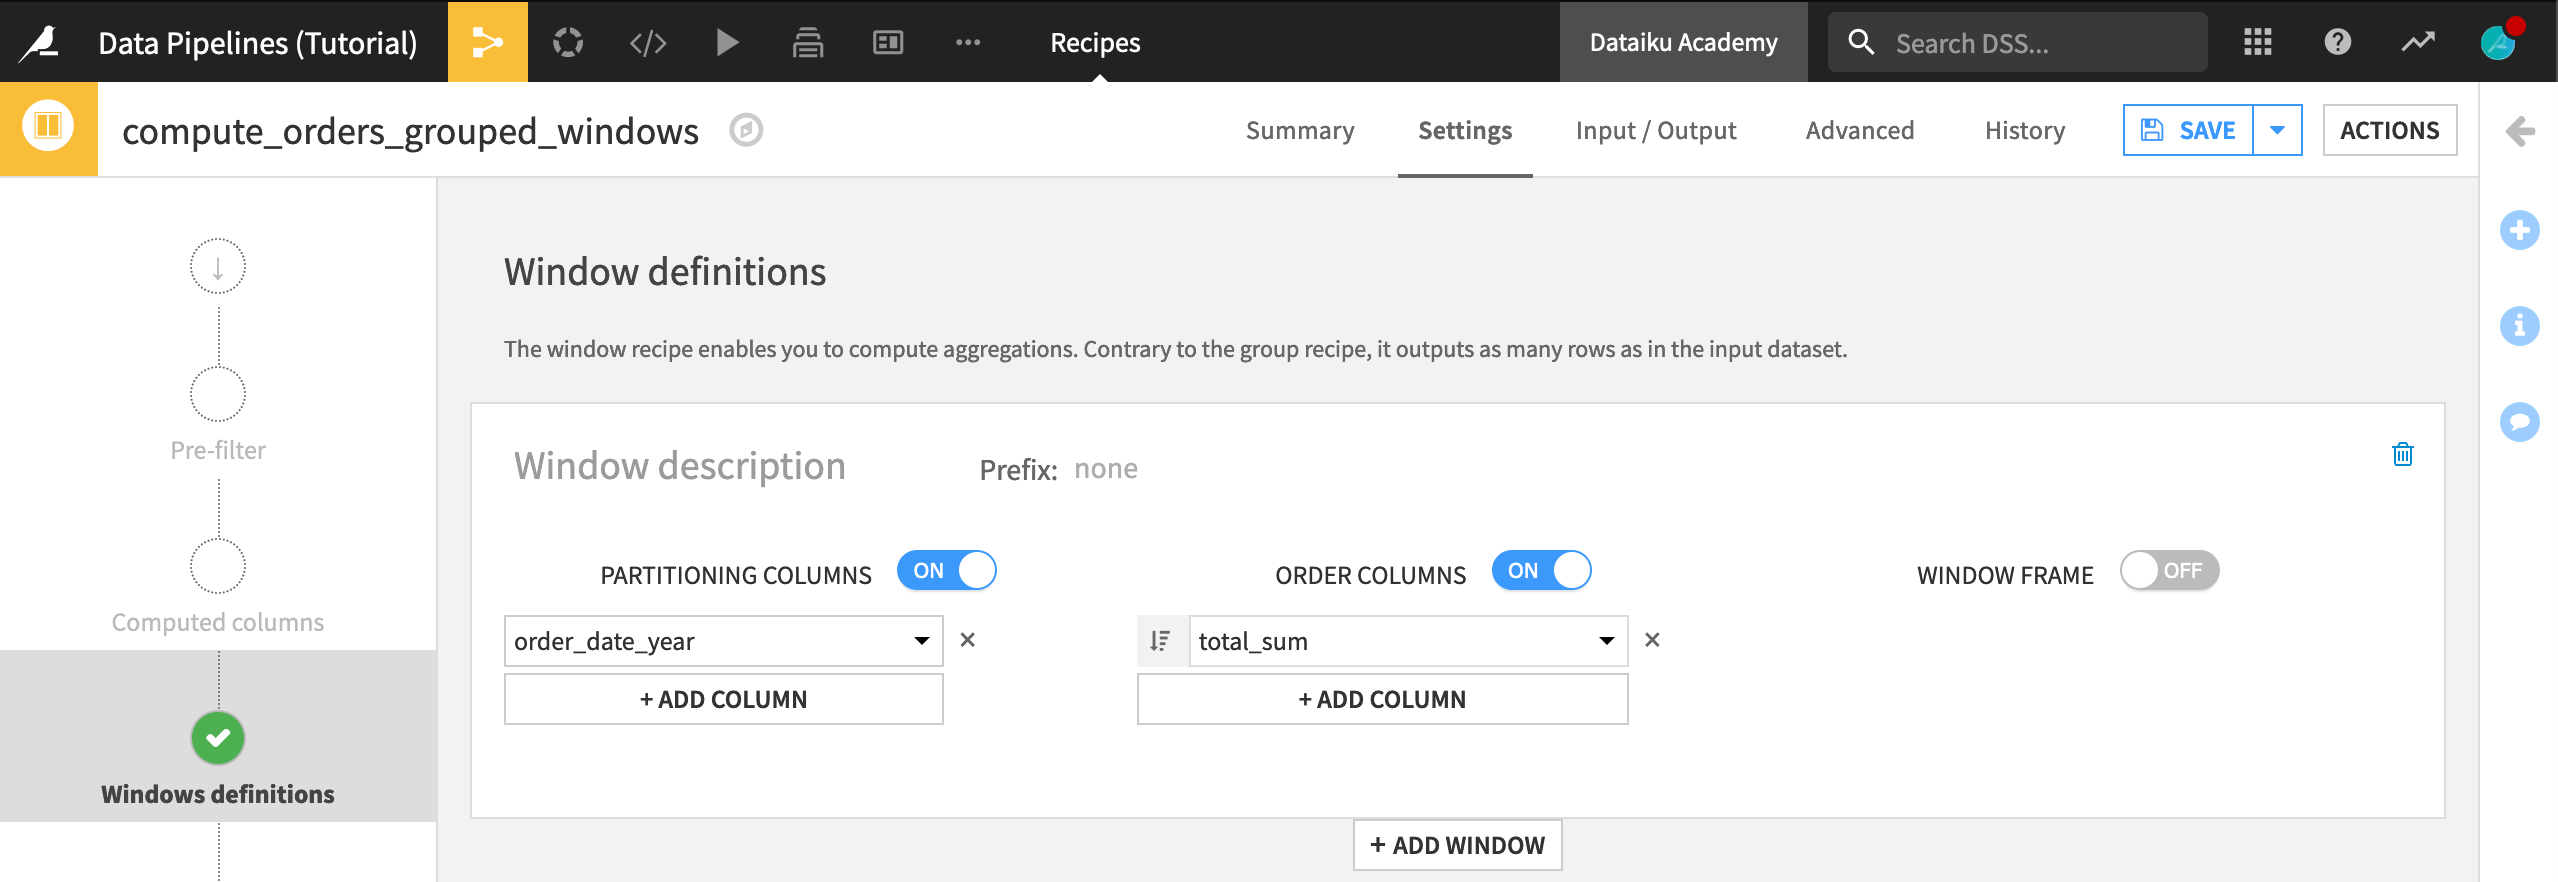
In order to compute a ranking of spending by year, we need to compare each customer’s spending within a given year. In the Window definitions step of the Window recipe:
Turn Partitioning Columns On, and select order_date_year as the partitioning column. This will group the output.
Turn Order Columns On, and select total_sum as the order column. Click the ordering button so that spending will be looked at in descending order
 .
.
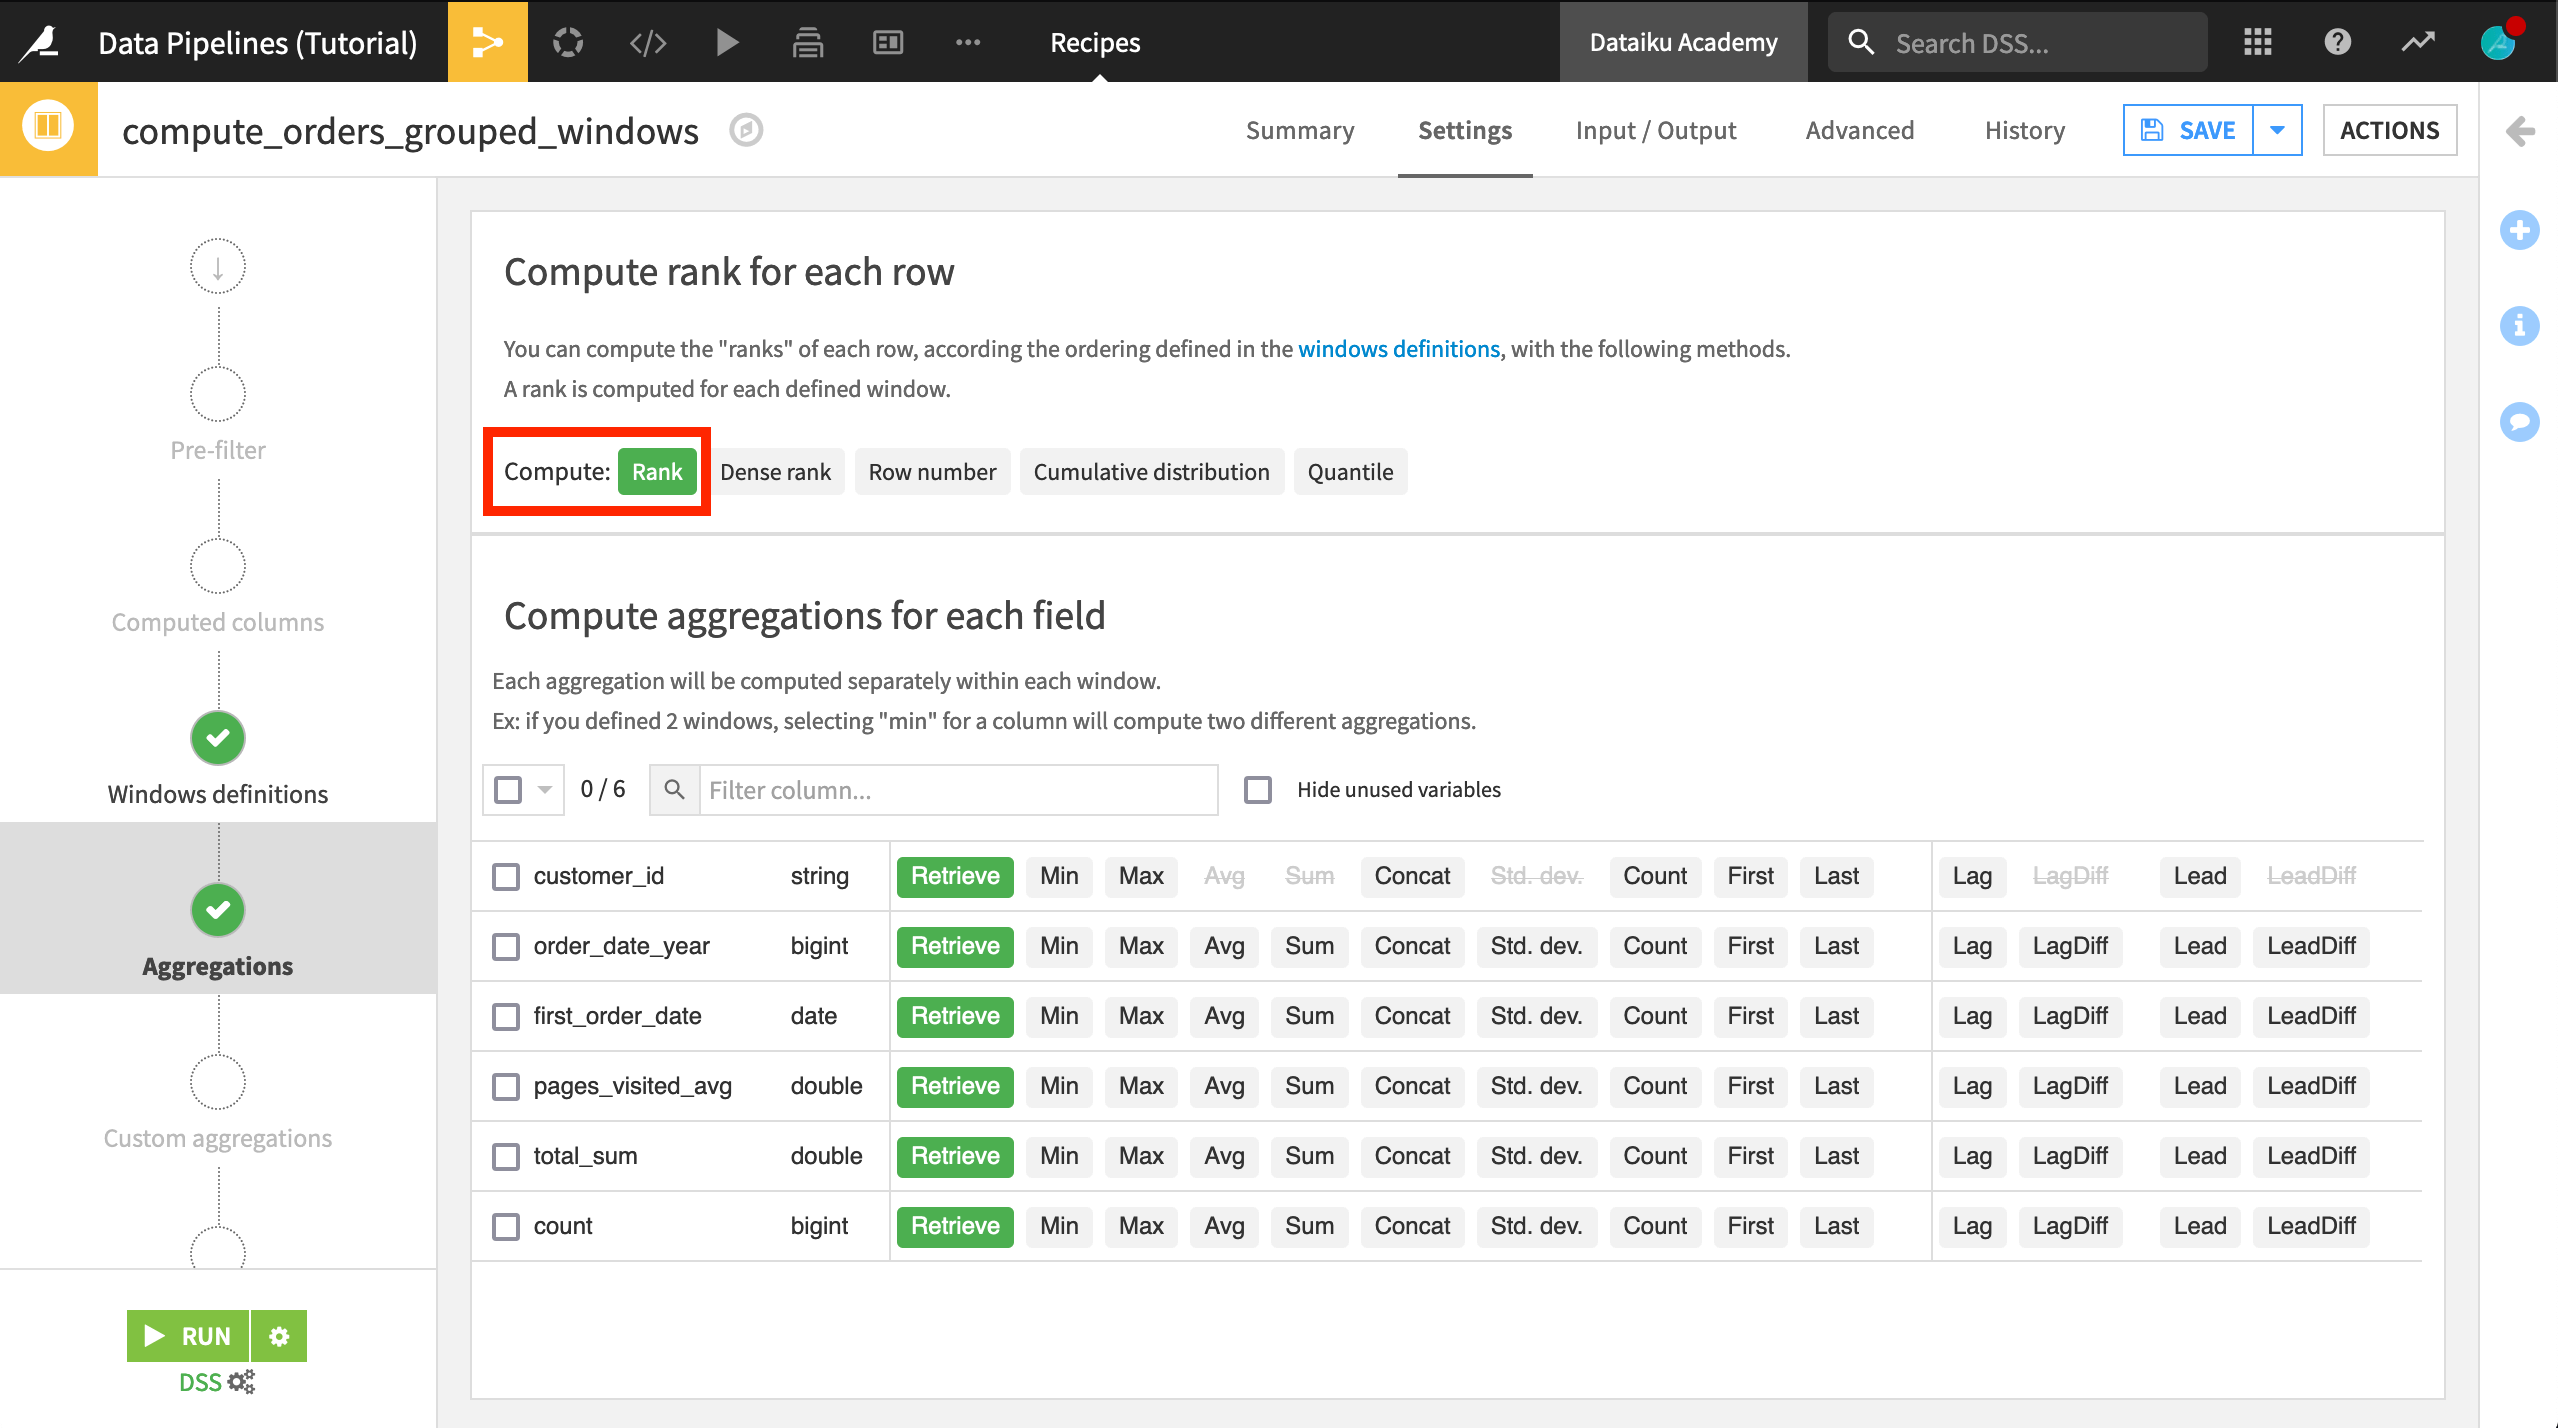
On the Aggregations step, select Rank to compute the rank for each row.
Click Save, and accept the schema changes. (Again, do not run the recipe).
Pivot Ranks from Rows into Columns
Each row in the orders_grouped_windows dataset will represent a particular year’s spending for a given customer. We eventually want to join this information with other customer information where there is a single row for each customer. Thus, our next step is to Pivot the dataset so that there is a separate column for each year’s customer rankings.
With the empty orders_grouped_windows dataset selected:
Choose Actions > Pivot.
Choose order_date_year as the column to Pivot By.
Rename the output dataset to something like
orders_by_customer_pivoted.Click Create Recipe.
Now we can configure the Pivot recipe.
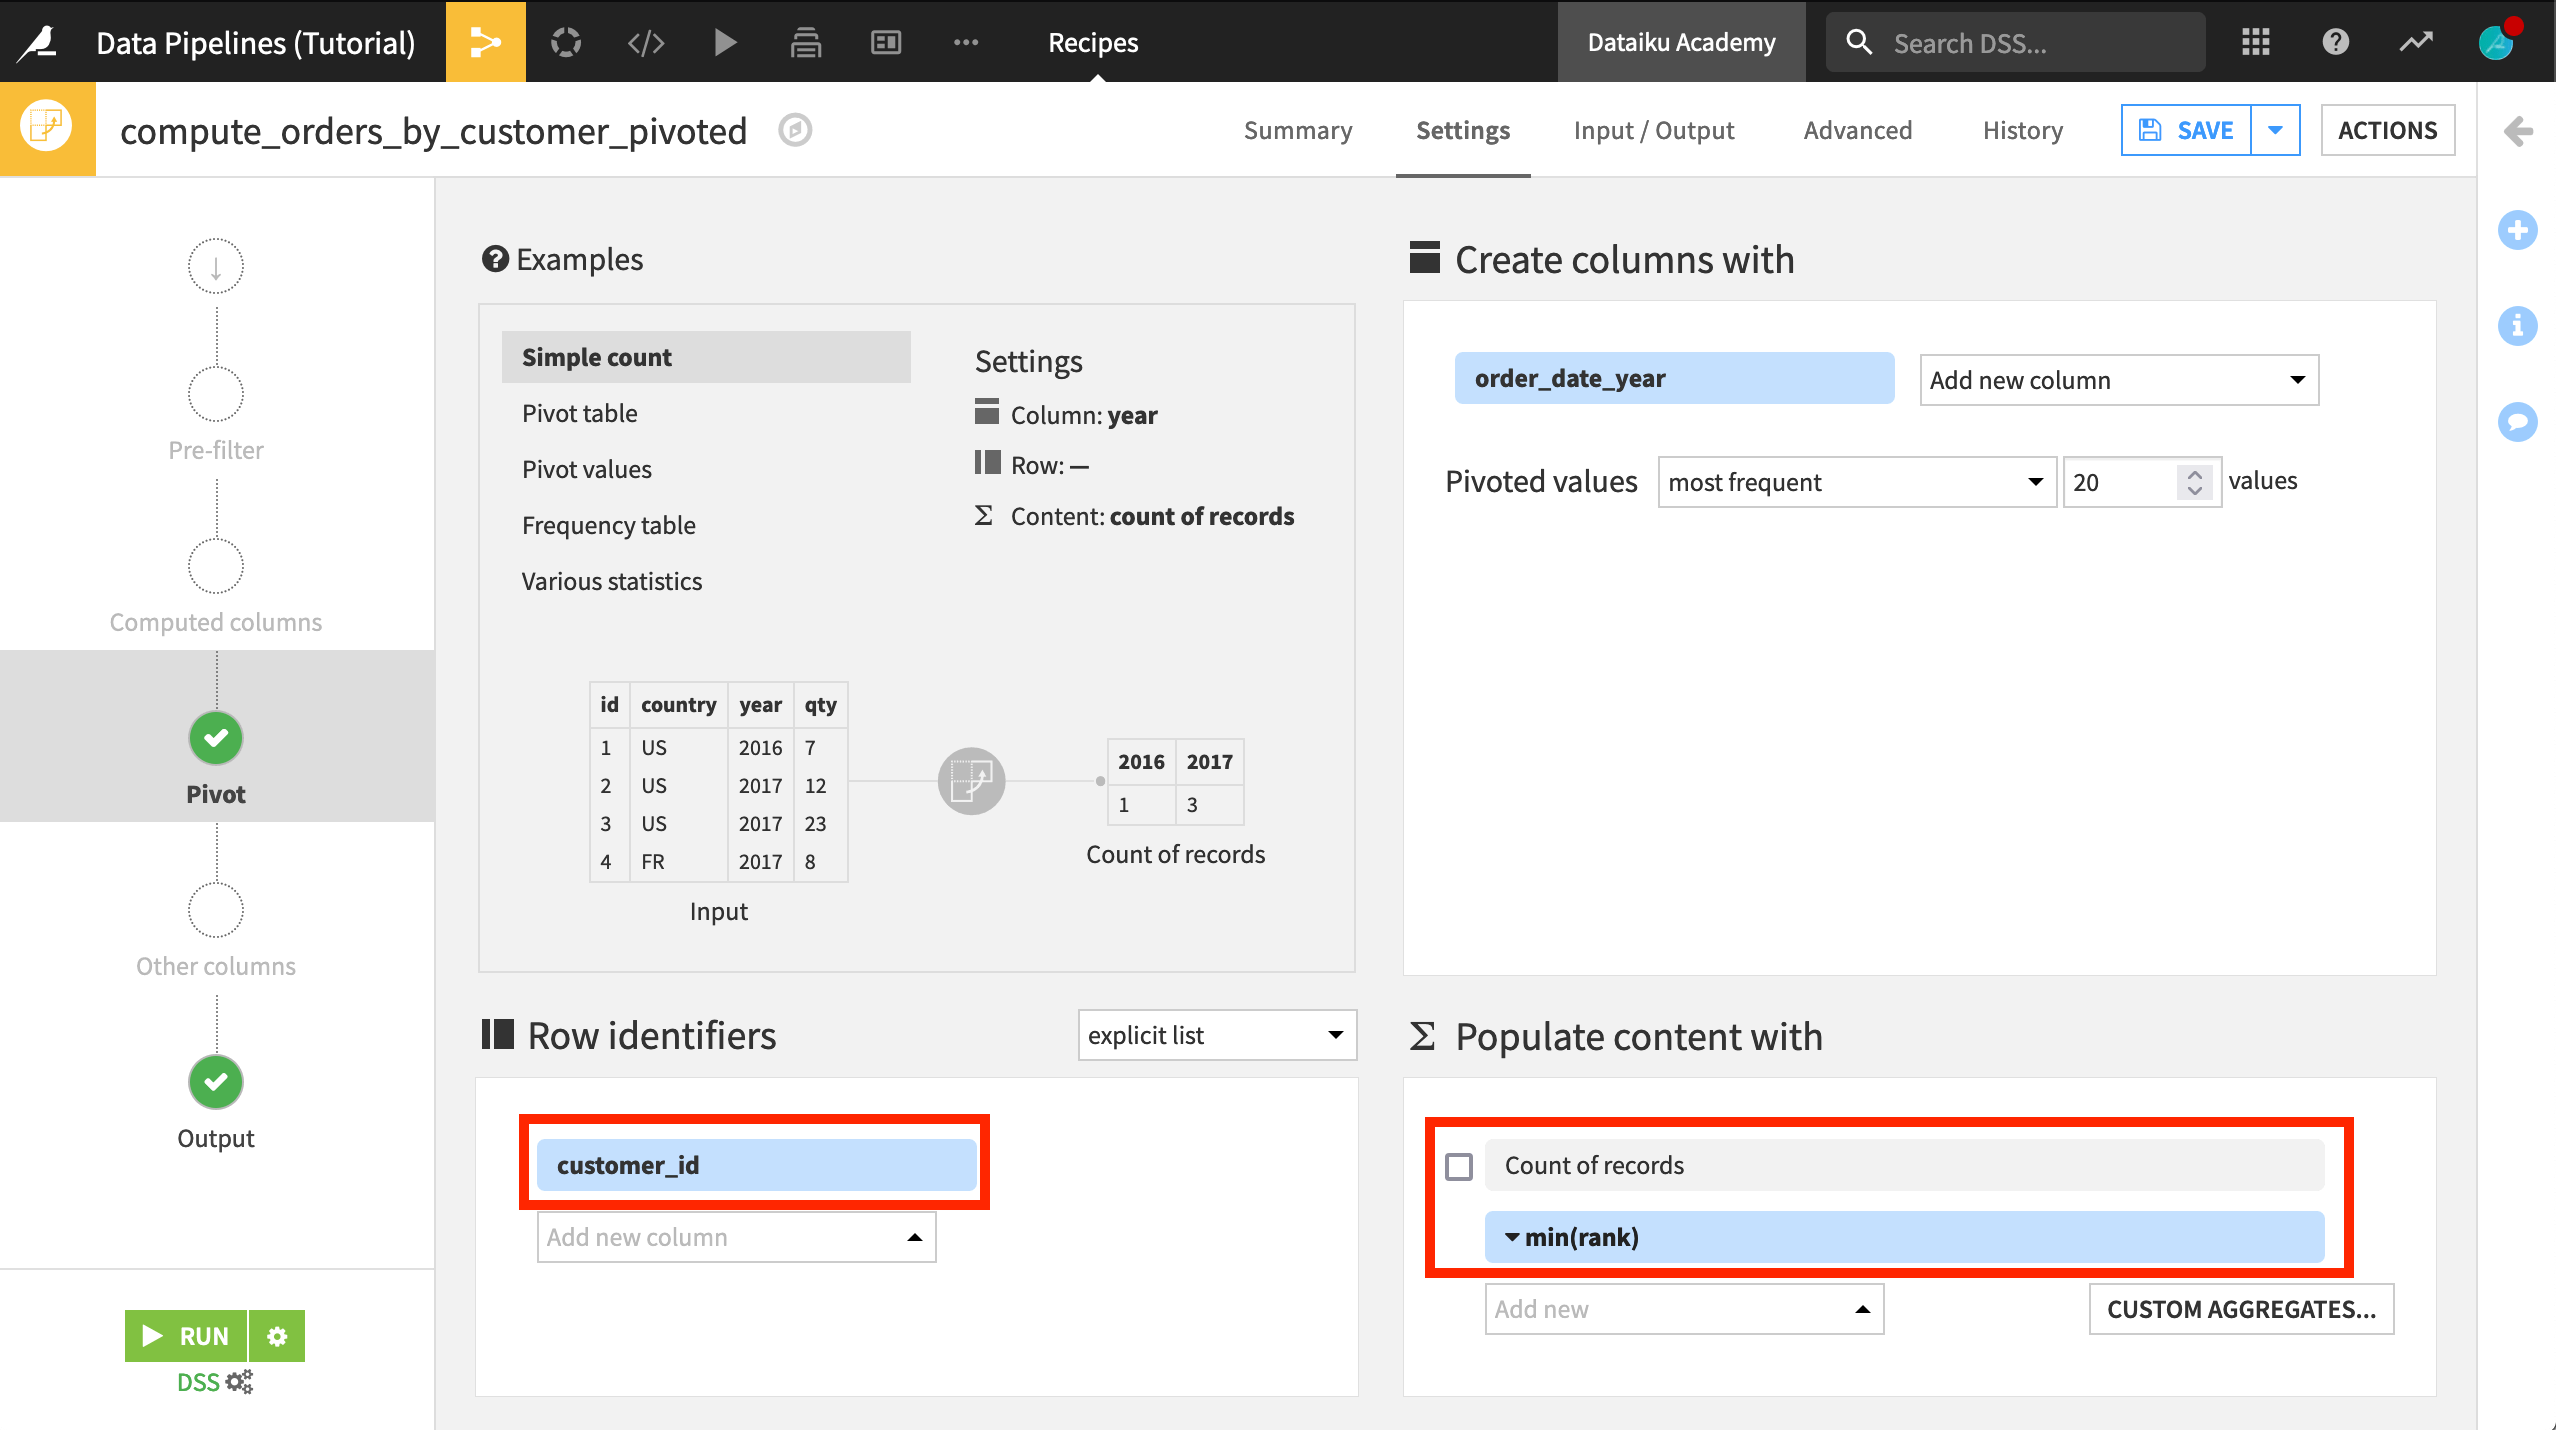
Select customer_id as a row identifier.
Deselect Count of records to populate content with.
Select rank from the dropdown list, and choose min as the aggregation.
Run the Recipe(s)
Note that, until this point, we have been able to construct a data pipeline without building any datasets because our goal has been clear in each recipe. It wasn’t necessary to see the resulting dataset to move on to the next recipe; all we needed was the schema.
The Pivot recipe, however, poses a problem. We can’t know the schema of the Pivot recipe’s output without running the recipe.
The columns created by the Pivot recipe are dependent upon the range of values of order_date_year, and so Dataiku cannot create a schema for orders_by_customer_pivoted without actually building the dataset.
If we try just running the Pivot recipe, we’ll get an error because the input dataset has not been built yet. (Feel free to try this on your own).
Instead we need to tell Dataiku to also build all of the missing upstream datasets. We could do this from the Flow, but since we’re already in the recipe editor follow these instructions:
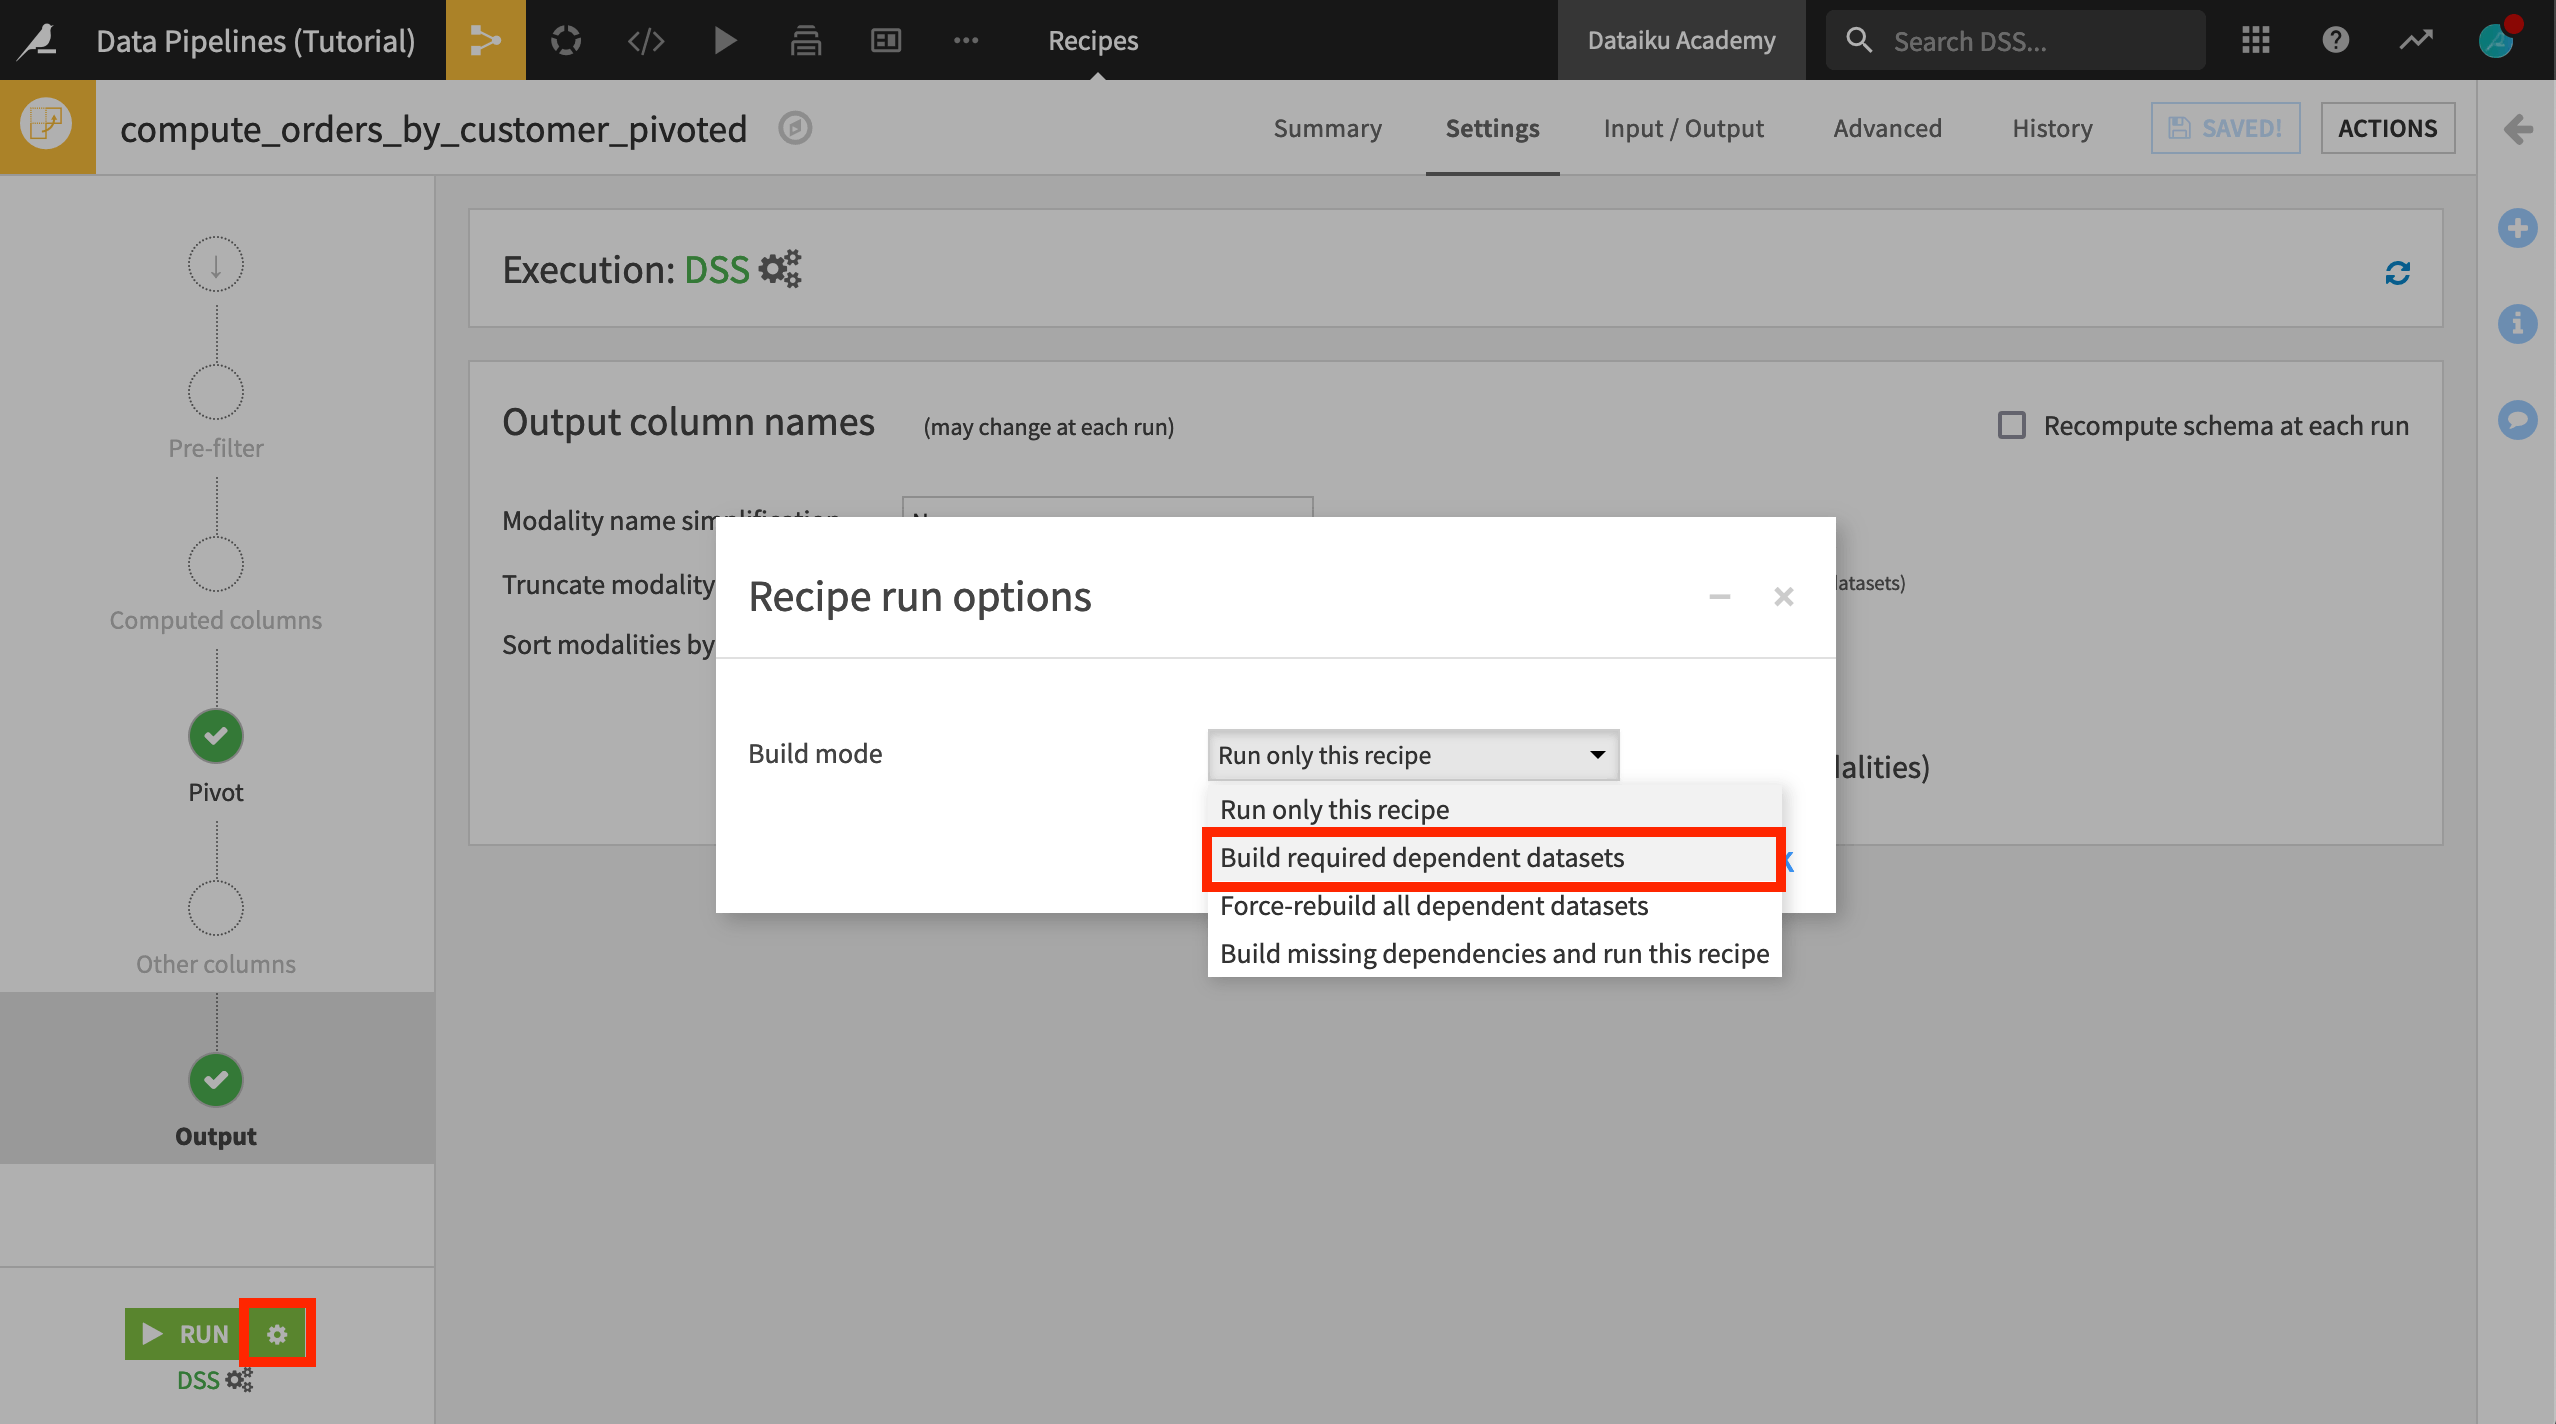
Click on the gear icon next to the Run button.
Select Build required dependent datasets as the “Build mode”.
Click OK, and then click Run.
Warning
Specifying the recipe to rebuild dependent datasets within the Settings tab of a recipe means that any time it is run, Dataiku will build the upstream datasets. If we don’t want rebuilding to be a permanent setting, we can change it after running the recipe.
Alternatively, we could select the orders_by_customer_pivoted dataset from the Flow (outside the recipe editor), and build it recursively.
Join Pivoted Data to Customer Data
Finally, we’re ready to add these columns to the rest of the customer data.
Open the existing Join recipe.
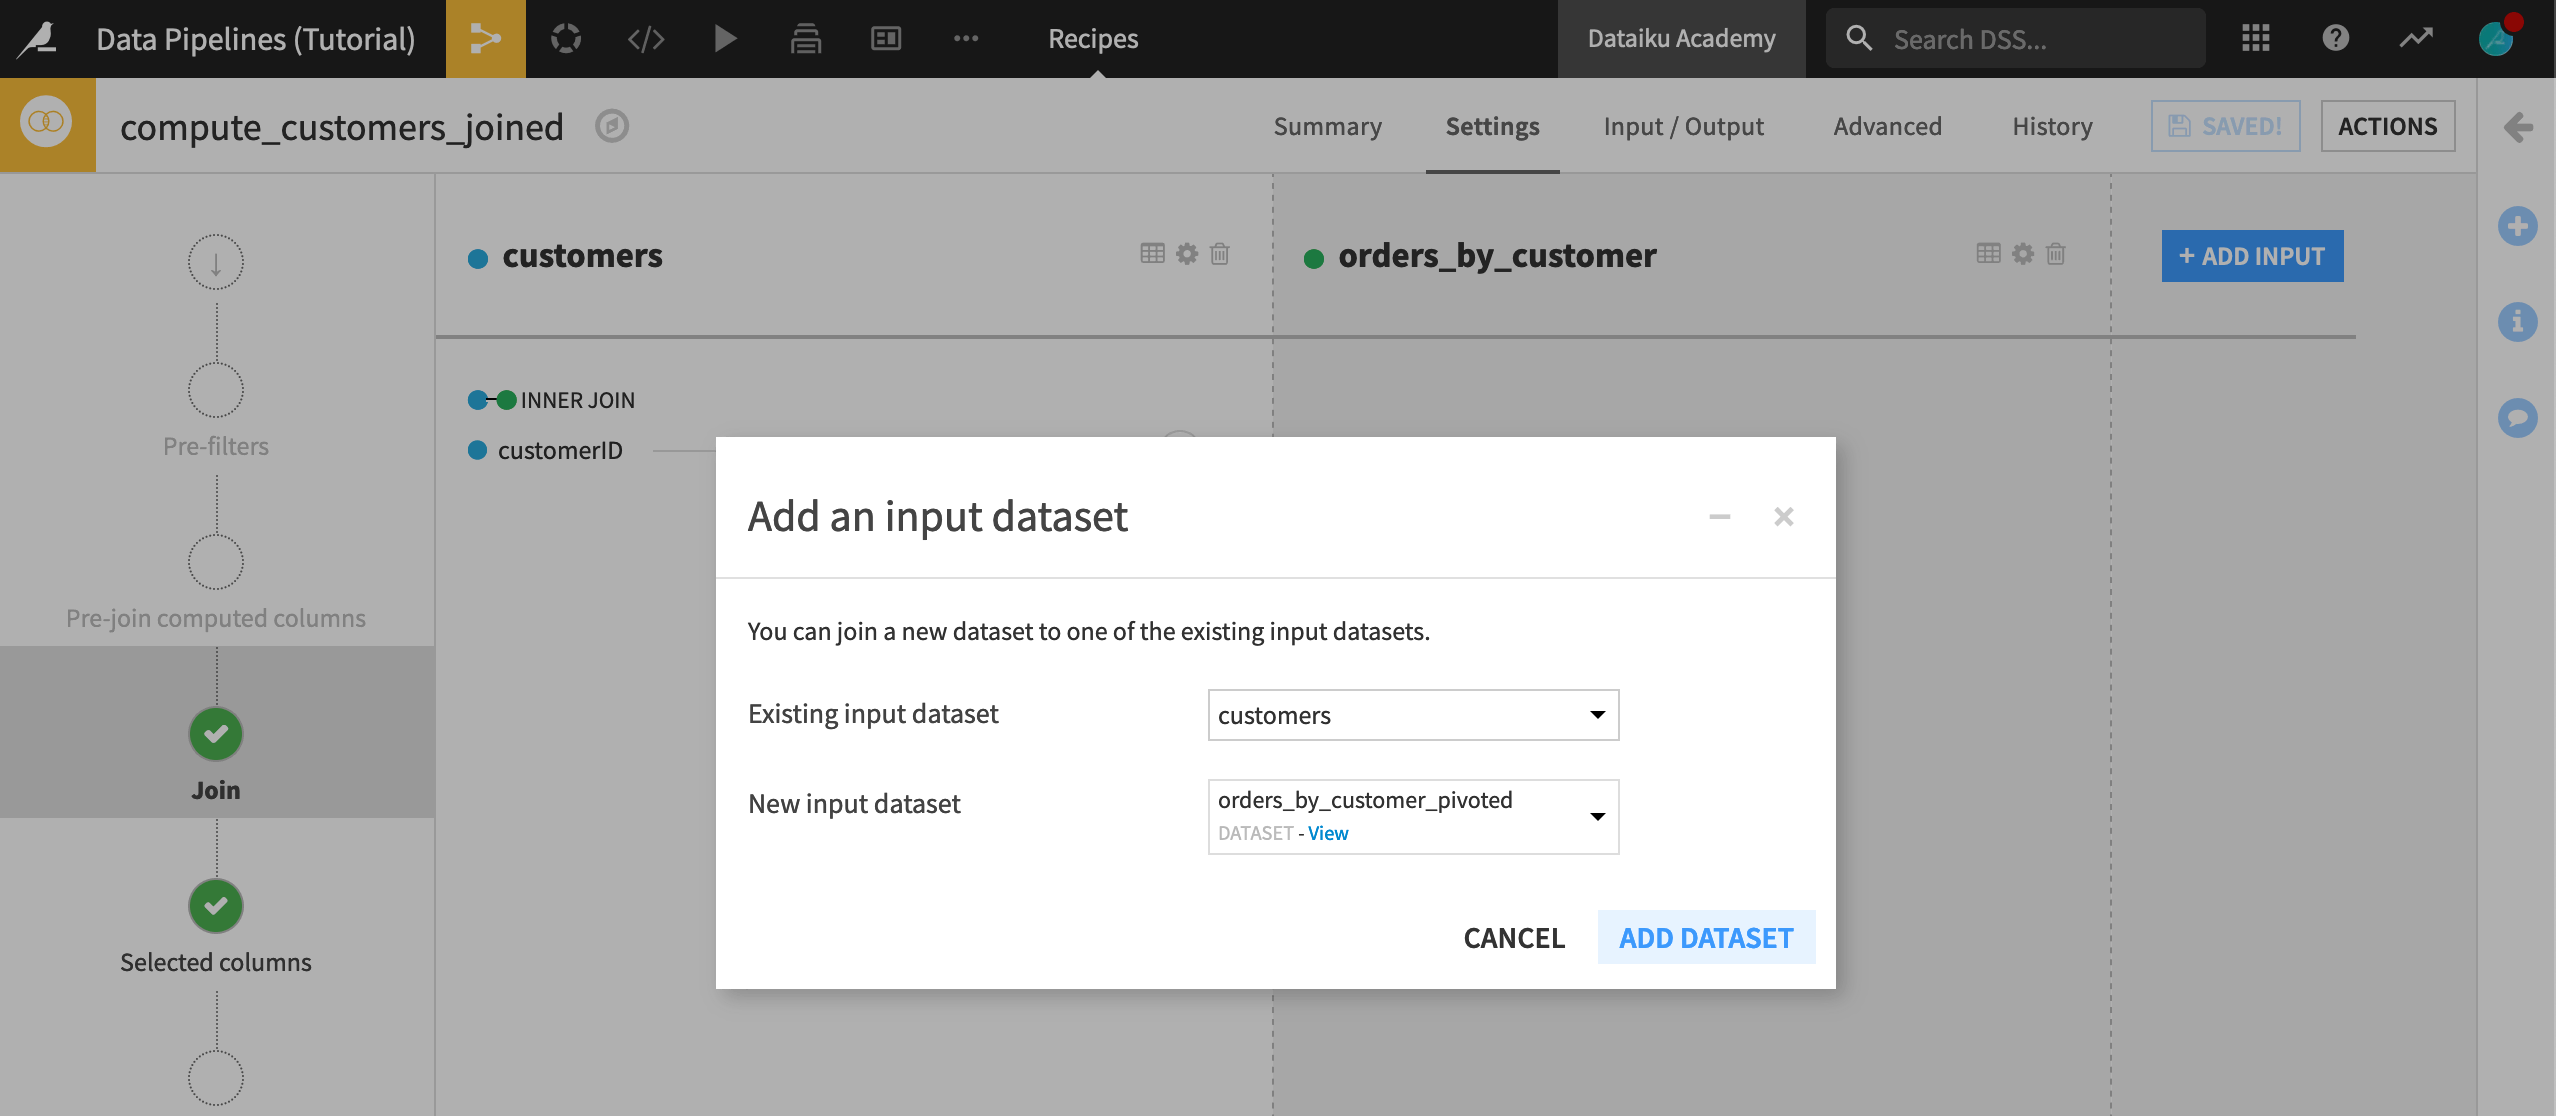
Click +Add Input.
Select orders_by_customer_pivoted as the new input dataset, and click Add Dataset.
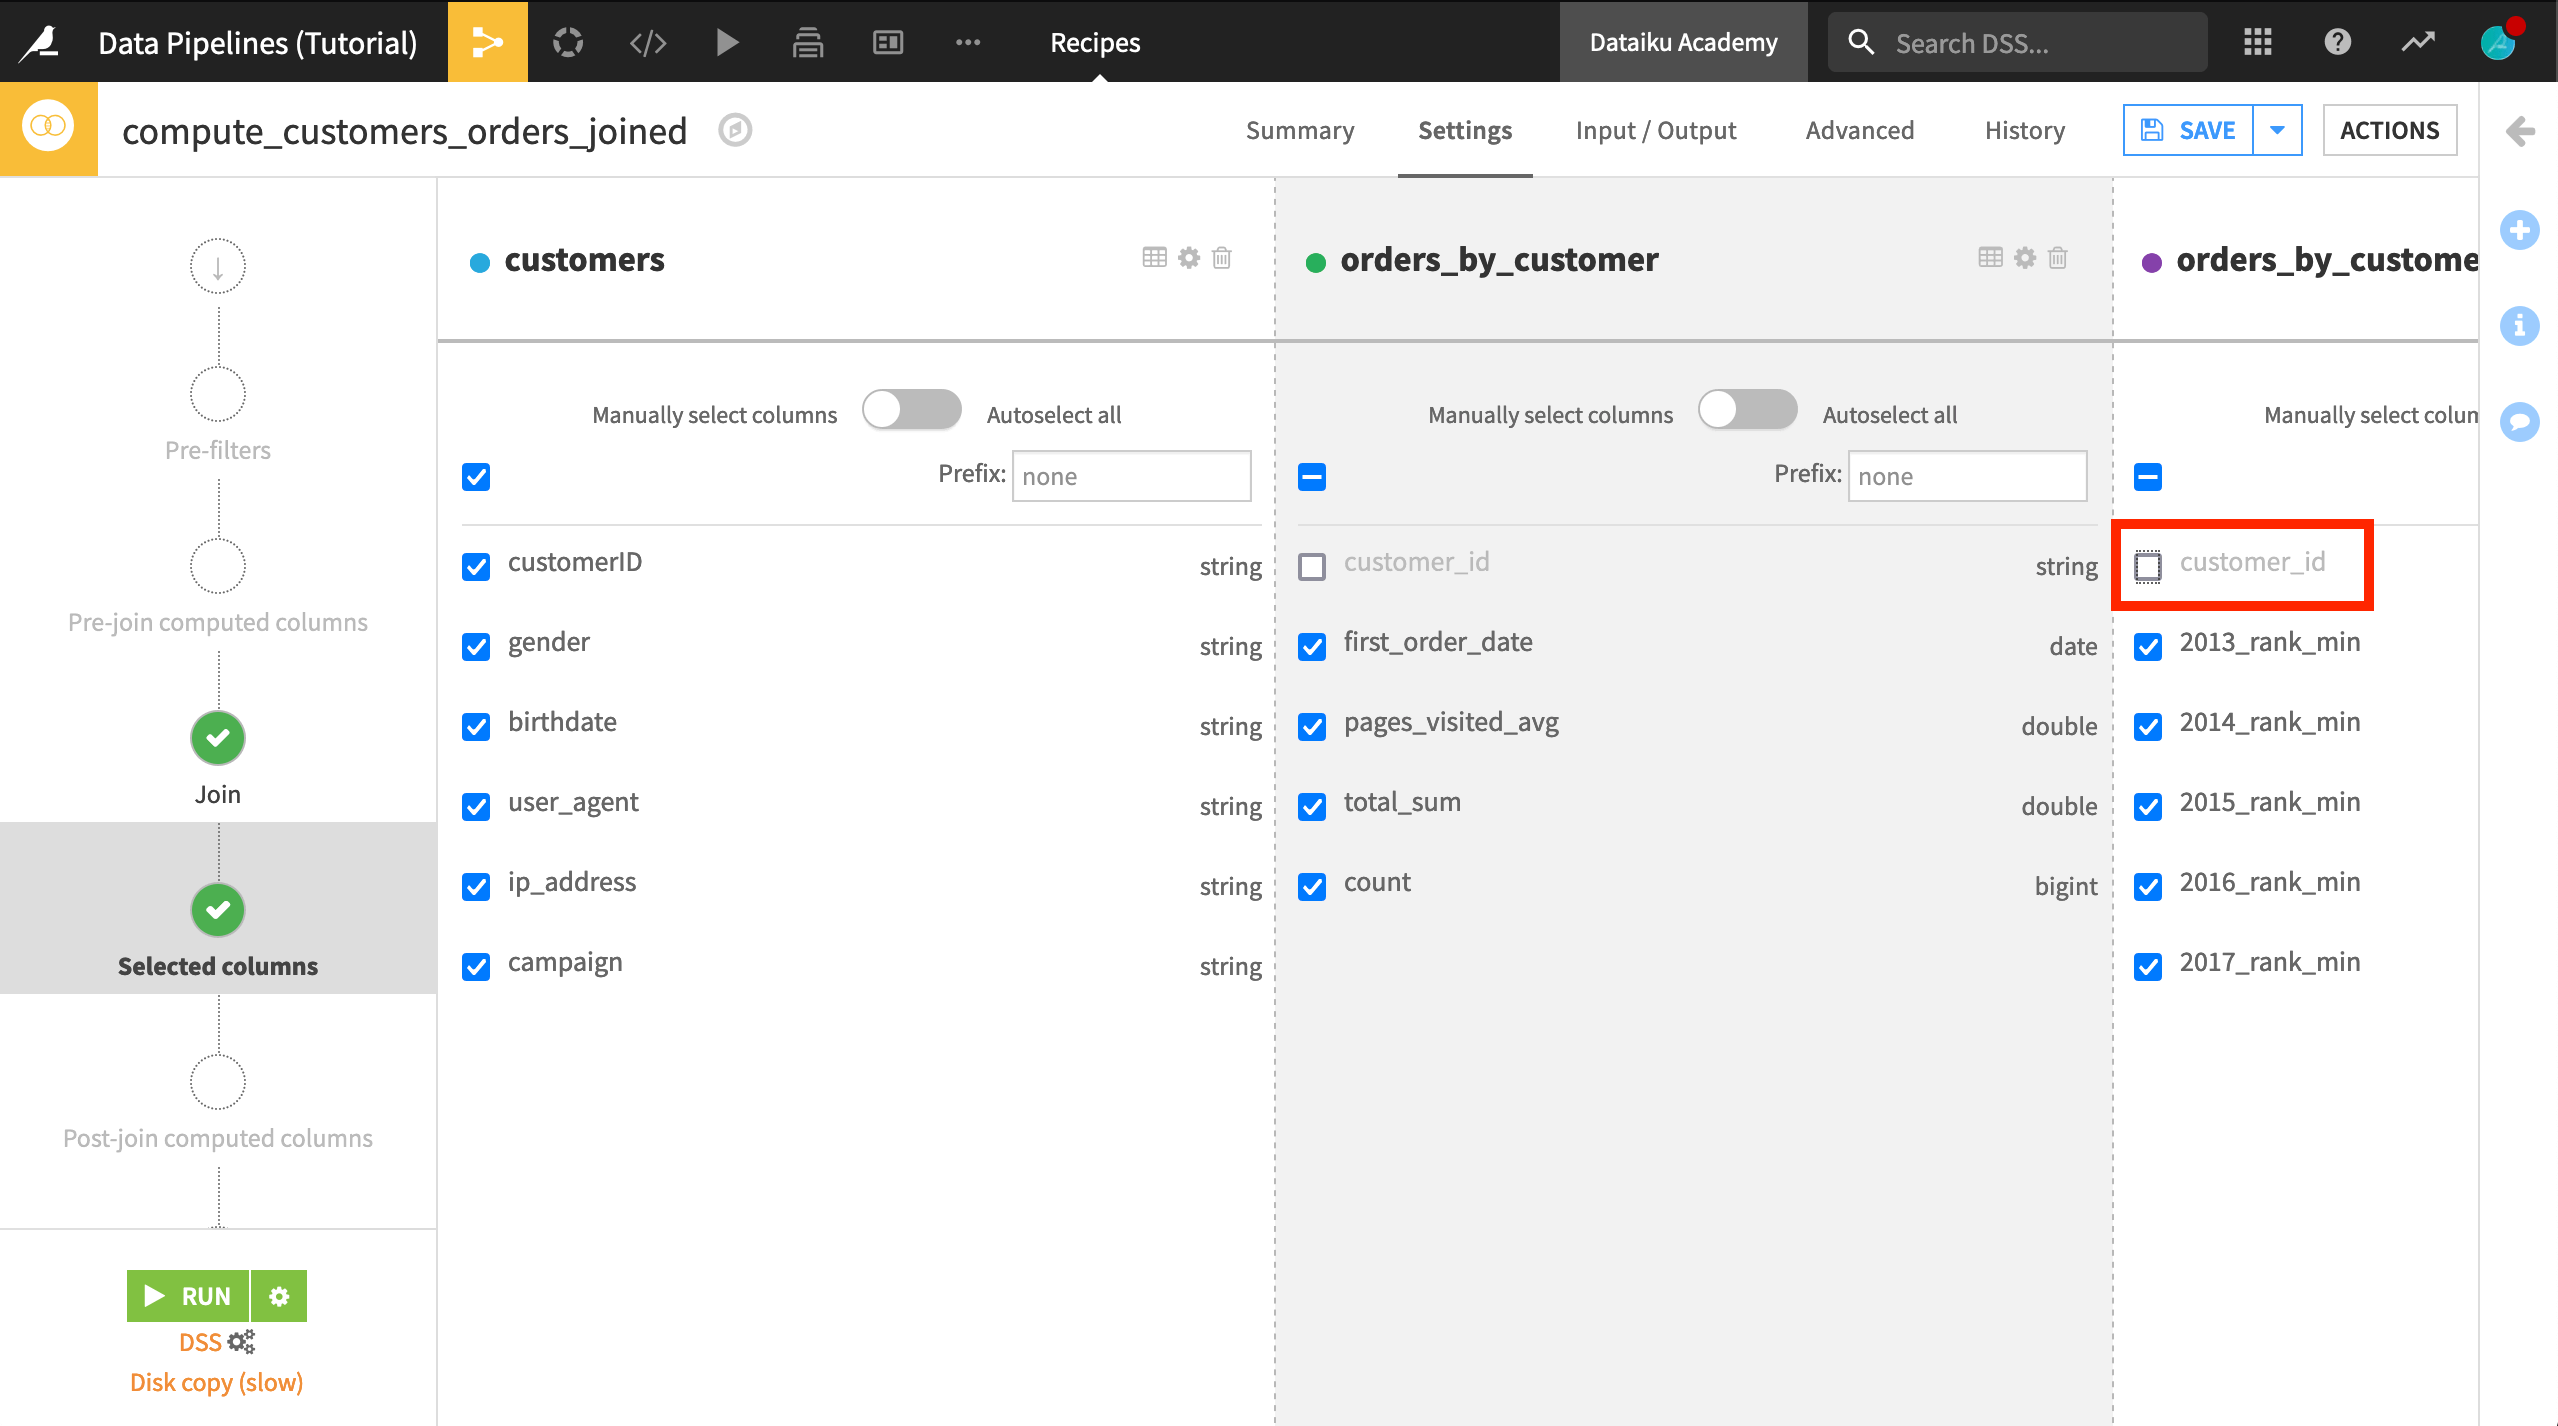
Dataiku should automatically detect customerID and customer_id as the correct join keys. There’s no need to change the join type from left join at this point.
On the “Selected columns” step, deselect customer_id from the orders_by_customer_pivoted list.
Click Save, and accept the schema changes.
Propagate Schema Changes
On the previous step, we updated the schema of the customers_orders_joined dataset. Although unbuilt, we can see the new columns added from the Pivot output in the Schema menu of the sidebar.
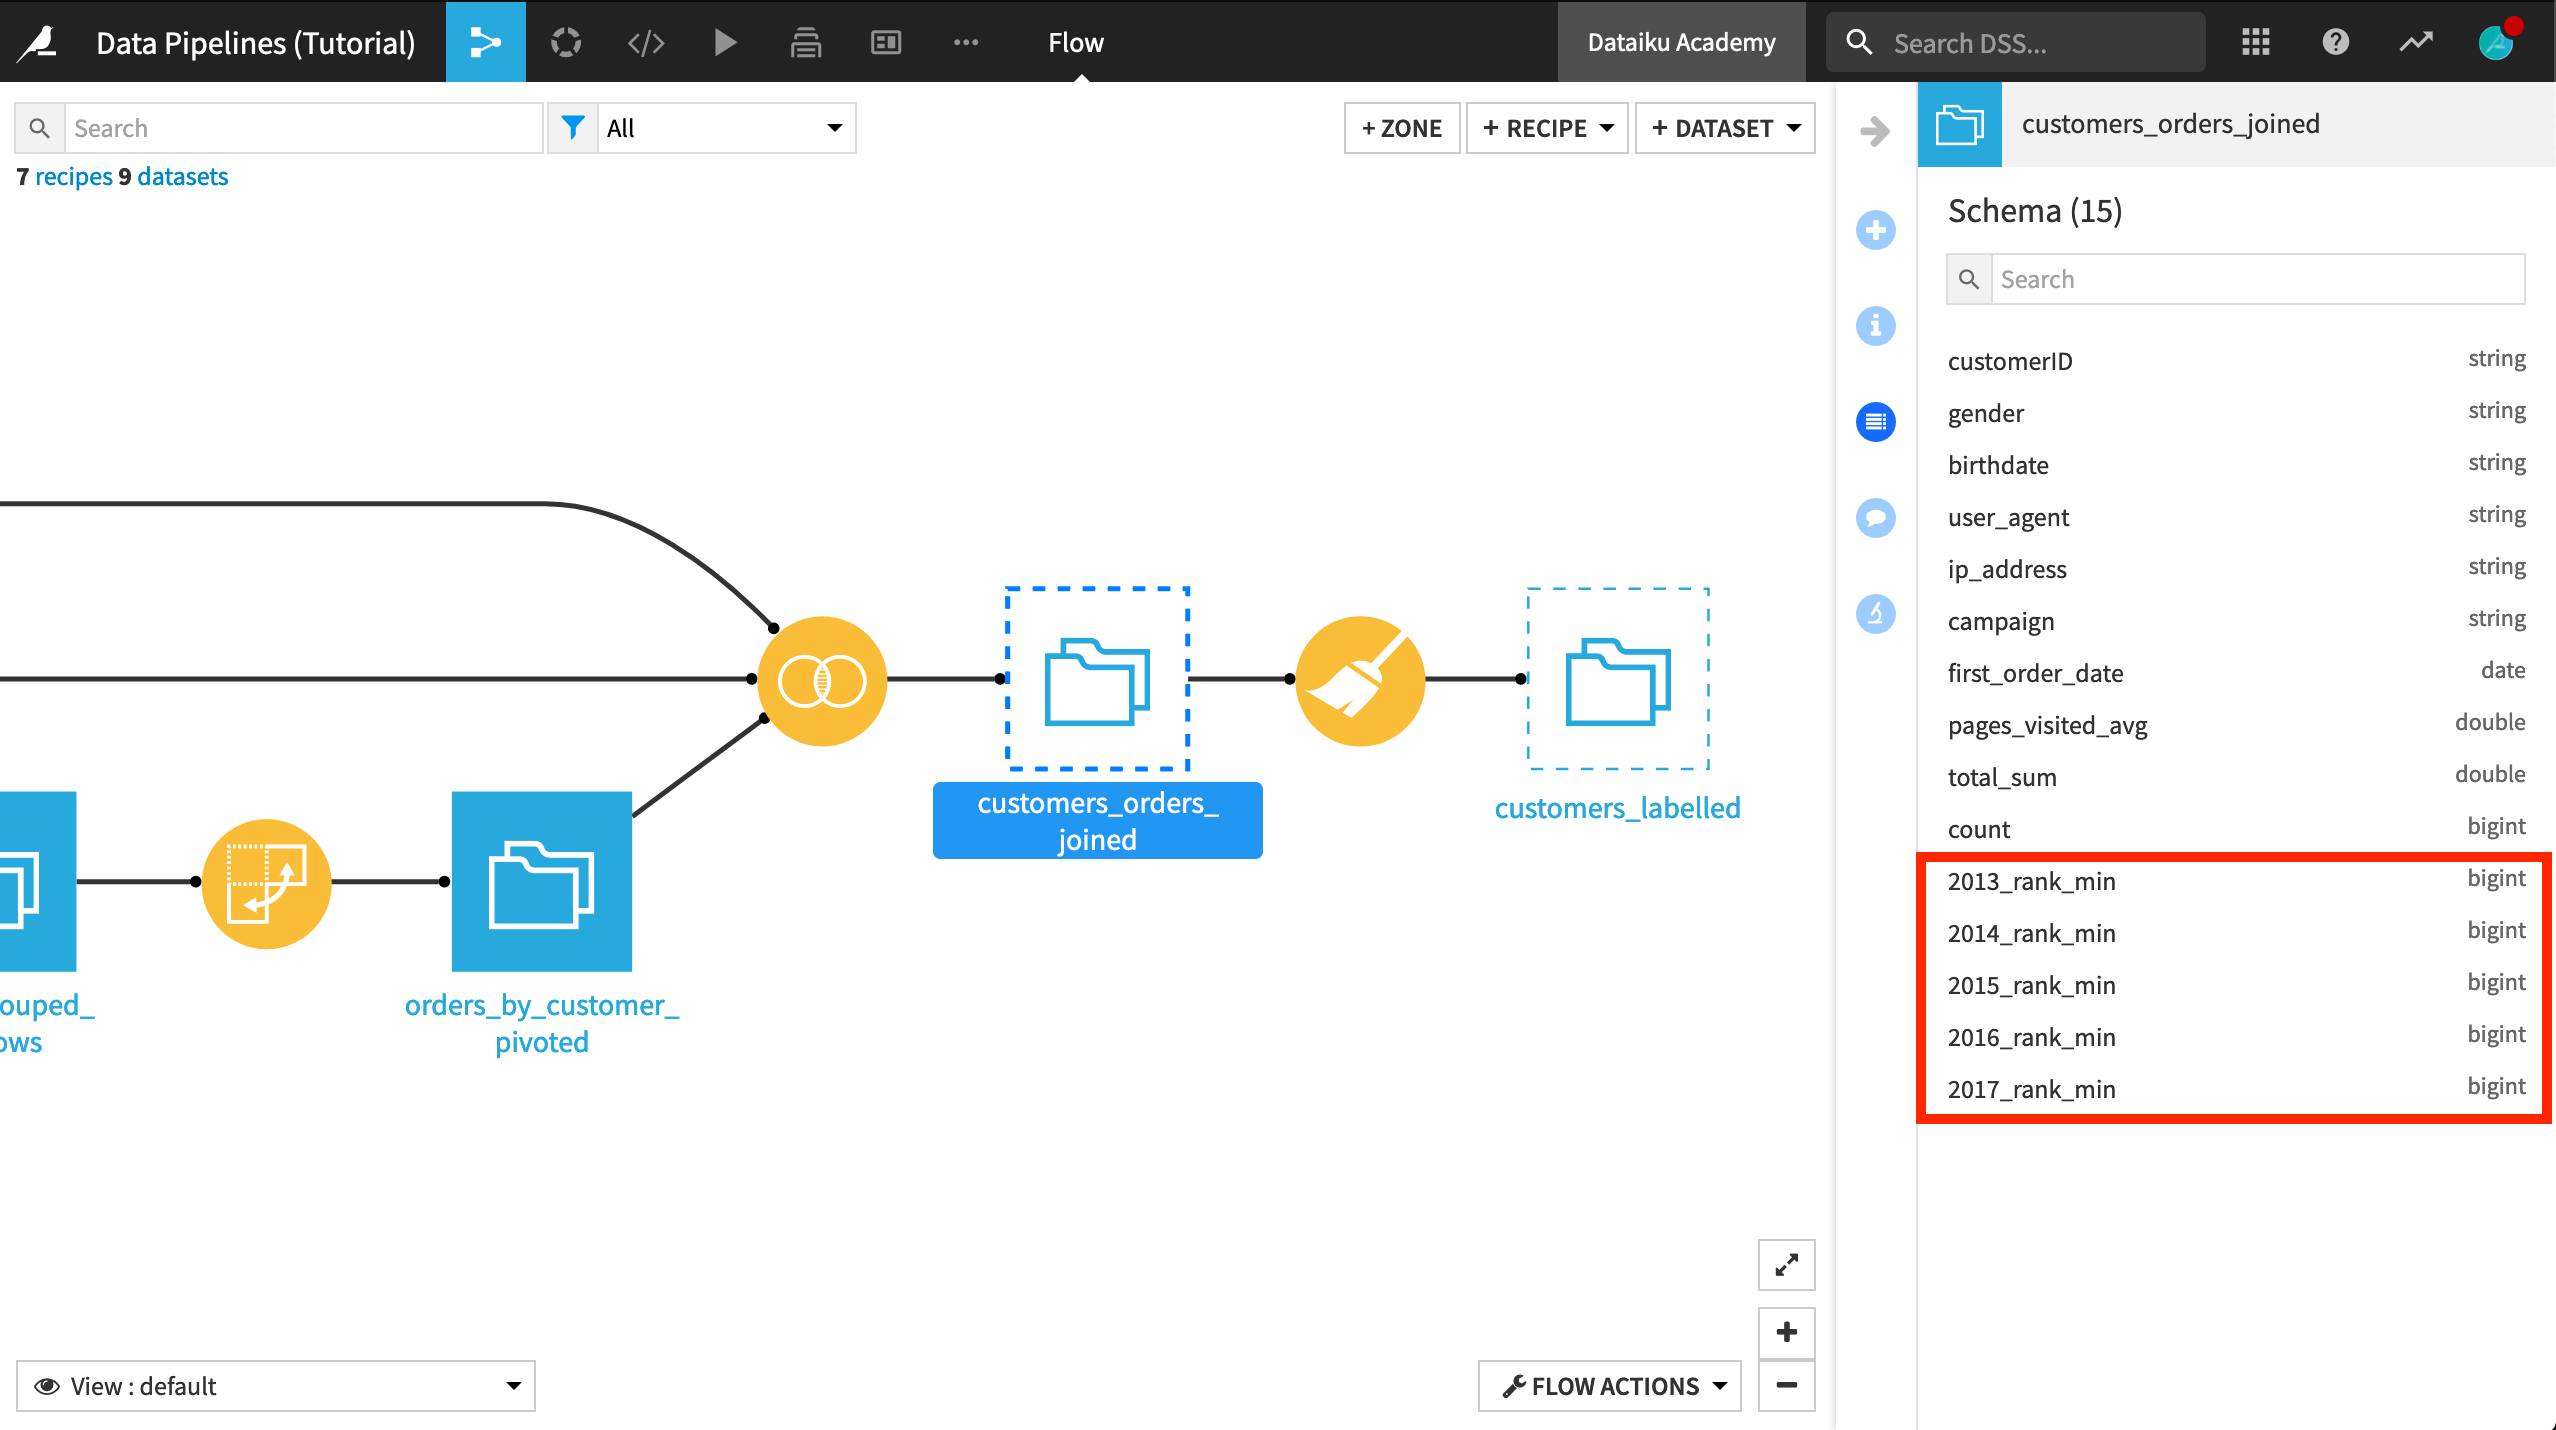
The schema of customers_labelled, however, remains unchanged. Can we fix it by rebuilding the dataset? Maybe a forced recursive rebuild will do the trick? Although it won’t succeed, let’s try this.
From the Flow, right click on the customers_labelled dataset.
Click on Build… > Recursive > Forced recursive rebuild (Smart reconstruction has the same outcome in this case).
The dataset will build successfully, but the new columns are still missing. Separate from building the dataset, we need to propagate schema changes downstream.
We could of course open the Prepare recipe and run it (accepting the schema change when prompted), but an alternative for larger flows is to use the schema propagation tool.
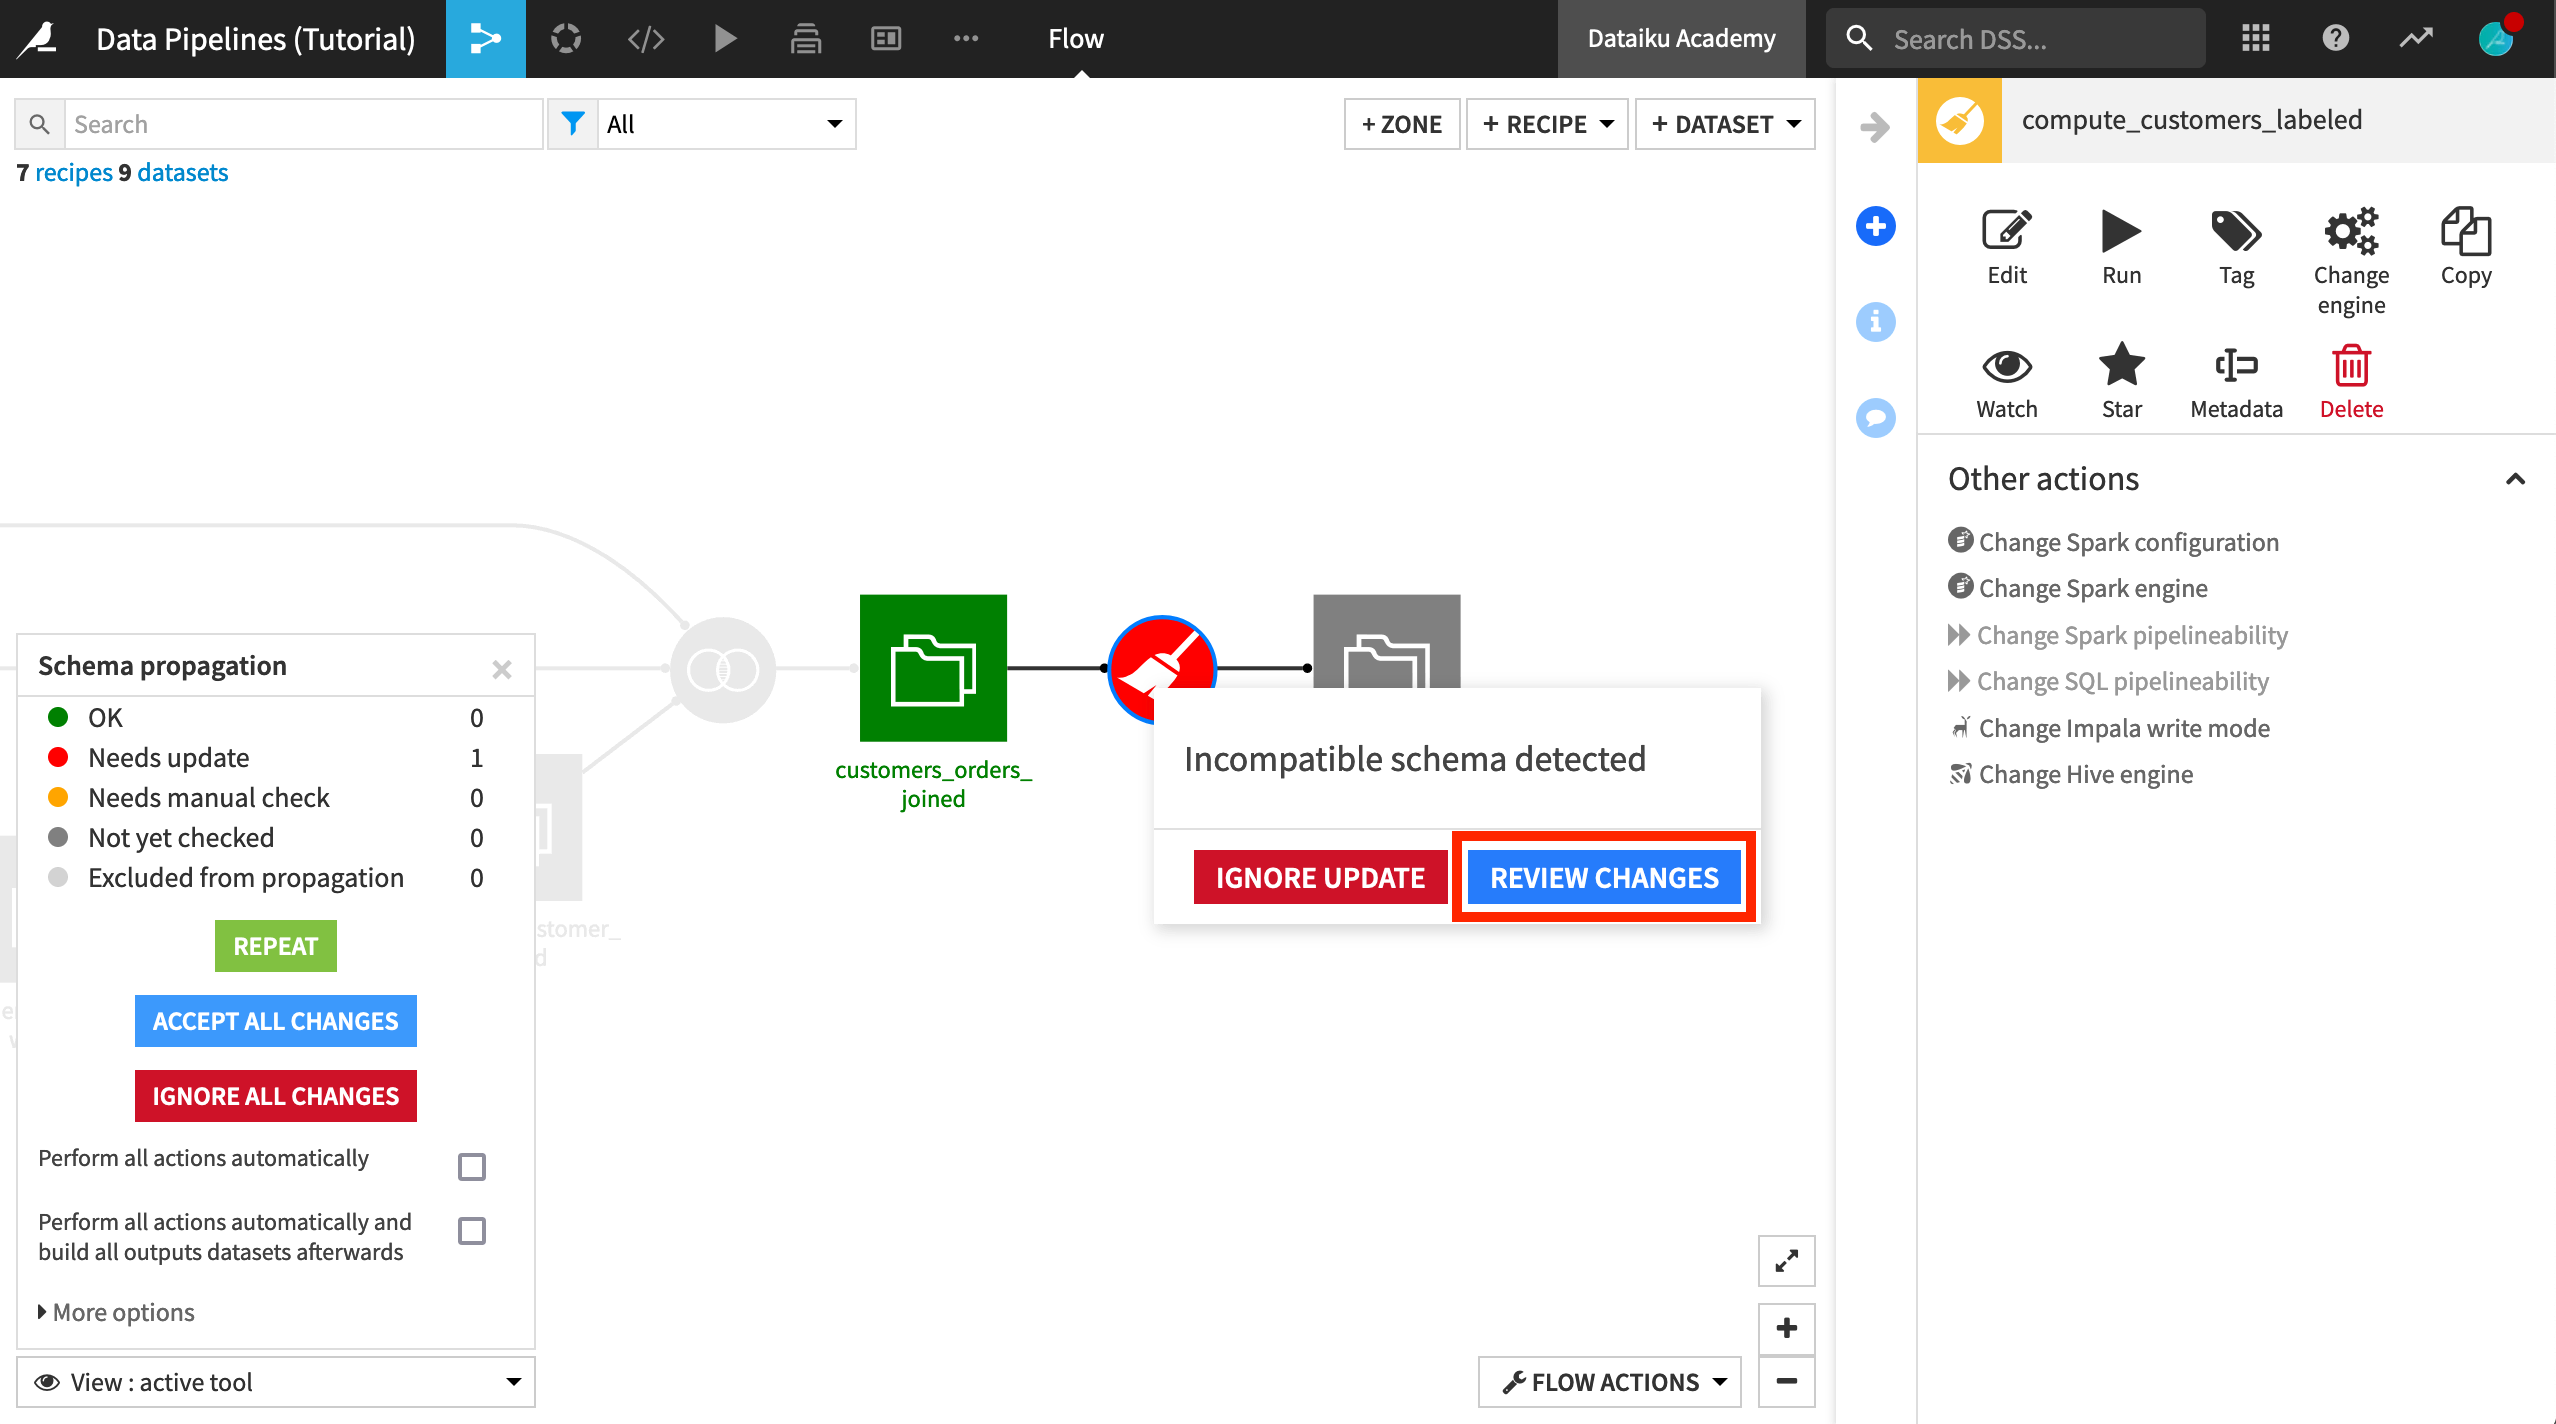
Right-click on customers_orders_joined, and select Propagate schema across Flow from here.
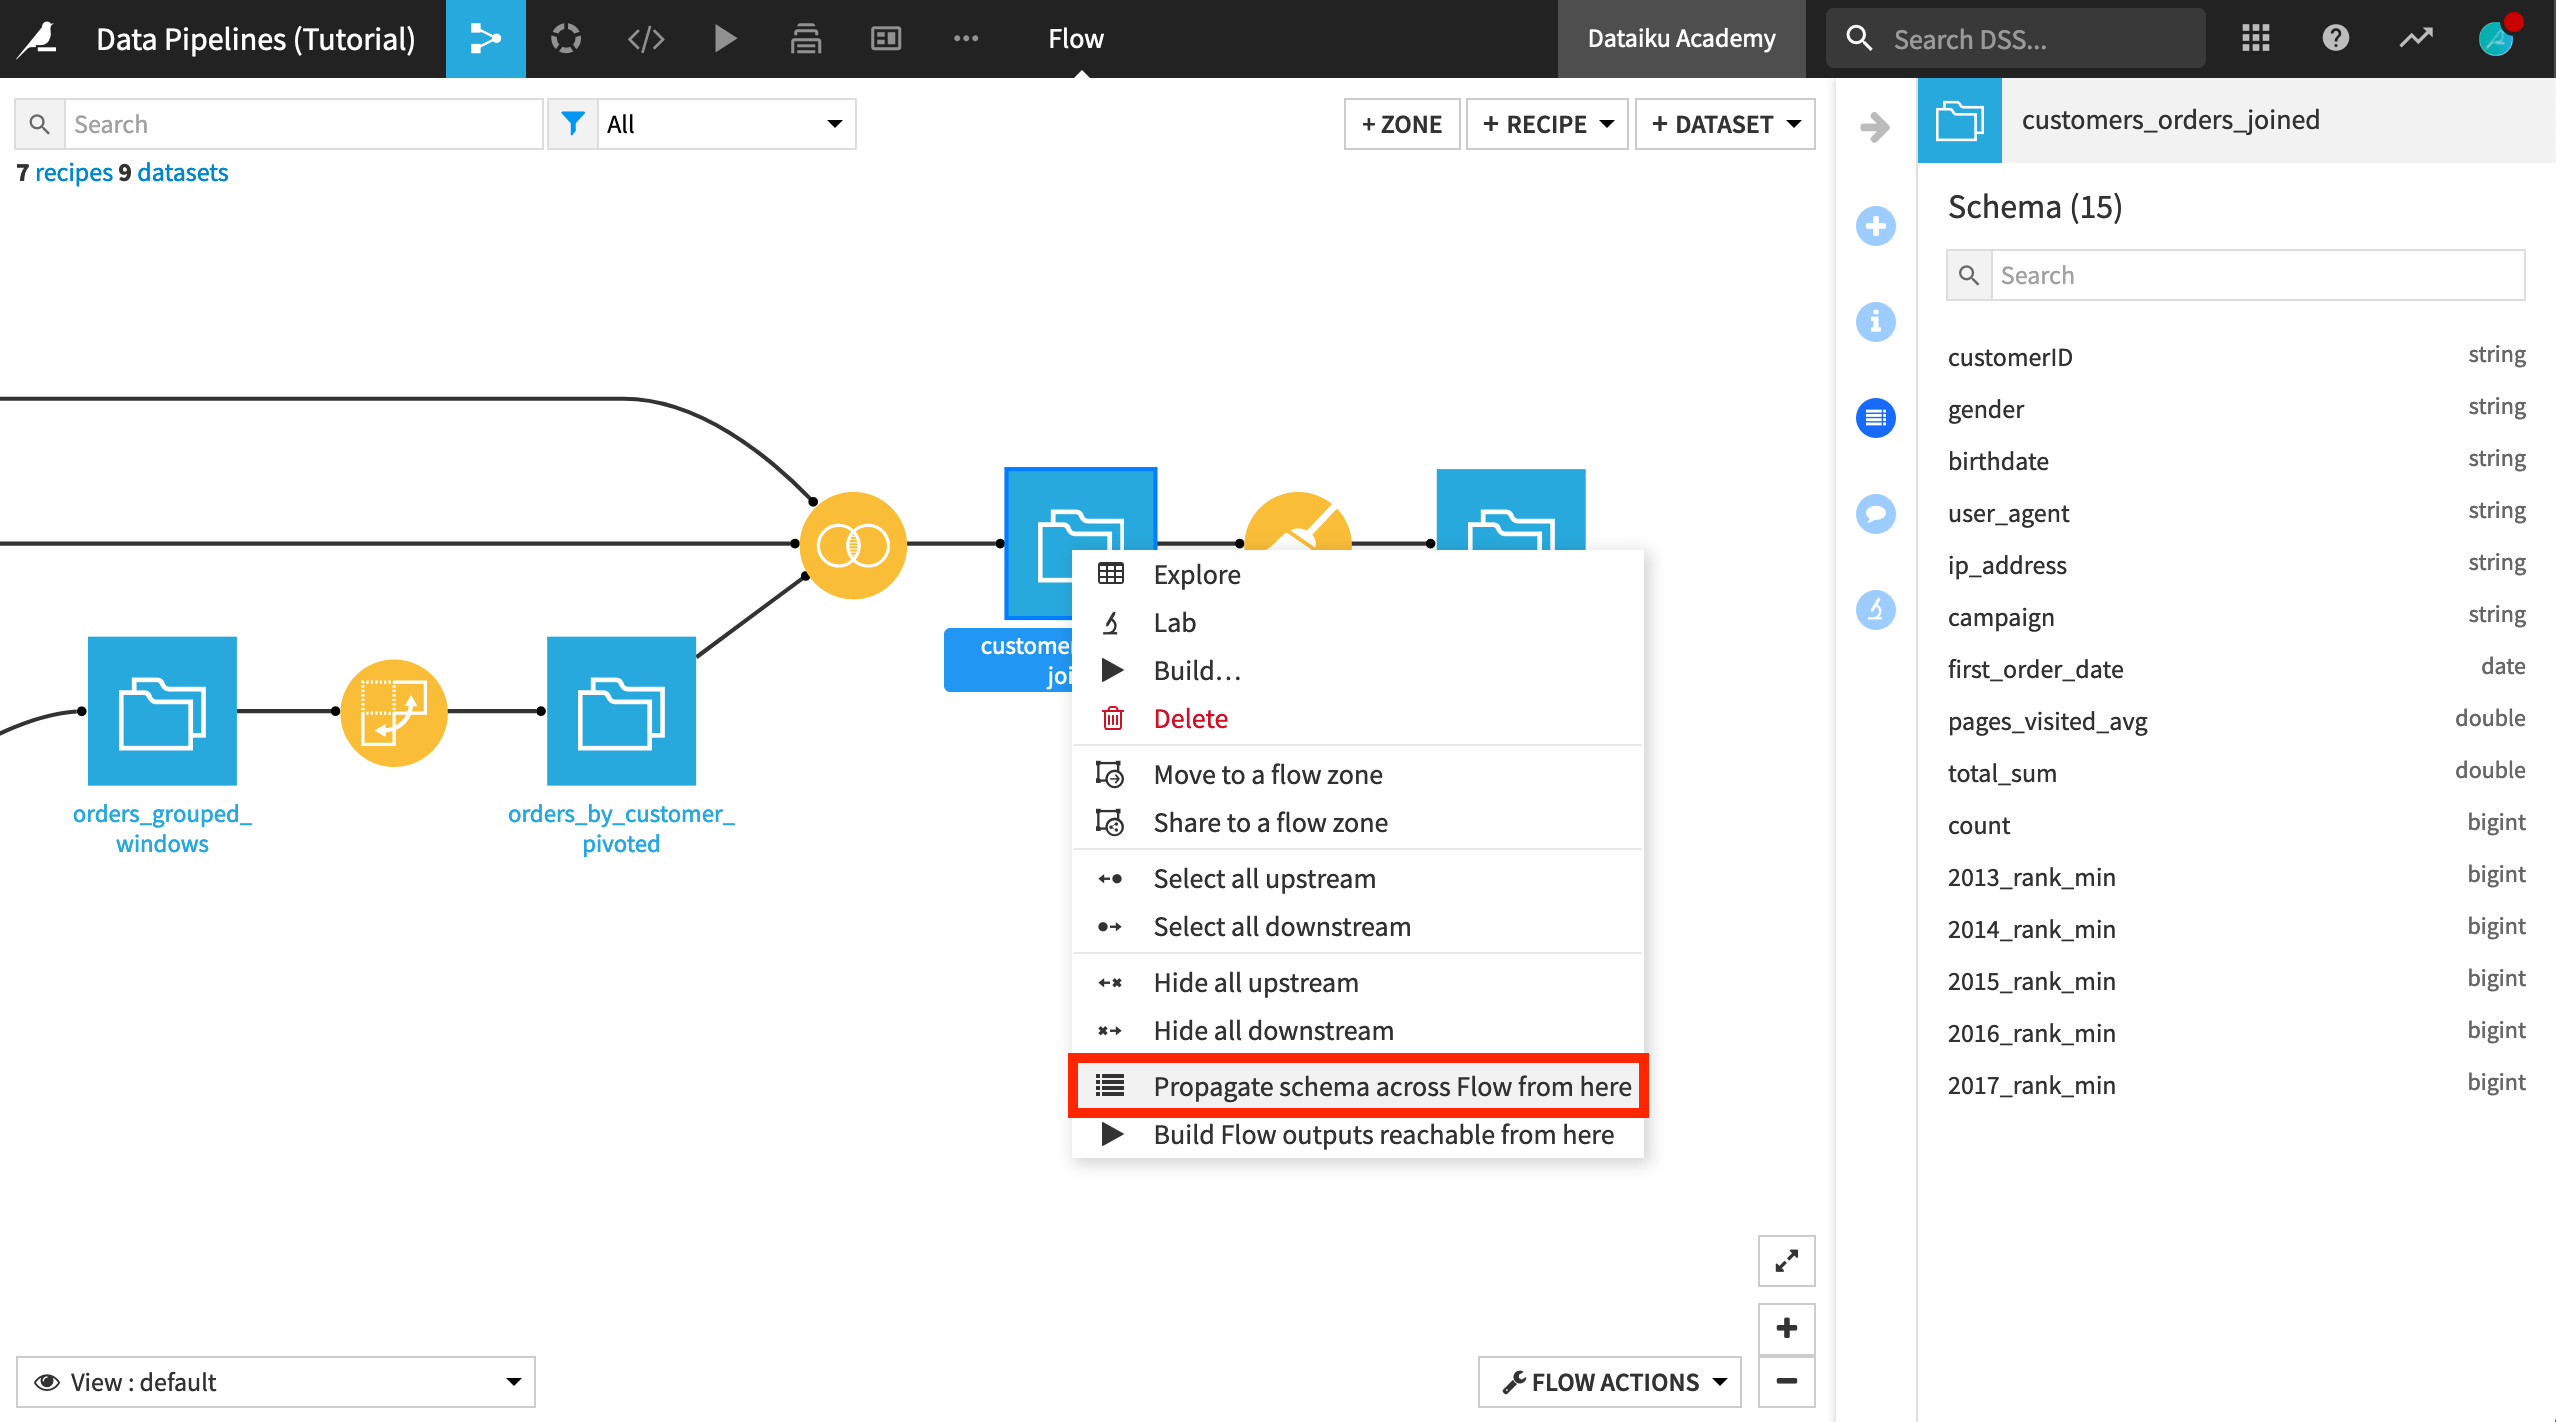
This opens the Schema propagation dialog in the lower left corner of the Flow.
Click Start. The tool determines that the schema for customers_labelled is incompatible.
Click on the Prepare recipe (now colored red), and select Review Changes.
Then click Update Schema to add the five new columns from the Pivot recipe to the output schema.
You can close the schema propagation tool.
Rebuild the Final Dataset
We’re almost there! The new columns have now been added to the schema customers_labelled, but the dataset itself has been dropped and needs to be recreated.
We could rebuild the final output dataset in many different ways, but let’s demonstrate doing so through the Flow Actions menu.
From the Flow Actions menu in the bottom right corner of the screen, choose Build all.
Because the project has a single branch, customers_labelled is the only dataset shown.
Before building, click Preview to compute job dependencies. Because all of the upstream datasets are up to date, this job has just one activity– running the Prepare recipe.
Click Run.
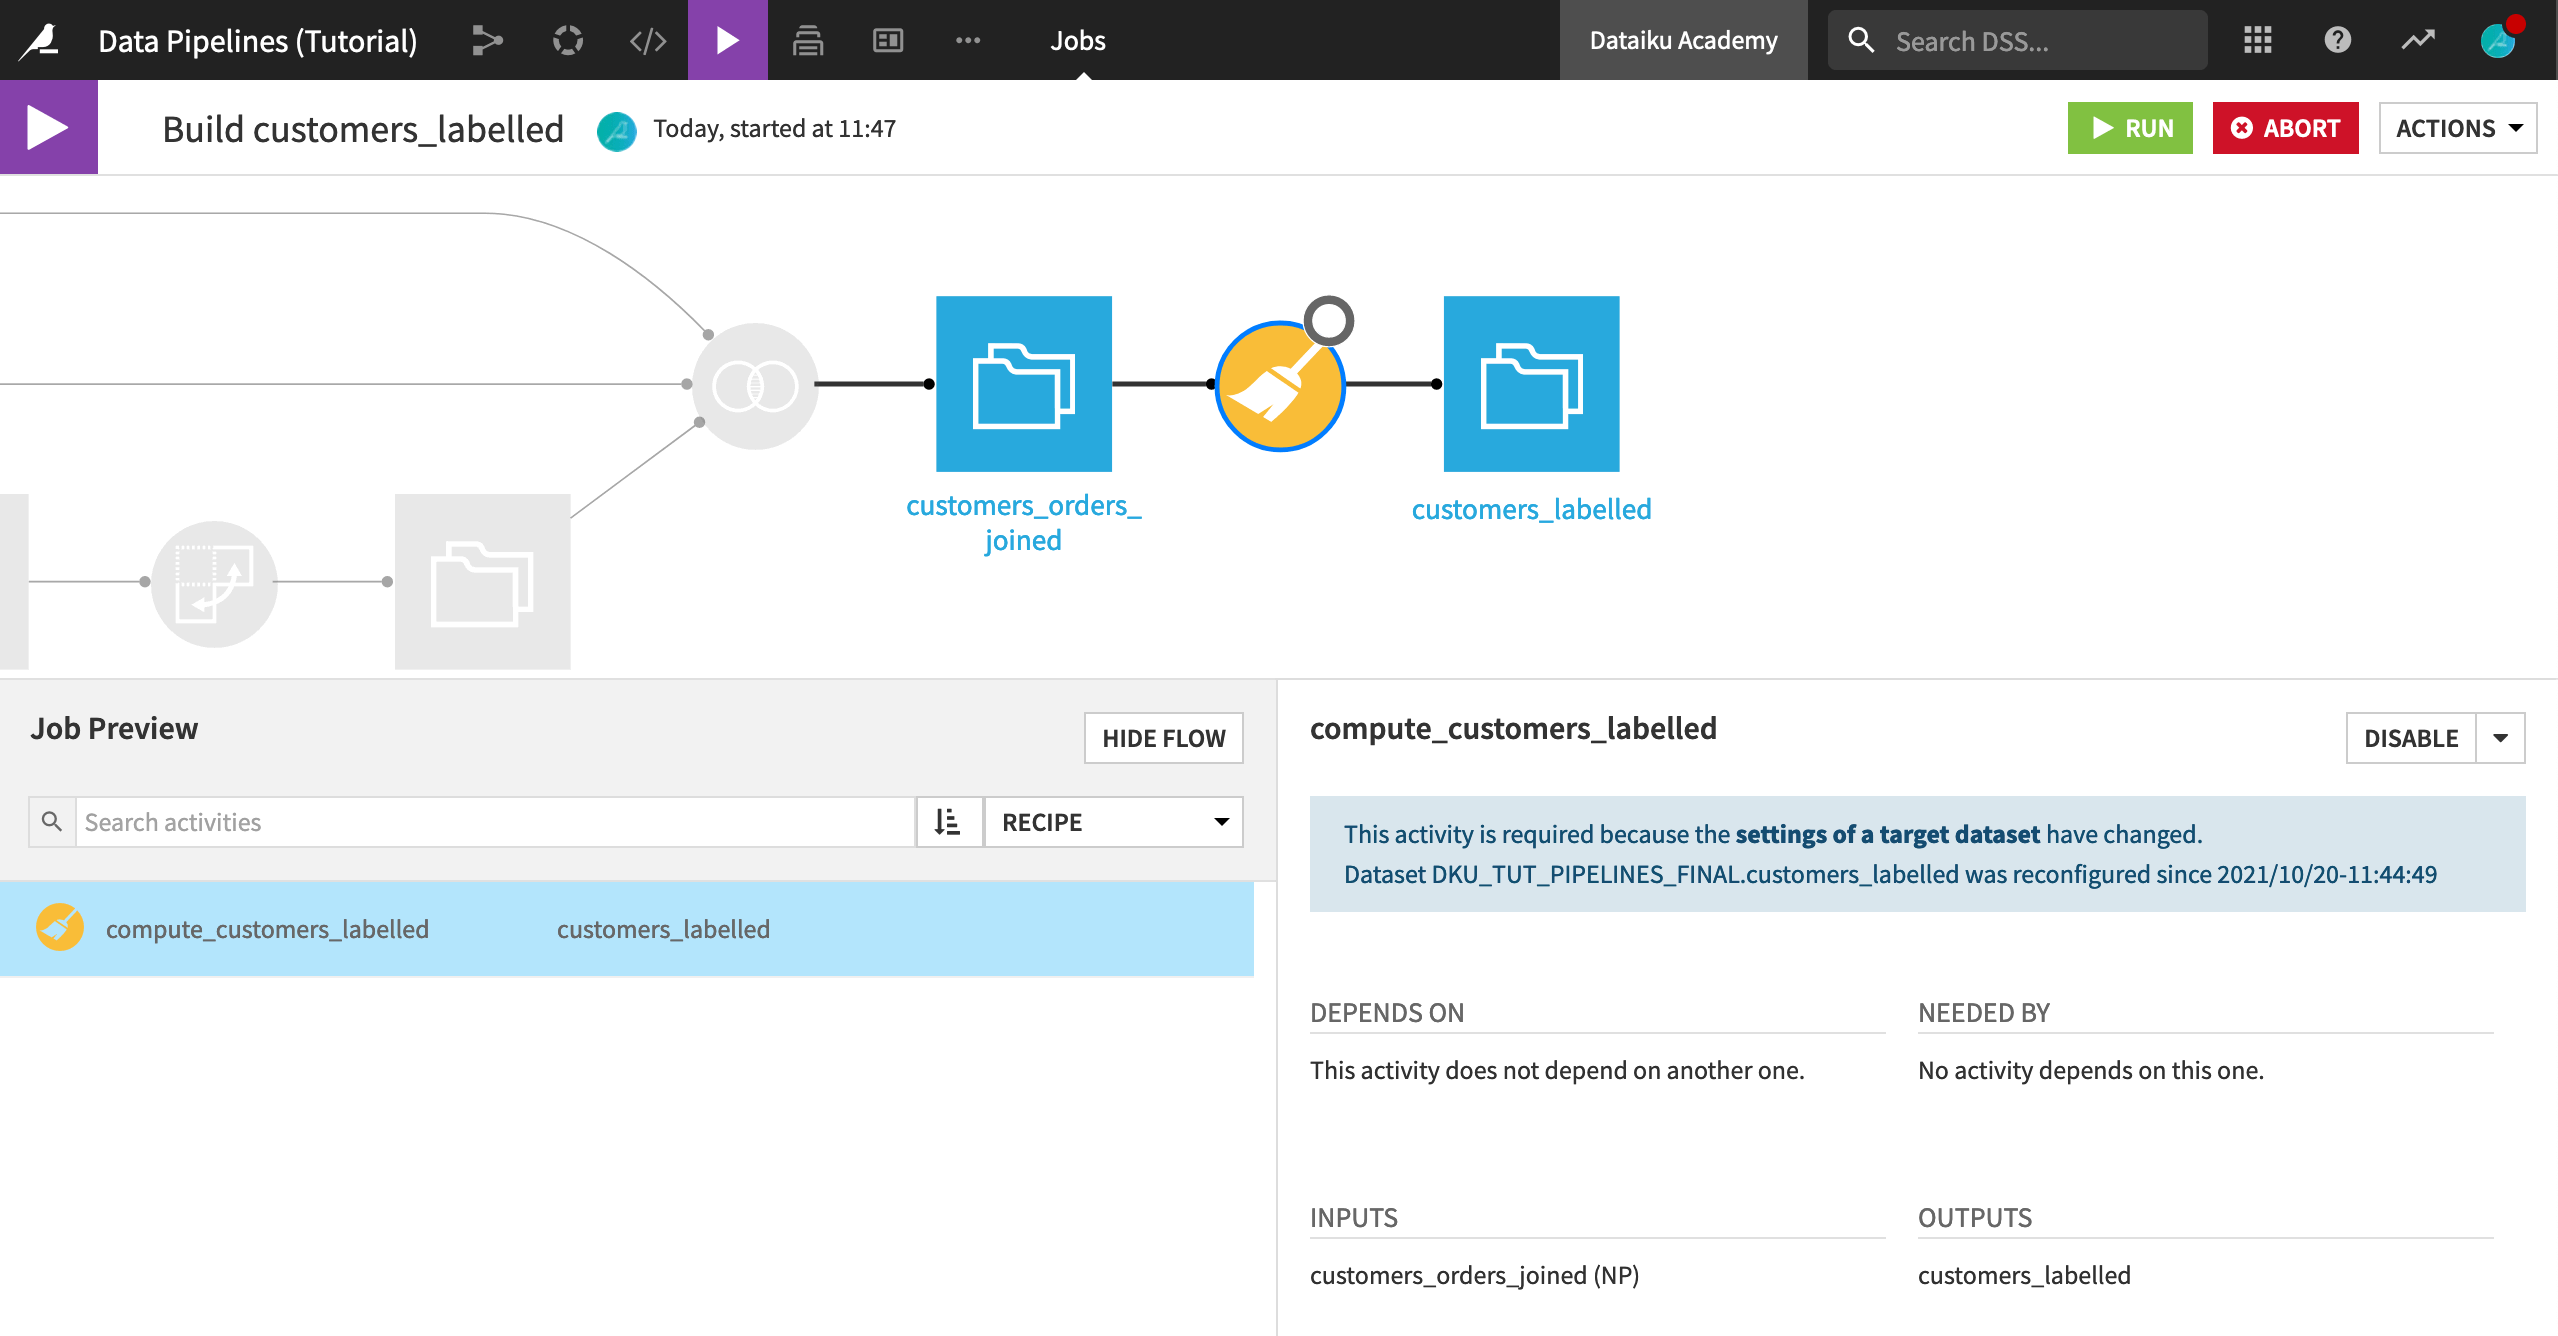
The final dataset in the Flow now contains the pivoted columns and is ready for sharing and further analysis.
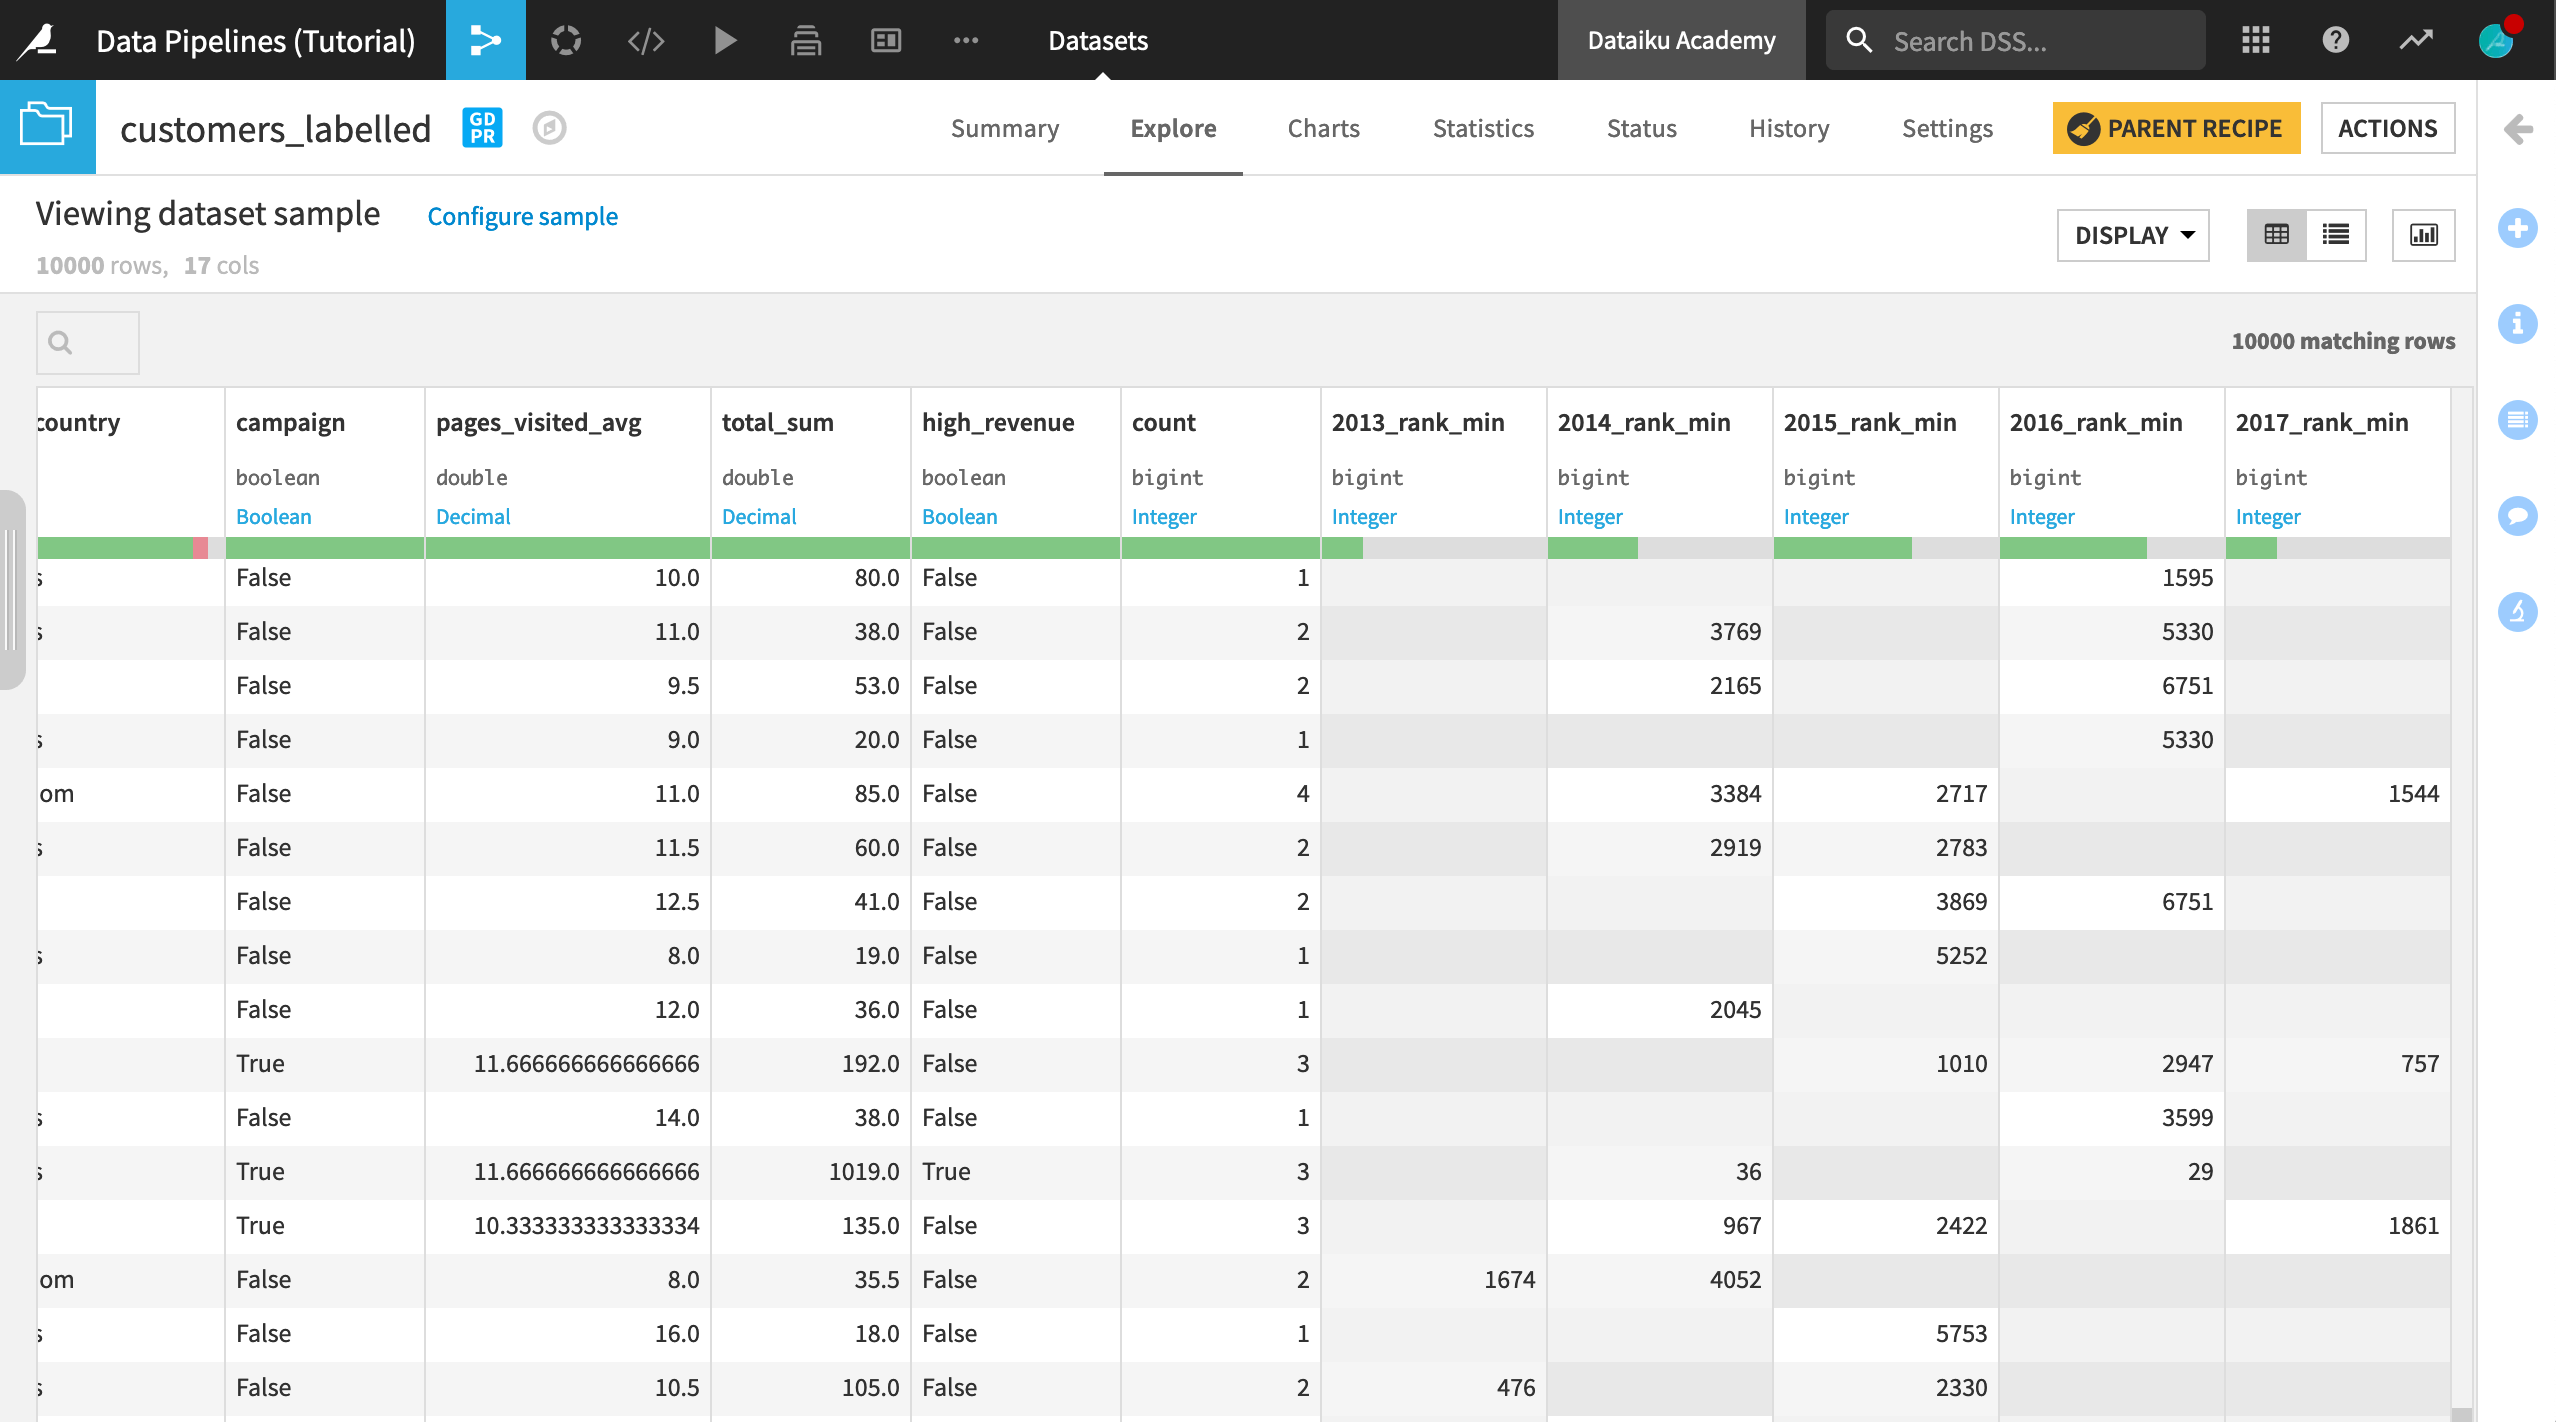
At this point, the dataset produces more questions than it answers. For example, applying a descending sort to a column like 2017_rank_min sparks a few interesting avenues for further exploration. Do the largest customers in 2017 tend to be the top customers in previous years? Or is there considerable variation among top customers year to year? Moreover, in 2017, certain ranks, like 4 and 10, are noticeably absent. We may wish to revisit the previous join conditions if important data is missing.
What’s Next?
The product documentation has more details on options for rebuilding datasets.
It also covers more of the technical details on handling of schemas by recipe.
You’ll have a chance to work more with these concepts in the Flow Views & Actions course of the Advanced Designer Learning Path.