Concept: The Lab
Tip
This content is also included in the free Dataiku Academy course, Basics 103, which is part of the Core Designer learning path. Register for the course there if you’d like to track and validate your progress alongside concept videos, summaries, hands-on tutorials, and quizzes.
In other lessons, you have seen how you can use recipes in the Flow to clean and wrangle data.
Building recipes directly in the Flow, however, is often less ideal once you have a workflow in production that should not be disturbed.
Note
If the Flow is optimized for production, the Lab is the place in DSS optimized for experimentation and discovery.
Because preparing, visualizing, and modeling data is an iterative process, you need room to explore new ideas, and the ability to quickly discard them when they don’t pan out. This need is especially acute when an existing workflow is already in production, or when colleagues are simultaneously working alongside you, experimenting with their own ideas.
Keeping experimentation in the Lab helps avoid overcrowding the Flow with unnecessary items that will not be used in production.
In the Lab, you will find both visual and coding tools.
You can create a visual analysis for interactive data preparation, charts, and visual machine learning.
Or, open a code notebook in a variety of programming languages, such as Python, R, and SQL.
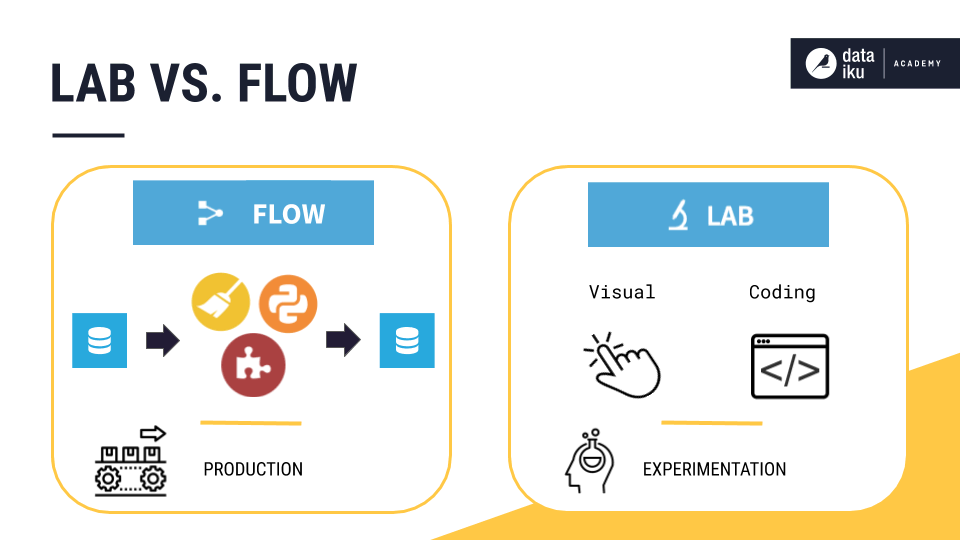
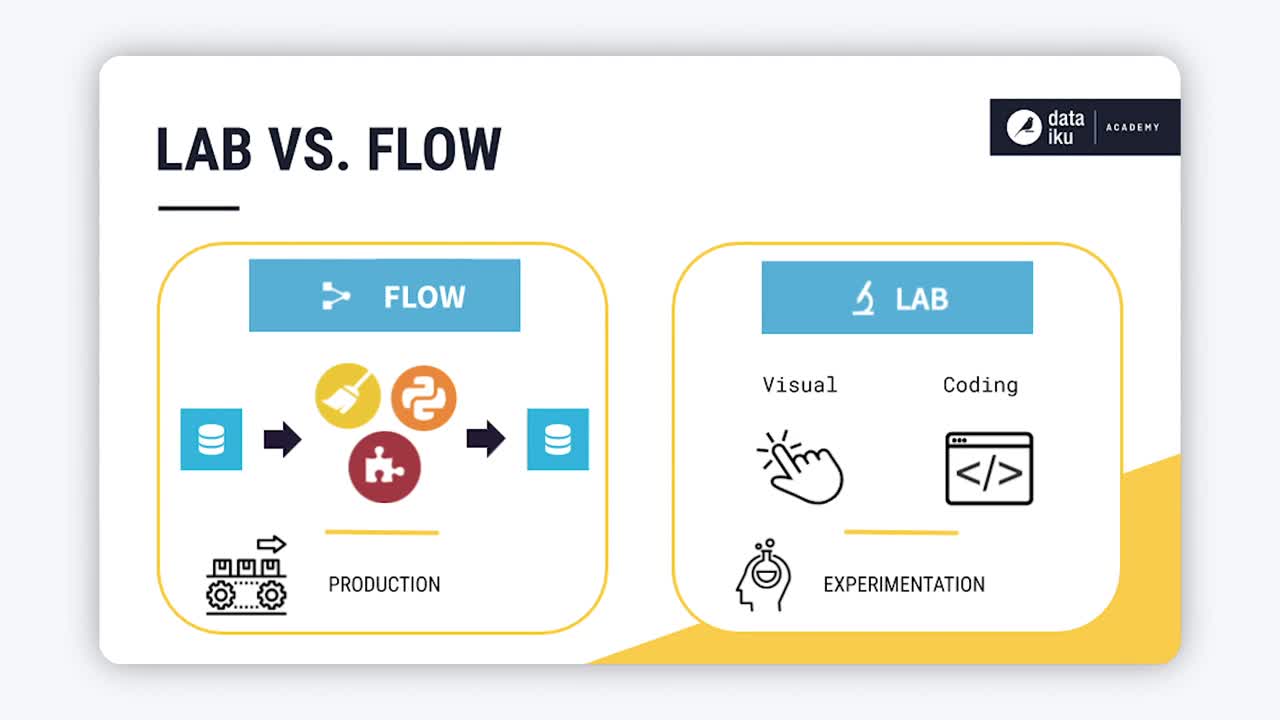
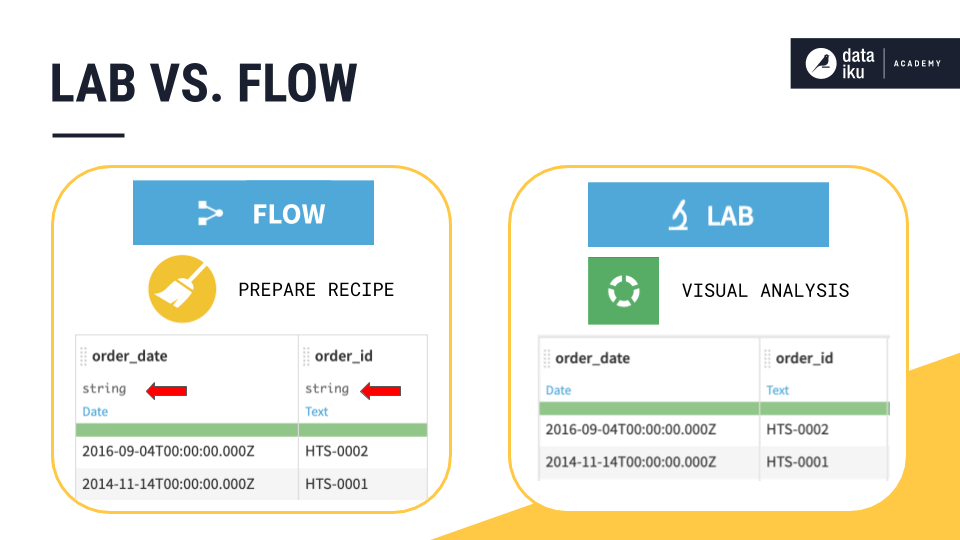
To recap the high-level difference between the Lab and the Flow, note:
Note
A lab environment is attached to a dataset in the Flow, allowing you to organize your draft and preliminary work easily without overcrowding the Flow with unnecessary items. The Flow is mostly meant to keep the work that is steady and will be reused in the future by you or your colleagues.
When working in the Lab, the original dataset is never modified, and no new dataset is created. Instead, you will be able to interactively visualize the results of the changes that you will be performing on the data (most of the time on a sample). The speed of this interactivity will provide you a comfortable space to quickly assess what your data contain.
Once you’re satisfied with your lab work, you can deploy it to the Flow as a visual or code recipe. The newly created recipe and the associated output dataset will be appended to the original dataset pipeline, thus, making all your lab work available for future data reconstruction or automation.
Visual Analysis
When you create a new visual analysis, you will find a script that appears very similar to a Prepare recipe with a few important differences.
Just as in the Prepare recipe, you can add steps from the processor library to prepare the data as needed, and receive immediate visual feedback on a sample of the dataset.
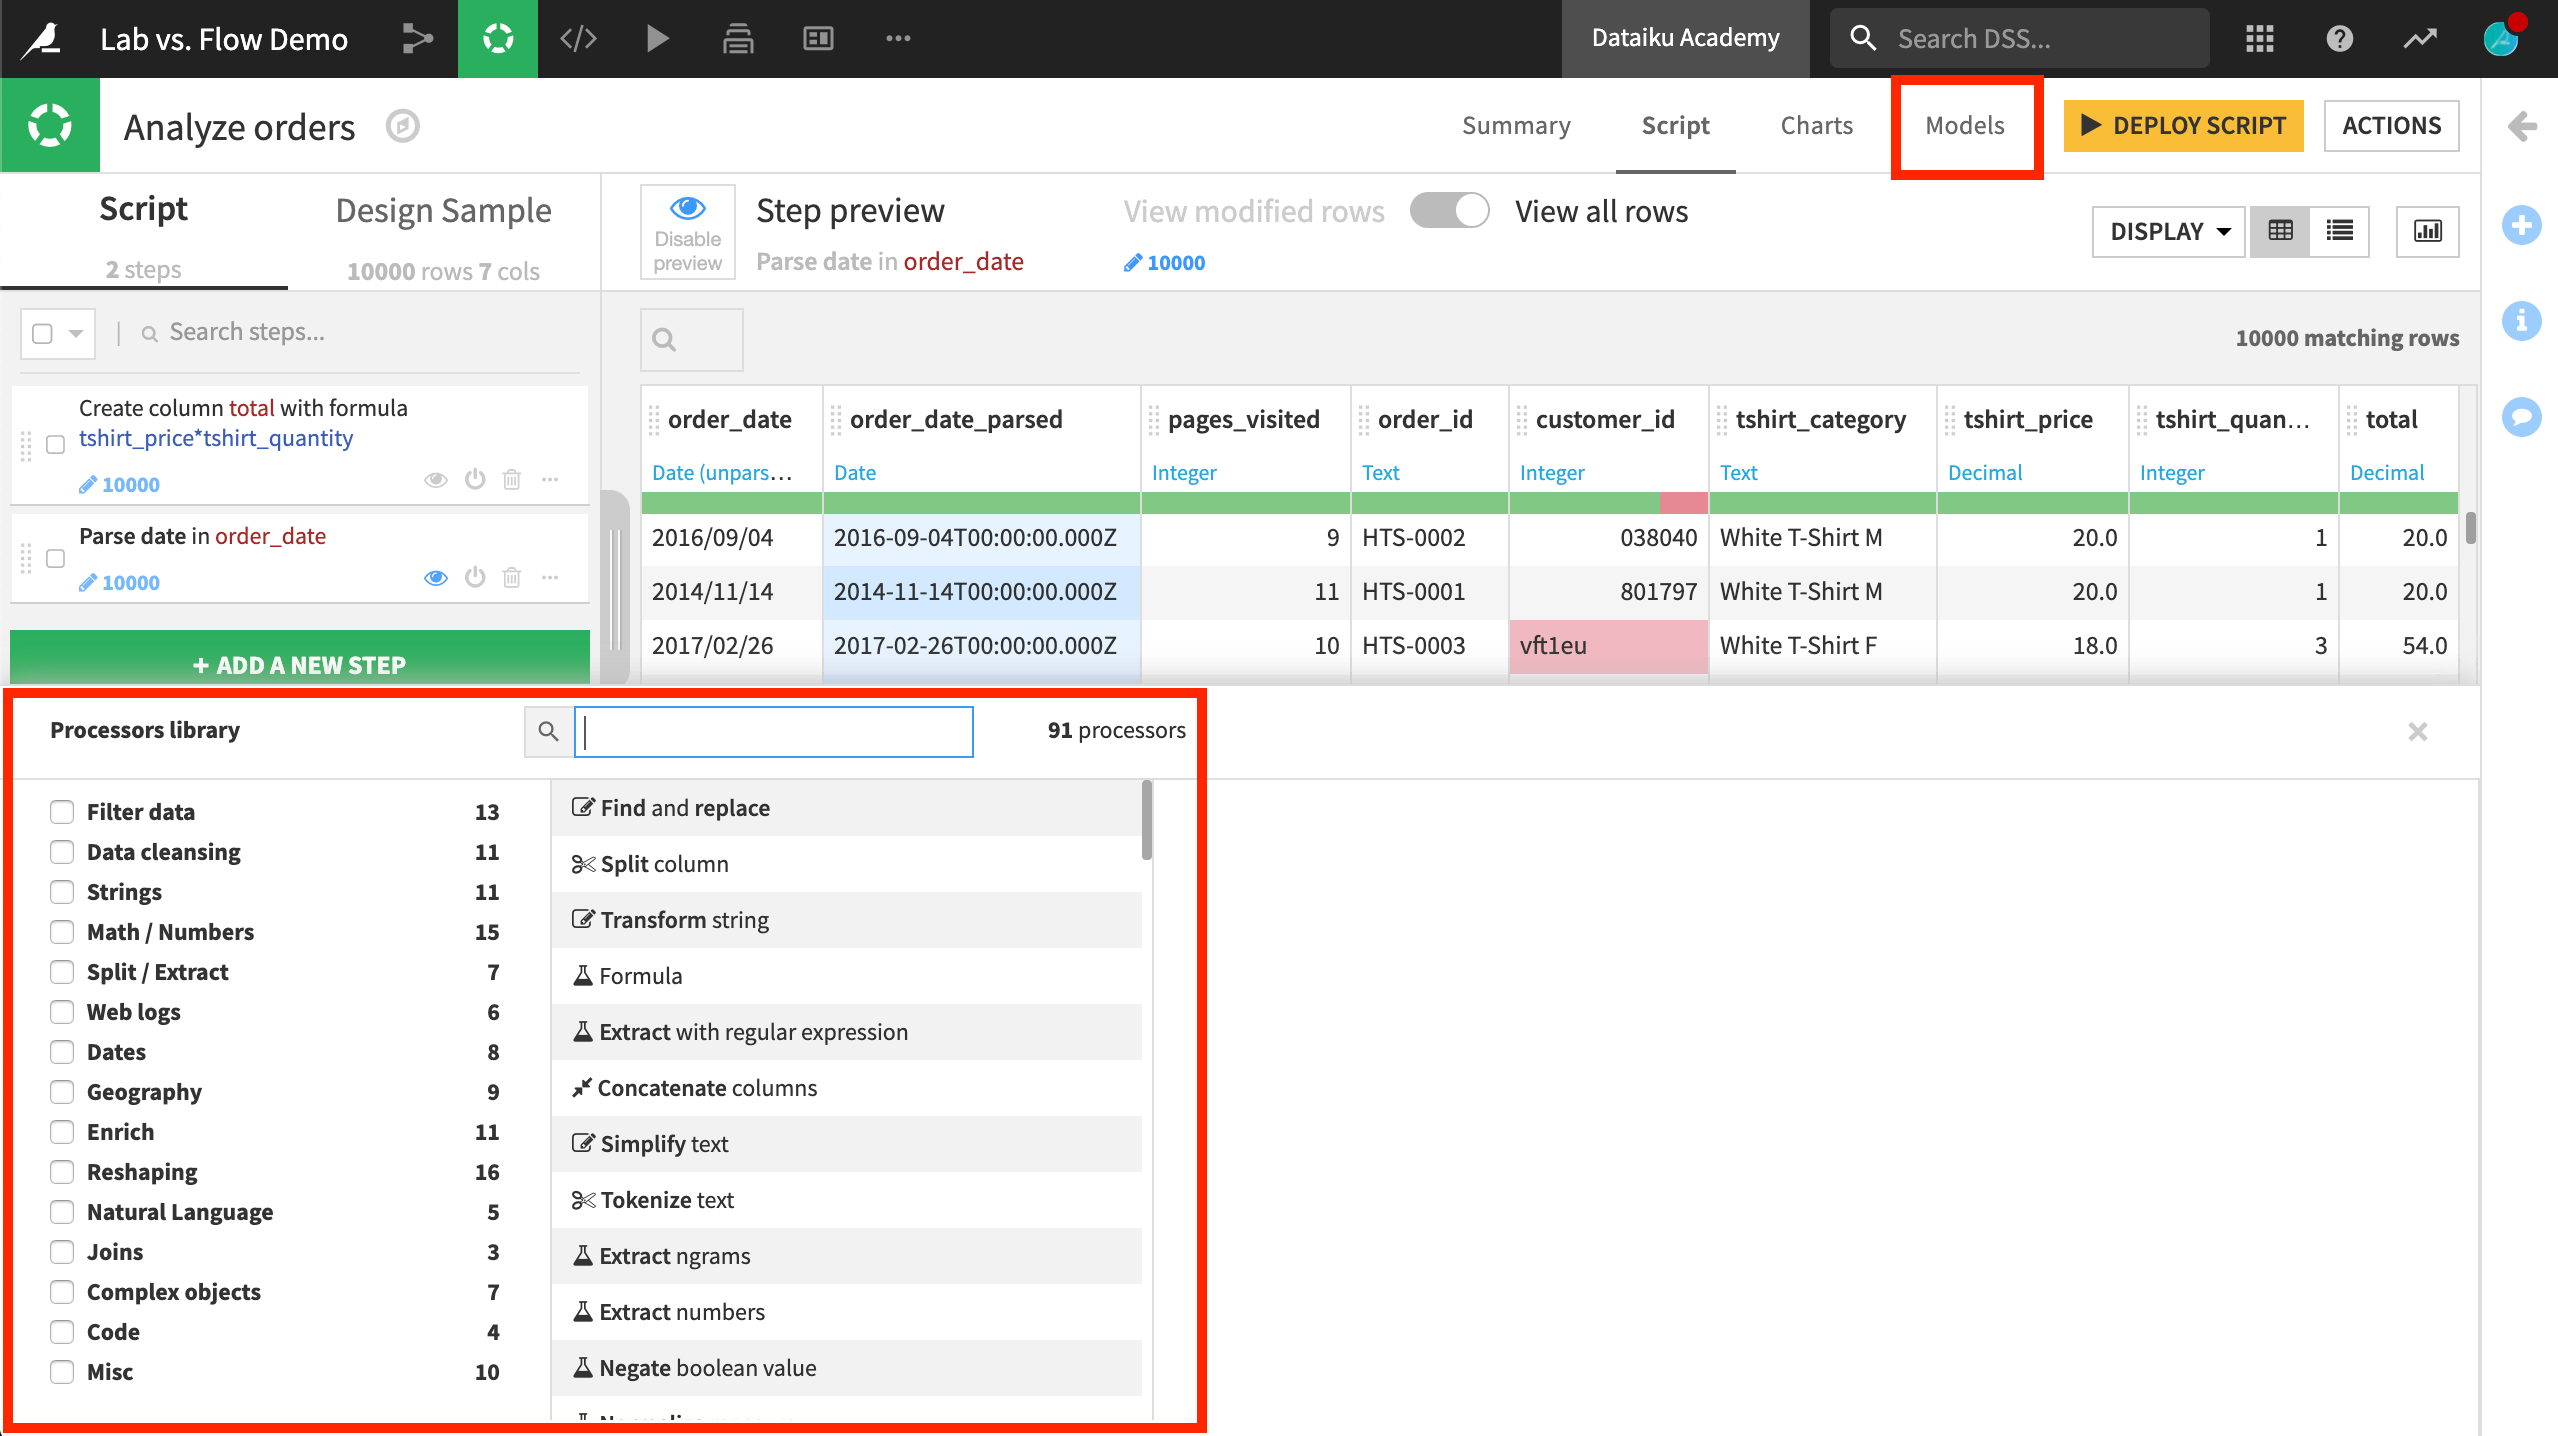
Notice, however, the Models tab. This is not found in the Prepare recipe. A visual analysis script in the Lab is a very handy space to do feature engineering in advance of modeling. All of the data preprocessing steps created in the visual analysis will be applied when training machine learning models.
Other courses will cover visual machine learning with DSS in greater detail, but, for now, know that it all starts in the Lab, as modeling is also an experimental process!
Despite a similar appearance, it is important to understand the difference between a visual analysis script in the Lab and a Prepare recipe in the Flow.
A visual analysis is a pure “Lab” object, which does not have persistent output data.
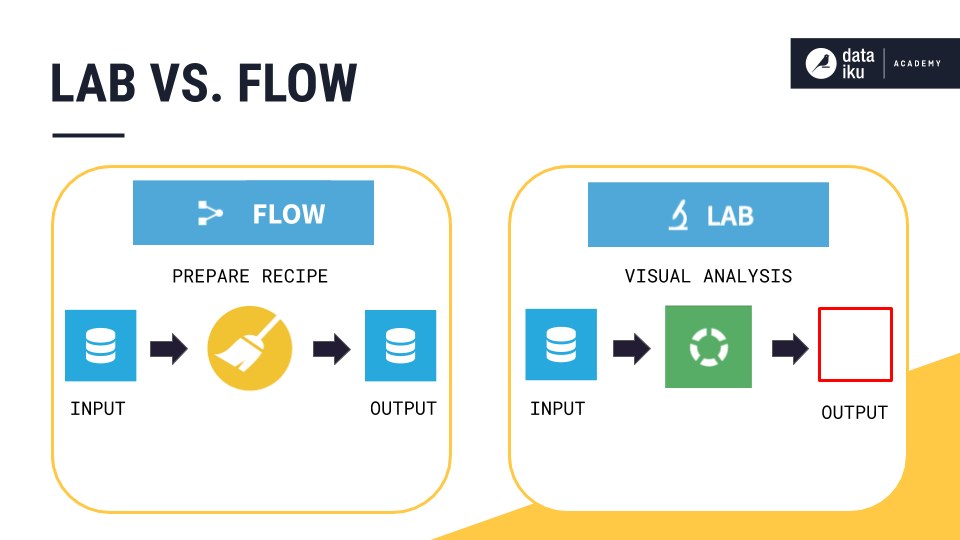
As such, columns in a visual analysis have meanings, but do not have a notion of storage types (since they are not stored).
This means you will not find data preprocessing steps created in a visual analysis applied to the dataset in the Flow. Remember, work in the Lab is separate from the Flow. Work in the Lab, however, can be deployed to the Flow.
Charts in a Visual Analysis
The presence of the Charts tab in the Lab helps illustrate this difference between the Lab and Flow in another way. Recall that any data preparation steps that have been added to the script can be immediately fed to machine learning models in the Models tab. They can also be immediately investigated in the Charts tab.
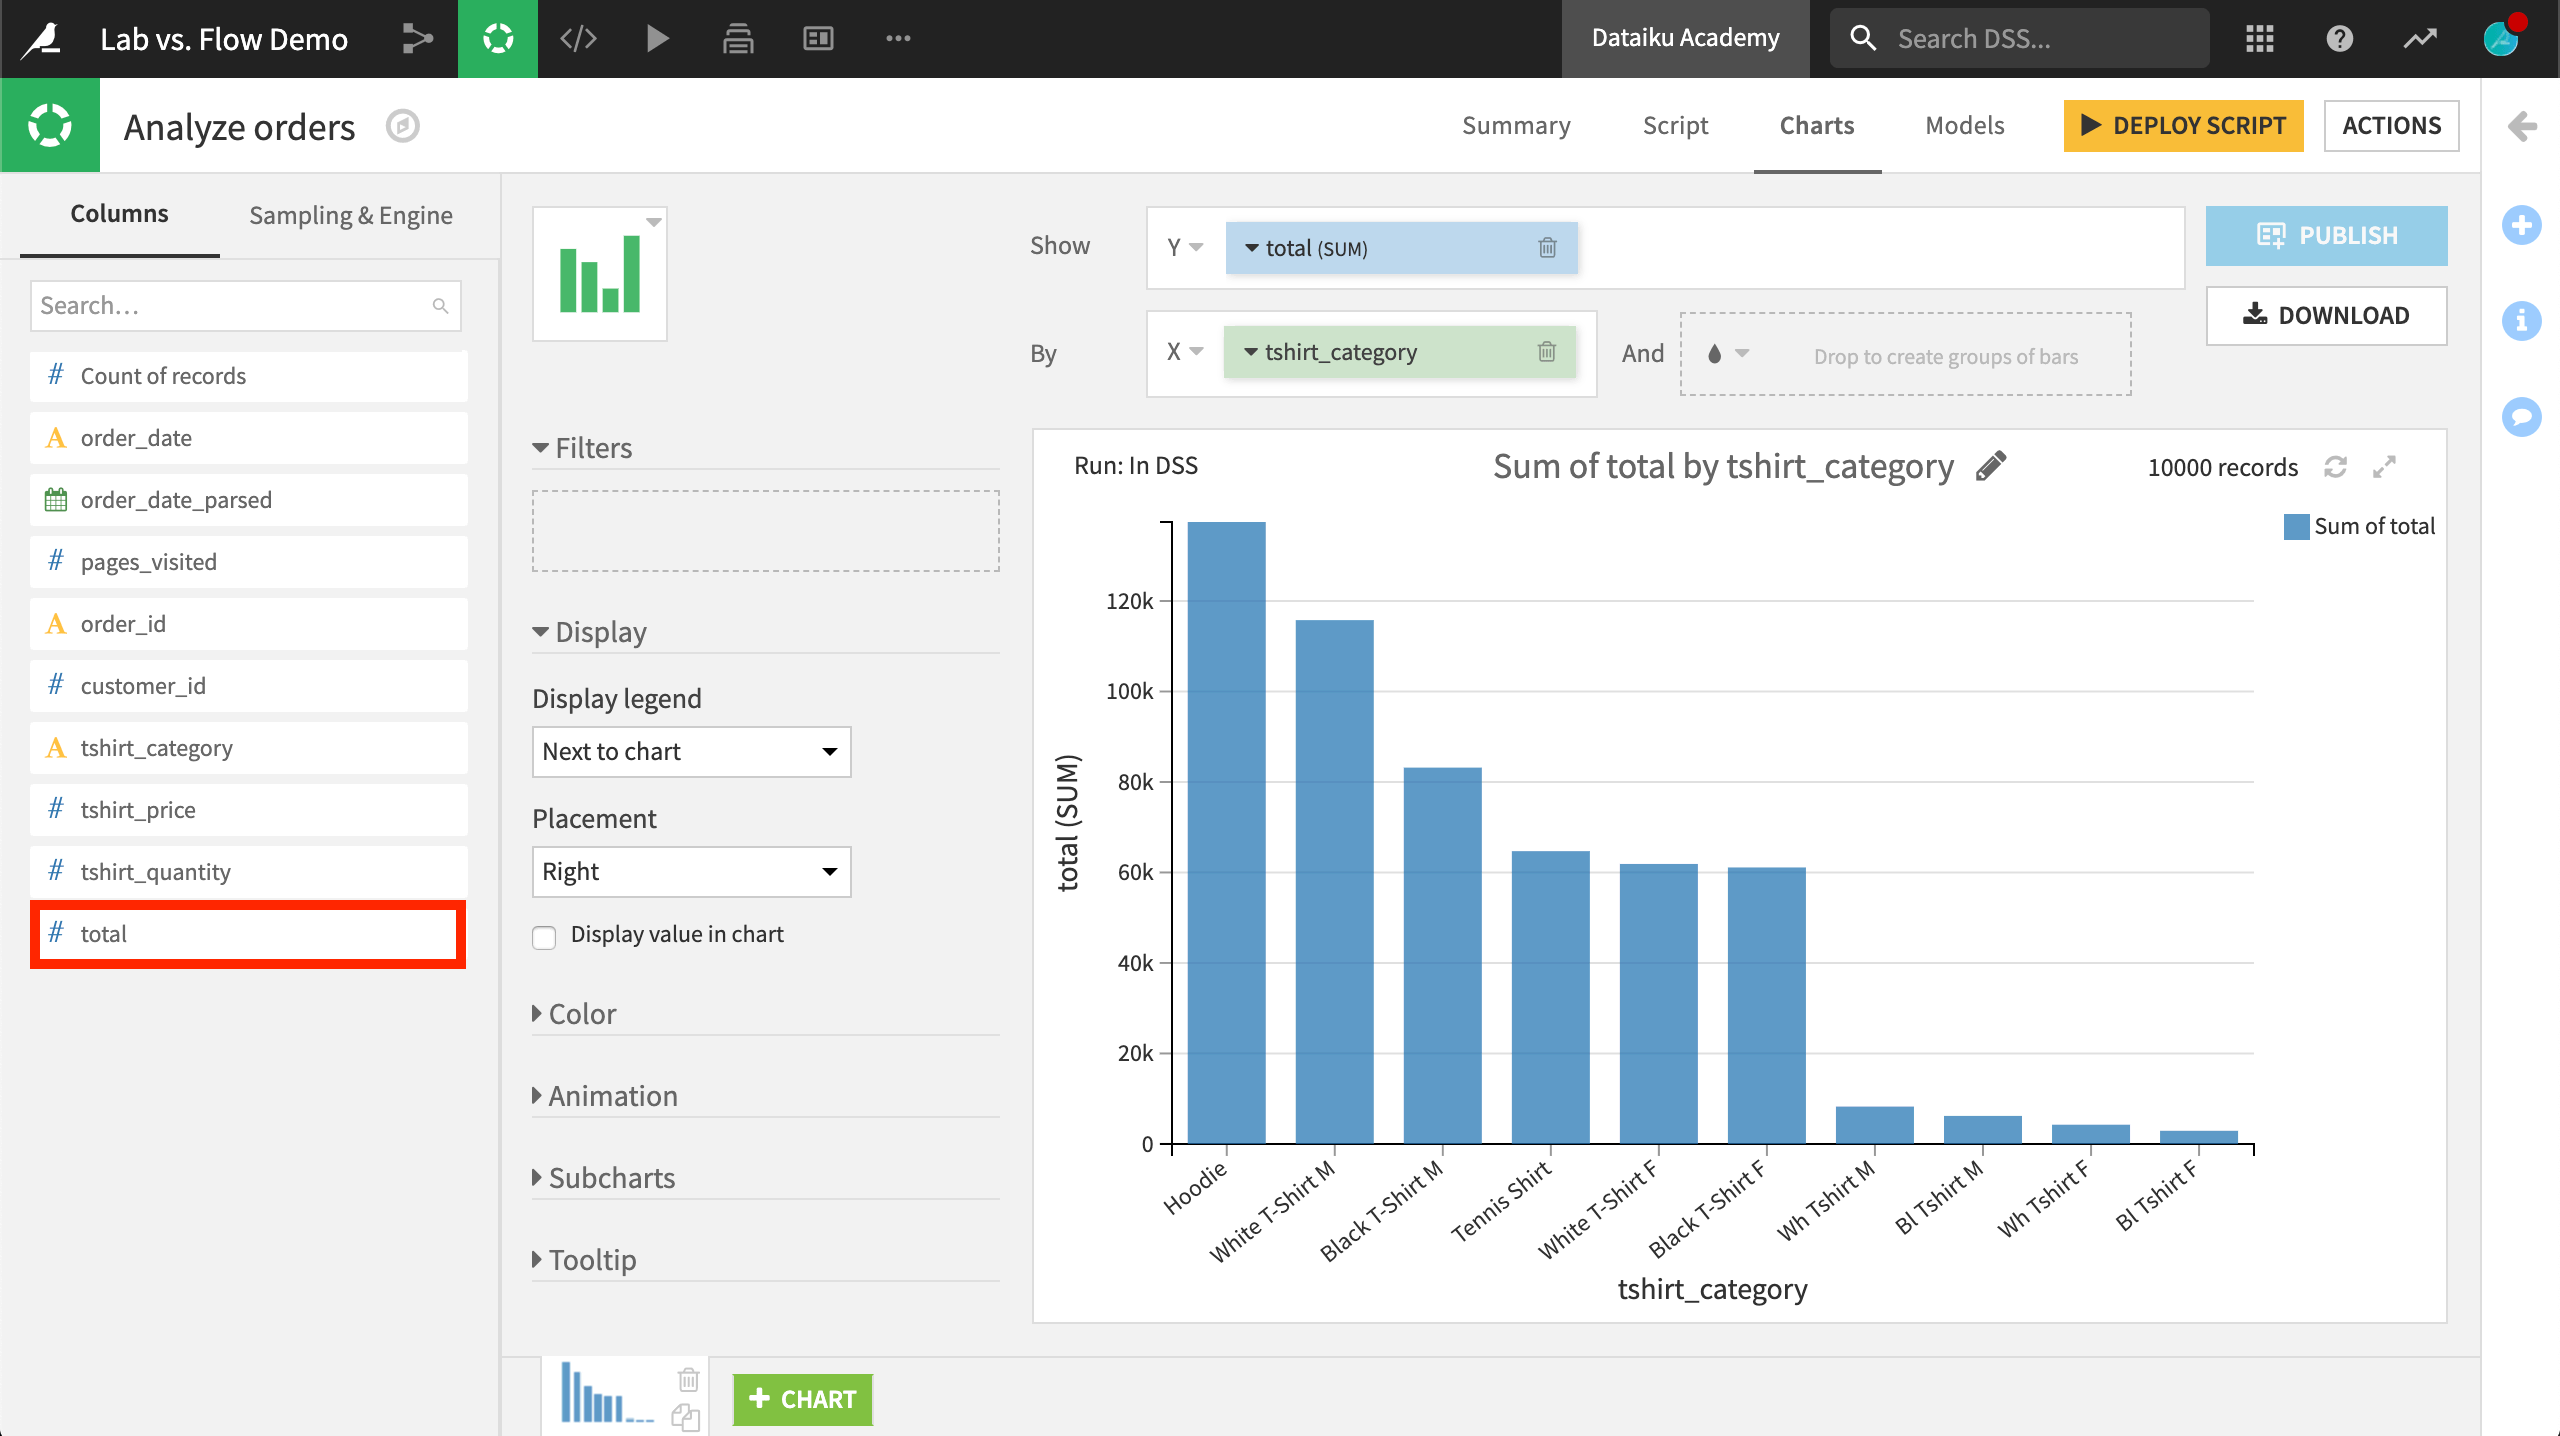
In this example, the total variable was not in the original dataset. It was created in the visual analysis script, but can be immediately used in the Charts tab. In the Flow, on the other hand, you would need to first run the Prepare recipe and build charts with any new columns only on the output dataset.
To recap:
Note
When you create charts in a visual analysis, the charts actually use the preparation script that is being defined as part of the visual analysis.
In other words, you can create new columns or clean data in the Script tab, and immediately start graphing this new or cleaned data in the Charts tab. This provides a very productive and efficient loop to view the results of your preparation steps.
While you work in charts in an analysis, also keep in mind that these are built on a sample of the data. You can change the sample in the Sampling and Engine tab in the left panel, but since DSS has to reapply the latest preparation each time, it will not be very efficient for very large datasets.
Also, charts in a visual analysis cannot be shared with your team through a dashboard. Only charts built upon datasets can be shared on the dashboard. If you want to get business insights to share with your team, you will need to first deploy your script.
Deploying Lab work to the Flow
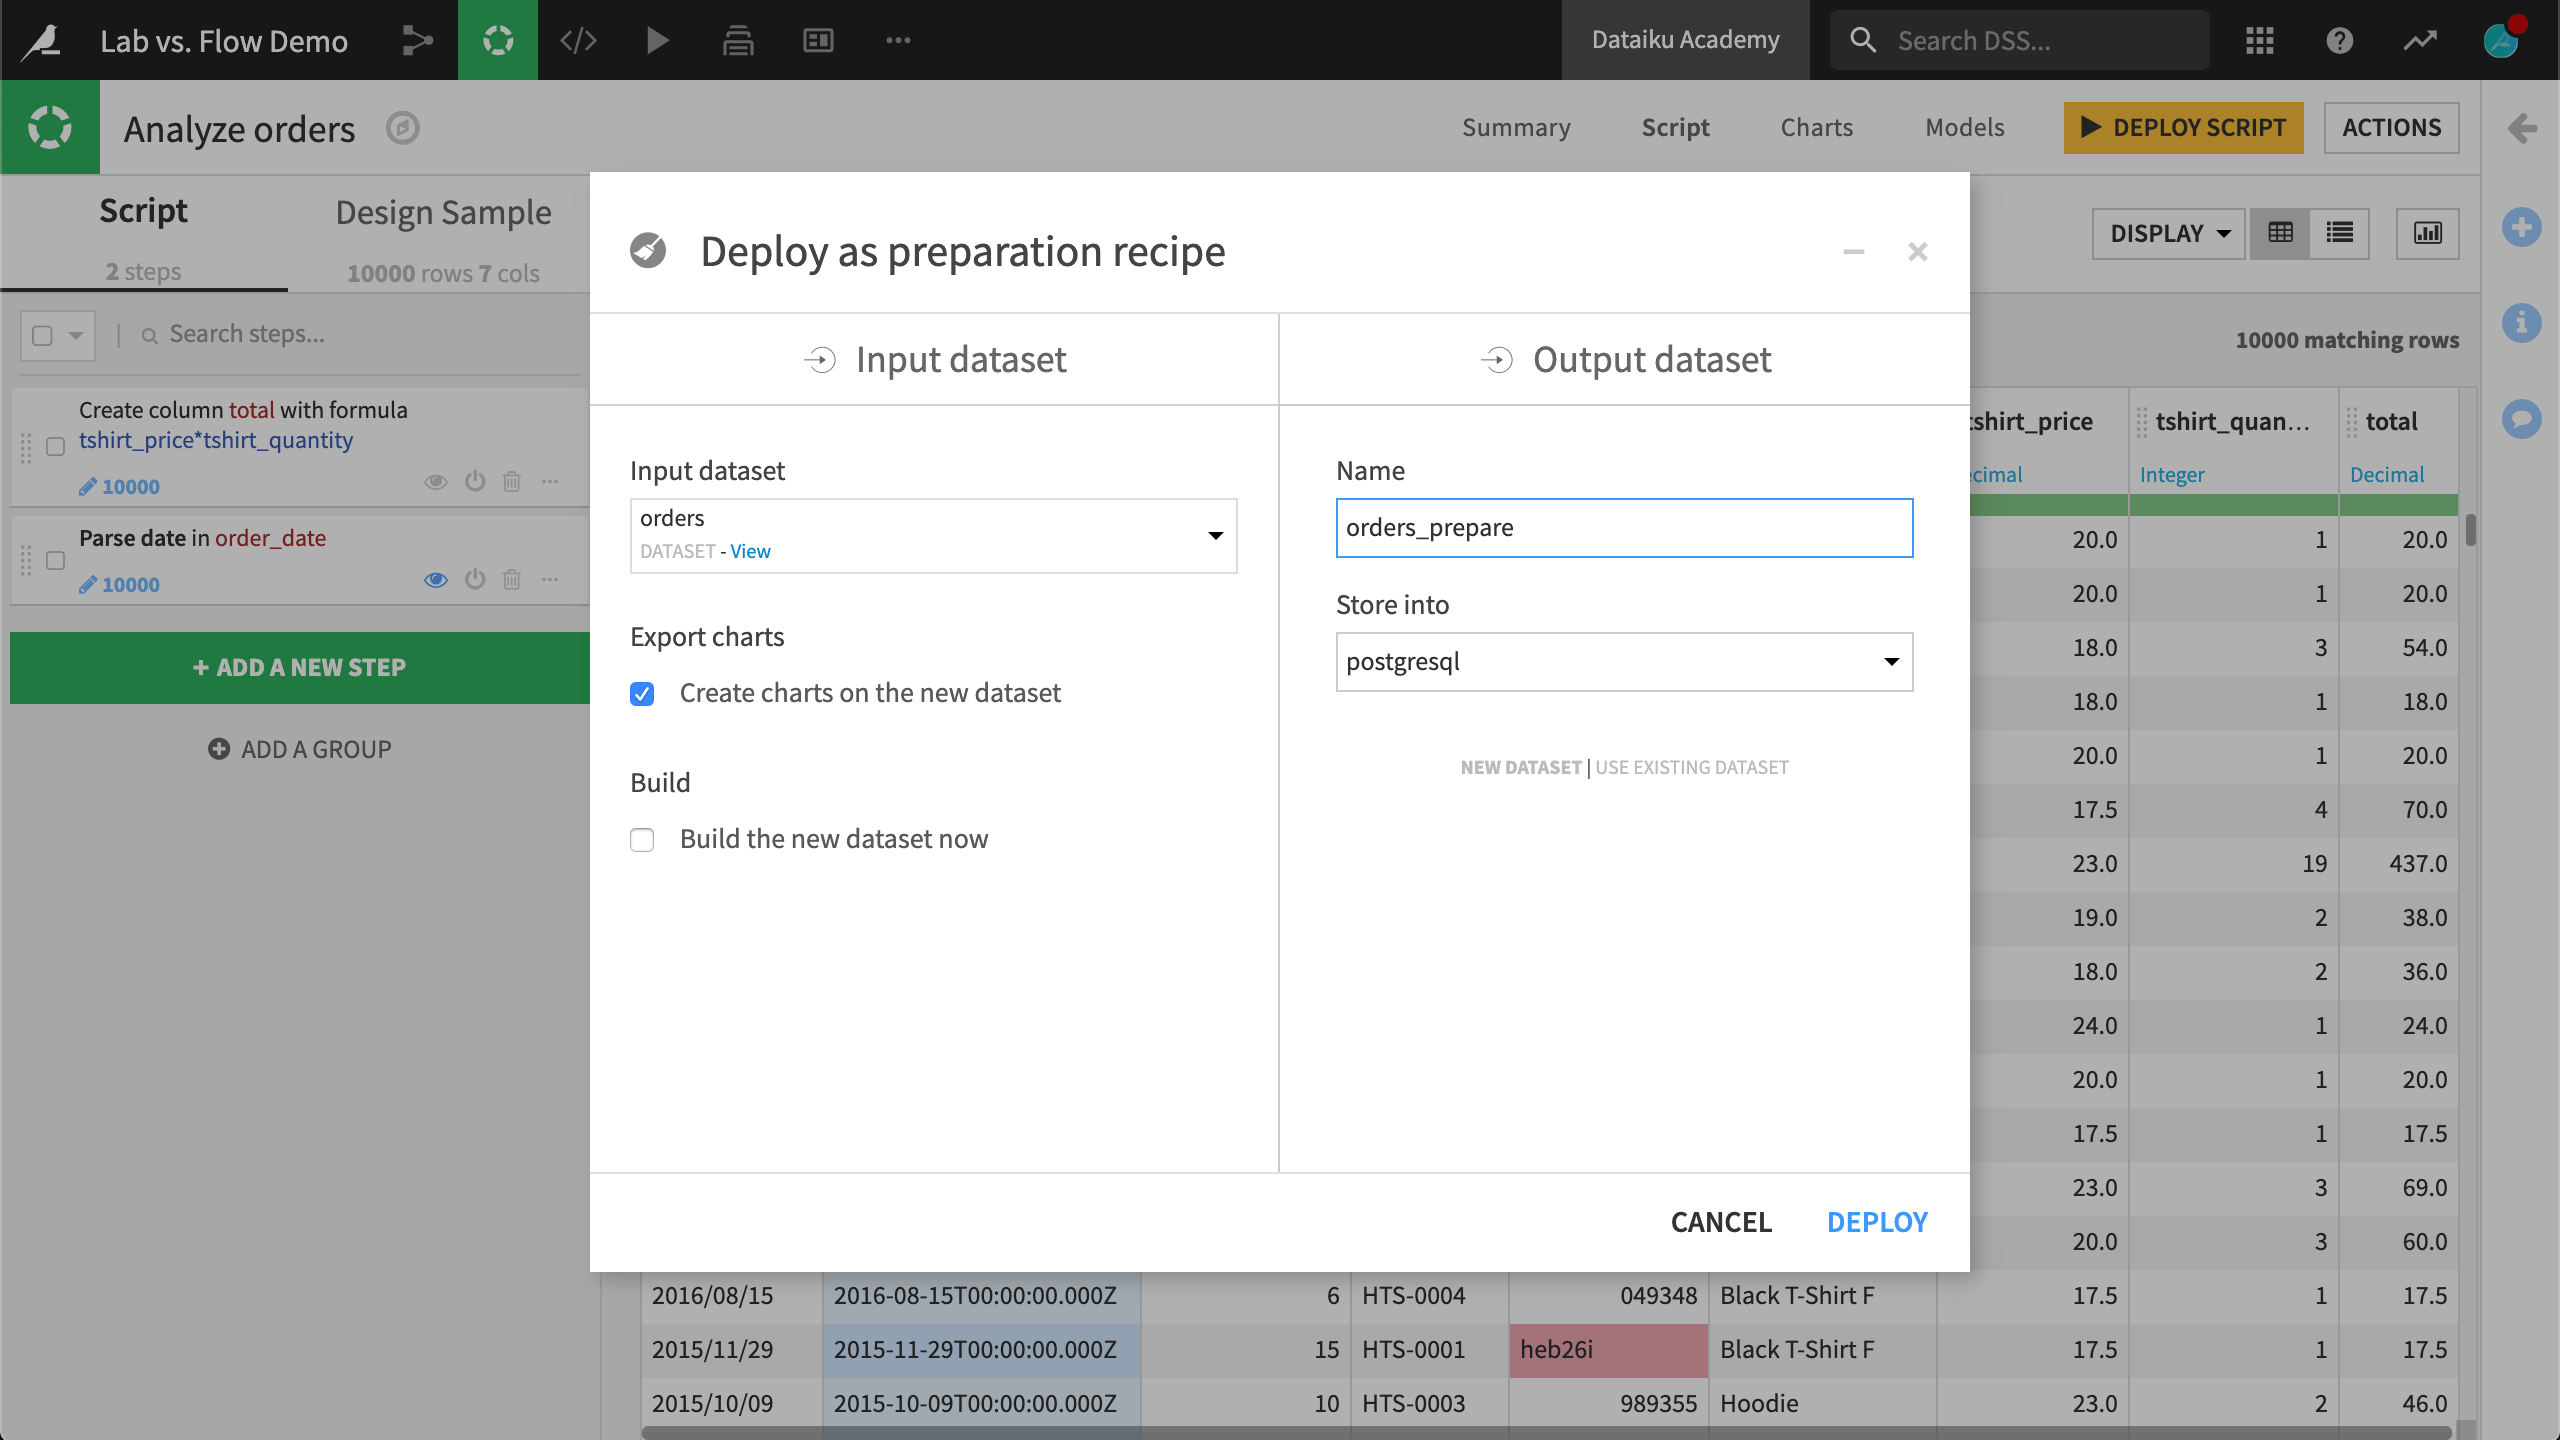
You can also bring work from the Lab into the Flow. If you want to apply the data preparation steps from a visual analysis script to a Prepare recipe in the Flow, use the “Deploy Script” button at the top right of the screen.
Once deployed, DSS can apply all of the data preparation steps to the whole input dataset and saves the resulting data in a new output dataset. The newly created dataset (and its building recipe) are added to the lineage of the Flow, so that you can easily reconstruct it in the future (when the input data changes for example)
Code Notebooks
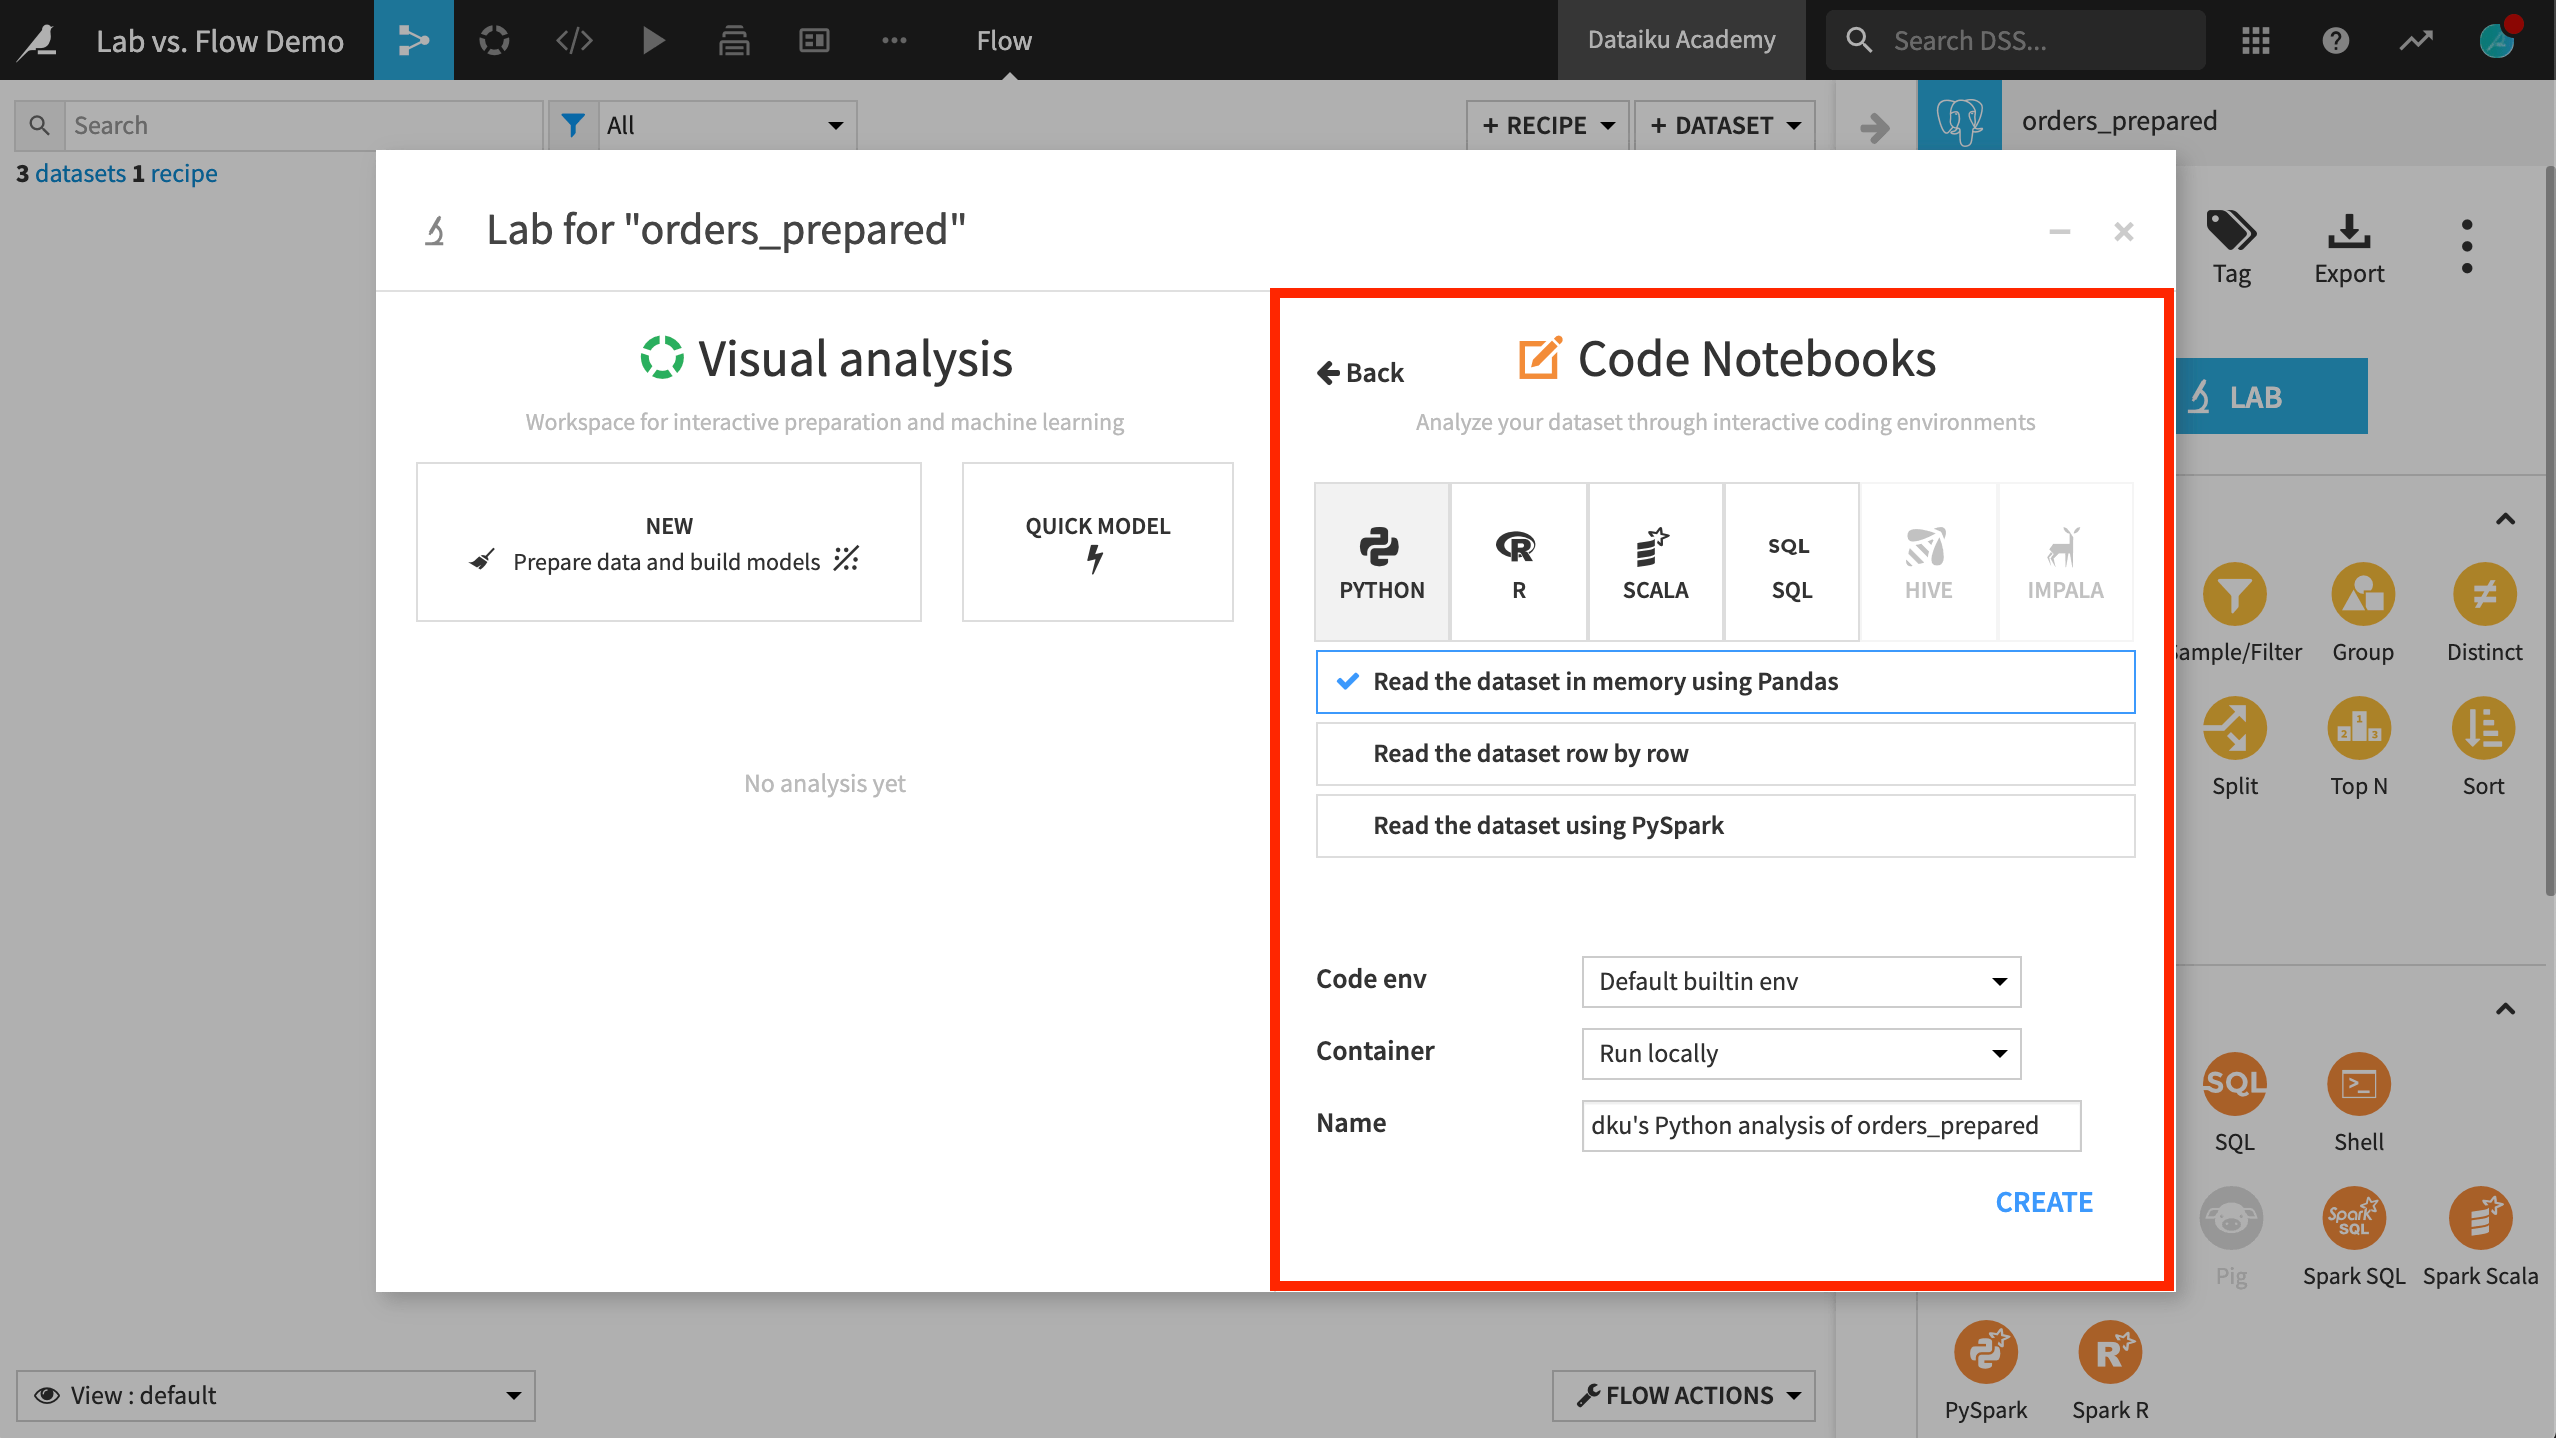
In the Lab, coders can find blank or pre-defined notebooks in a variety of languages, depending on the type of dataset.
When creating a notebook, you have options for reading in the dataset in different ways, which provide the relevant starter code. You can also specify the code environment and/or container for the notebook.
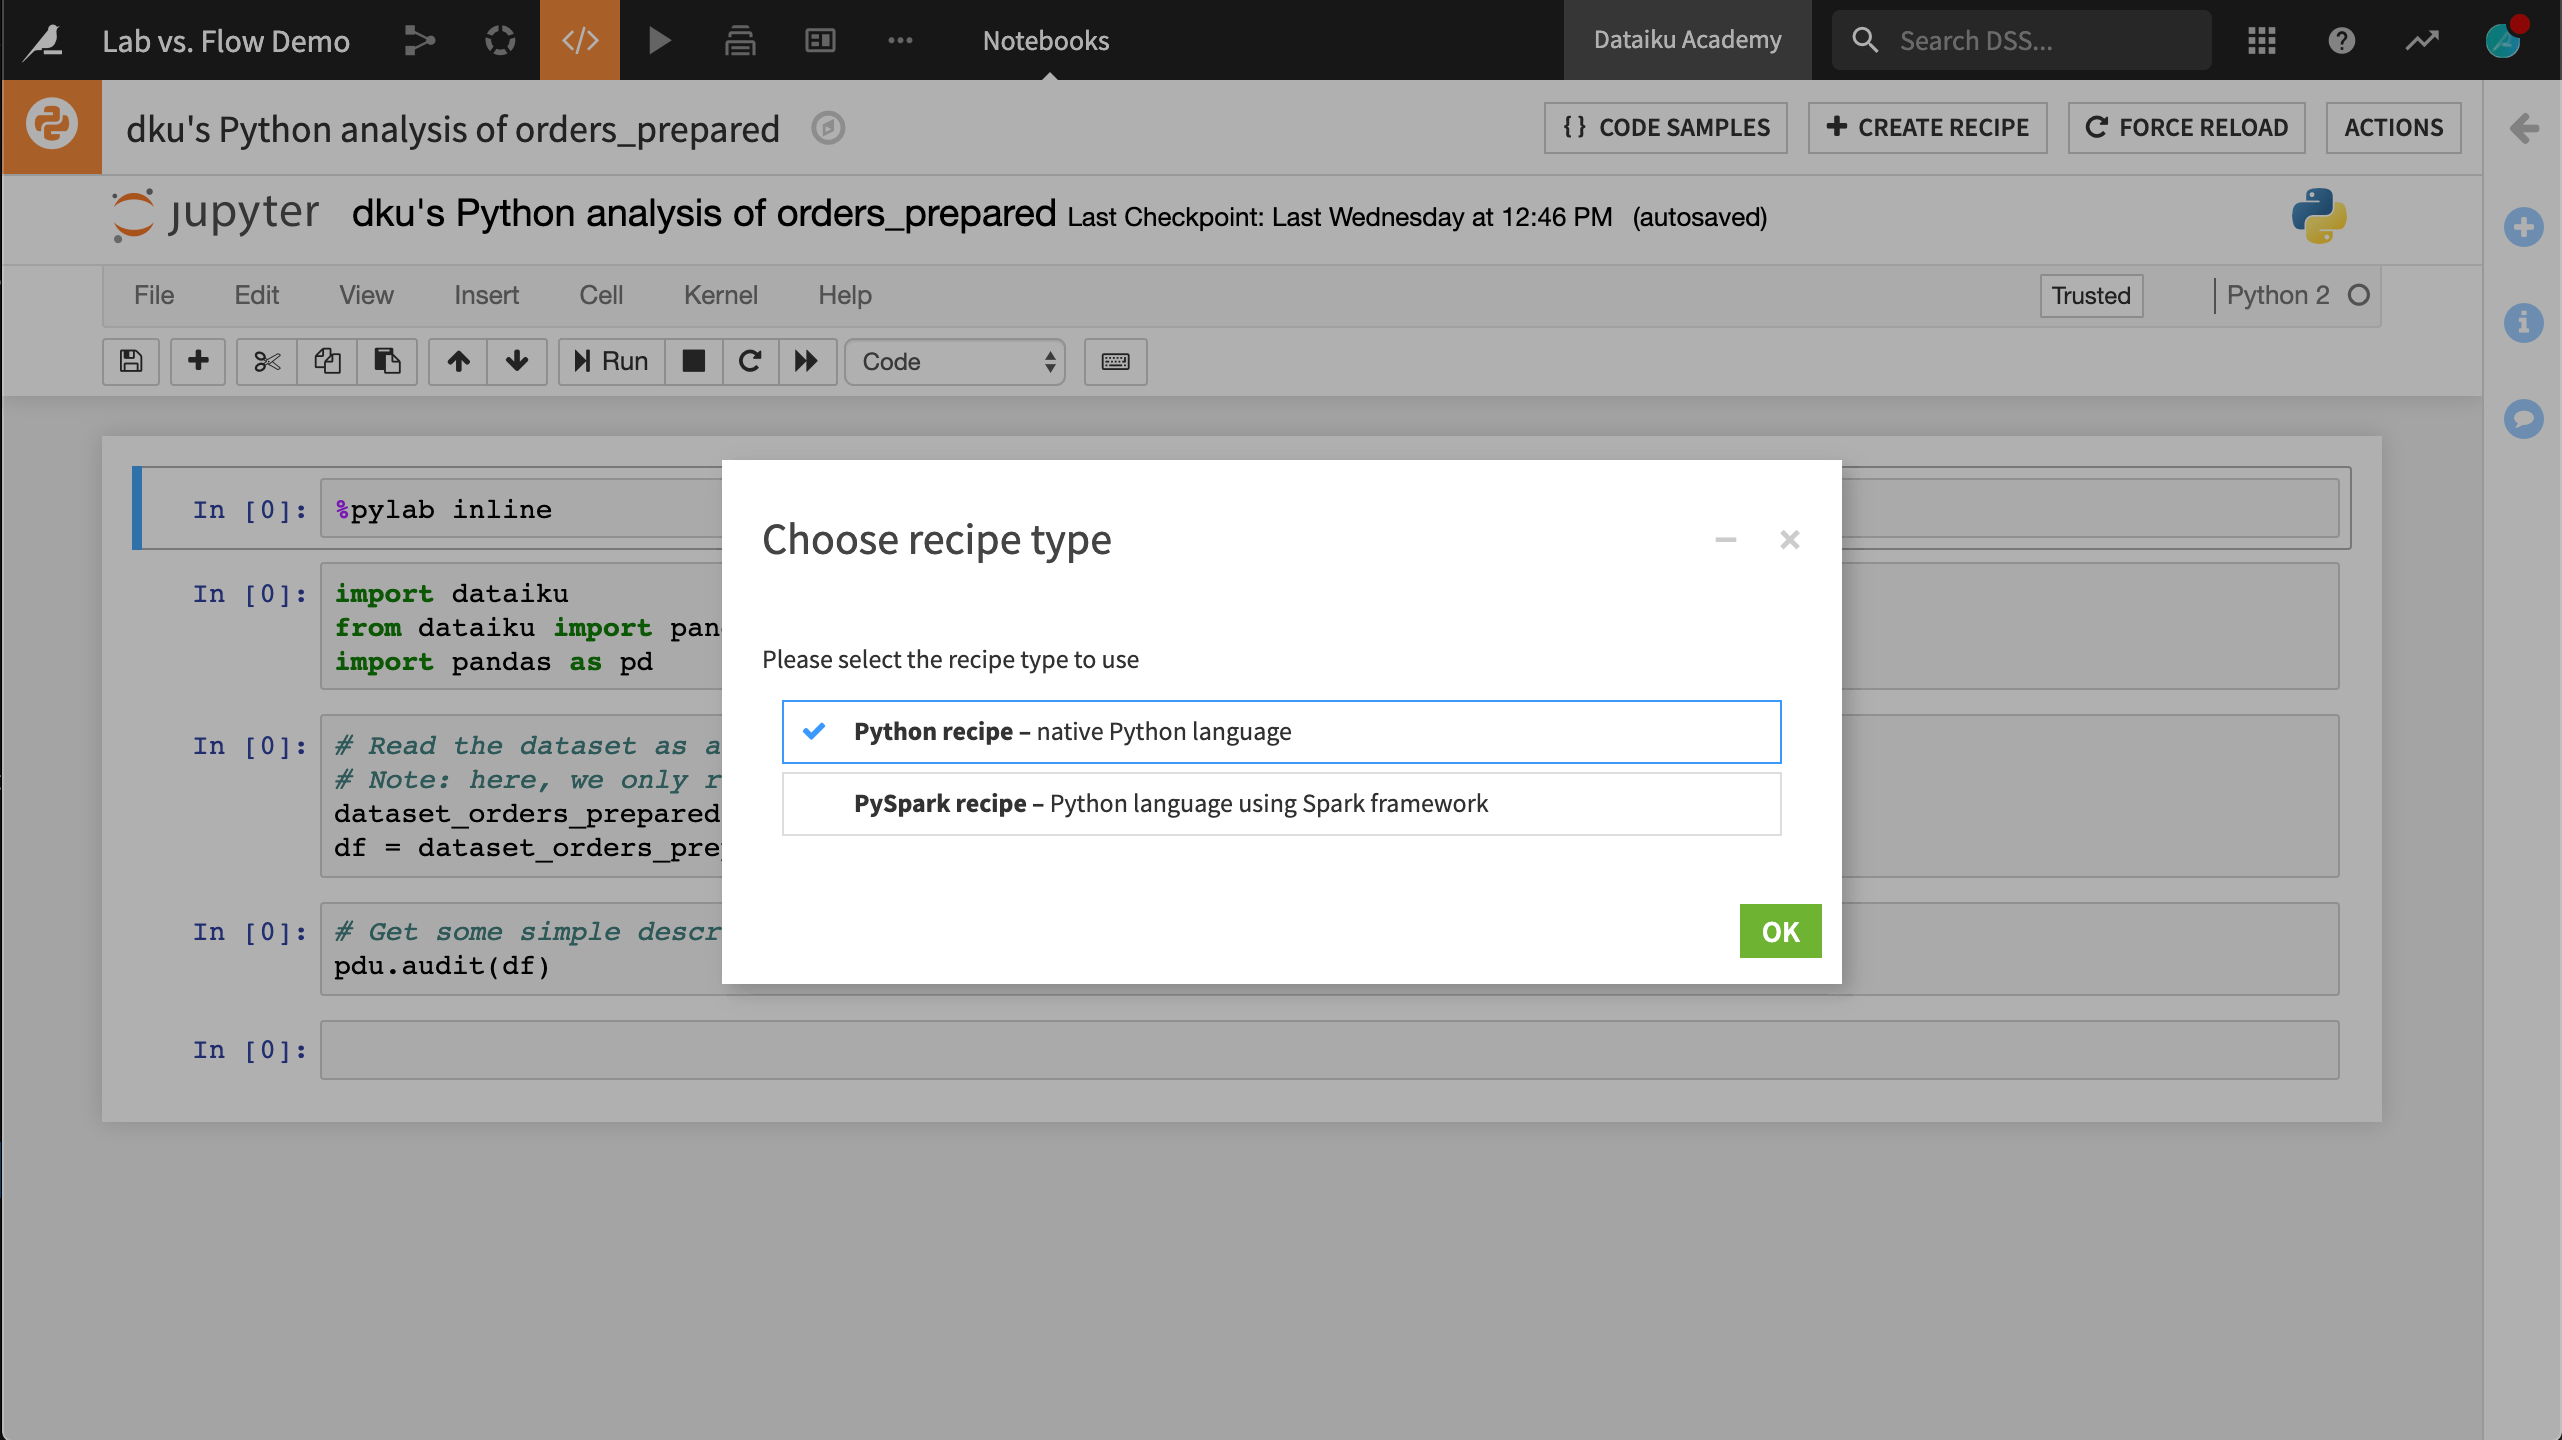
In a similar manner to how visual analysis scripts can be deployed to the Flow as Prepare recipes, code notebooks can find their way into the Flow by being converted to code recipes. This provides a fast and easy method for adding code recipes into a production workflow.
What’s next?
Explore these concepts on your own in the following hands-on section.