Hands-On Tutorial: Metrics & Checks (Part 1)
In a data science project, datasets need to be updated; models need to be rebuilt; and dashboards need to be refreshed. In order to put such a project into production, it is essential to have tools that can track the evolution of objects.
Key to achieving this process in Dataiku DSS are metrics, checks, and scenarios.
Let’s Get Started!
This hands-on tutorial has three parts:
In the first part, we’ll focus on understanding how to use metrics and checks in Dataiku DSS in order to monitor the status of datasets and models.
In the second part, we’ll demonstrate how to use metrics and checks inside of a scenario in order to safely automate workflows.
In the third part, we’ll look at ways to customize metrics, checks, and scenarios with code.
Advanced Designer Prerequisites
This lesson assumes that you have basic knowledge of working with Dataiku DSS datasets and recipes.
Note
If not already on the Advanced Designer learning path, completing the Core Designer Certificate is recommended.
You’ll need access to an instance of Dataiku DSS (version 9.0 or above) with the following plugins installed:
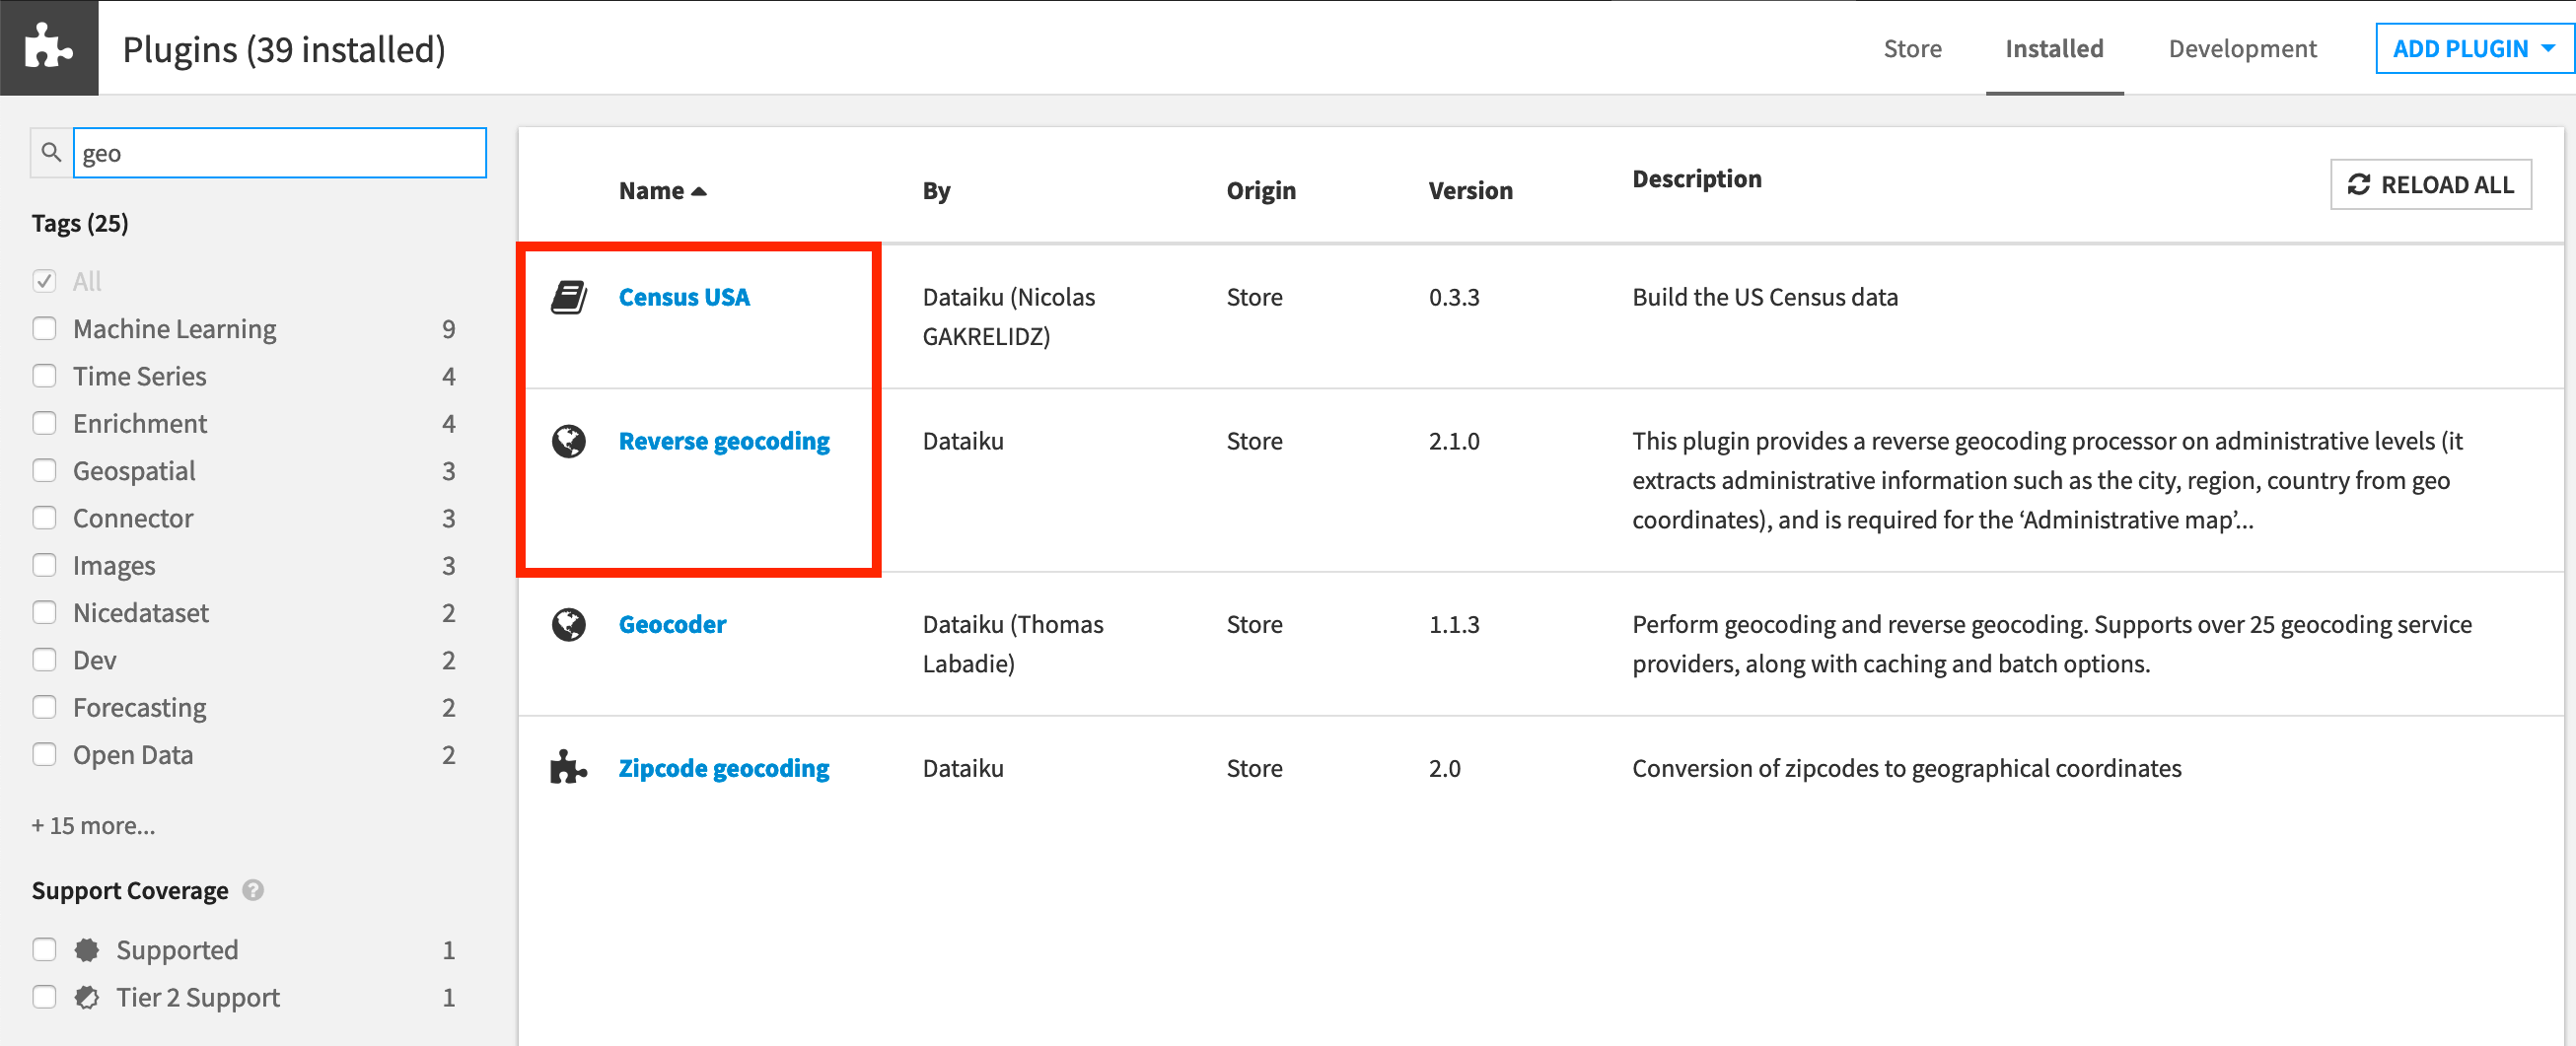
Census USA (minimum version 0.3)
These plugins are available through the Dataiku Plugin store, and you can find the instructions for installing plugins in the reference documentation. To check whether the plugins are already installed on your instance, go to the Installed tab in the Plugin Store to see a list of all installed plugins.
Plugin Installation for Dataiku Online Users
Tip
Users of Dataiku Online should note that while plugin installation is not directly available, you can still explore available plugins from your launchpad:
From your instance launchpad, open the Features panel on the left hand side.
Click Add a Feature and choose “US Census” from the Extensions menu. (“Reverse geocoding” is already available by default).
You can see what plugins are already installed by searching for “installed plugins” in the DSS search bar.
Create Your Project
Click +New Project > DSS Tutorials > Advanced Designer > Flow Views & Automation (Tutorial).
Note
If you’ve already completed one of the Plugin Store tutorial, you can use the same project.
Need Help Creating the Project?
Note
You can also download the starter project from this website and import it as a zip file.
Change Dataset Connections (Optional)
Aside from the input datasets, all of the others are empty managed filesystem datasets.
You are welcome to leave the storage connection of these datasets in place, but you can also use another storage system depending on the infrastructure available to you.
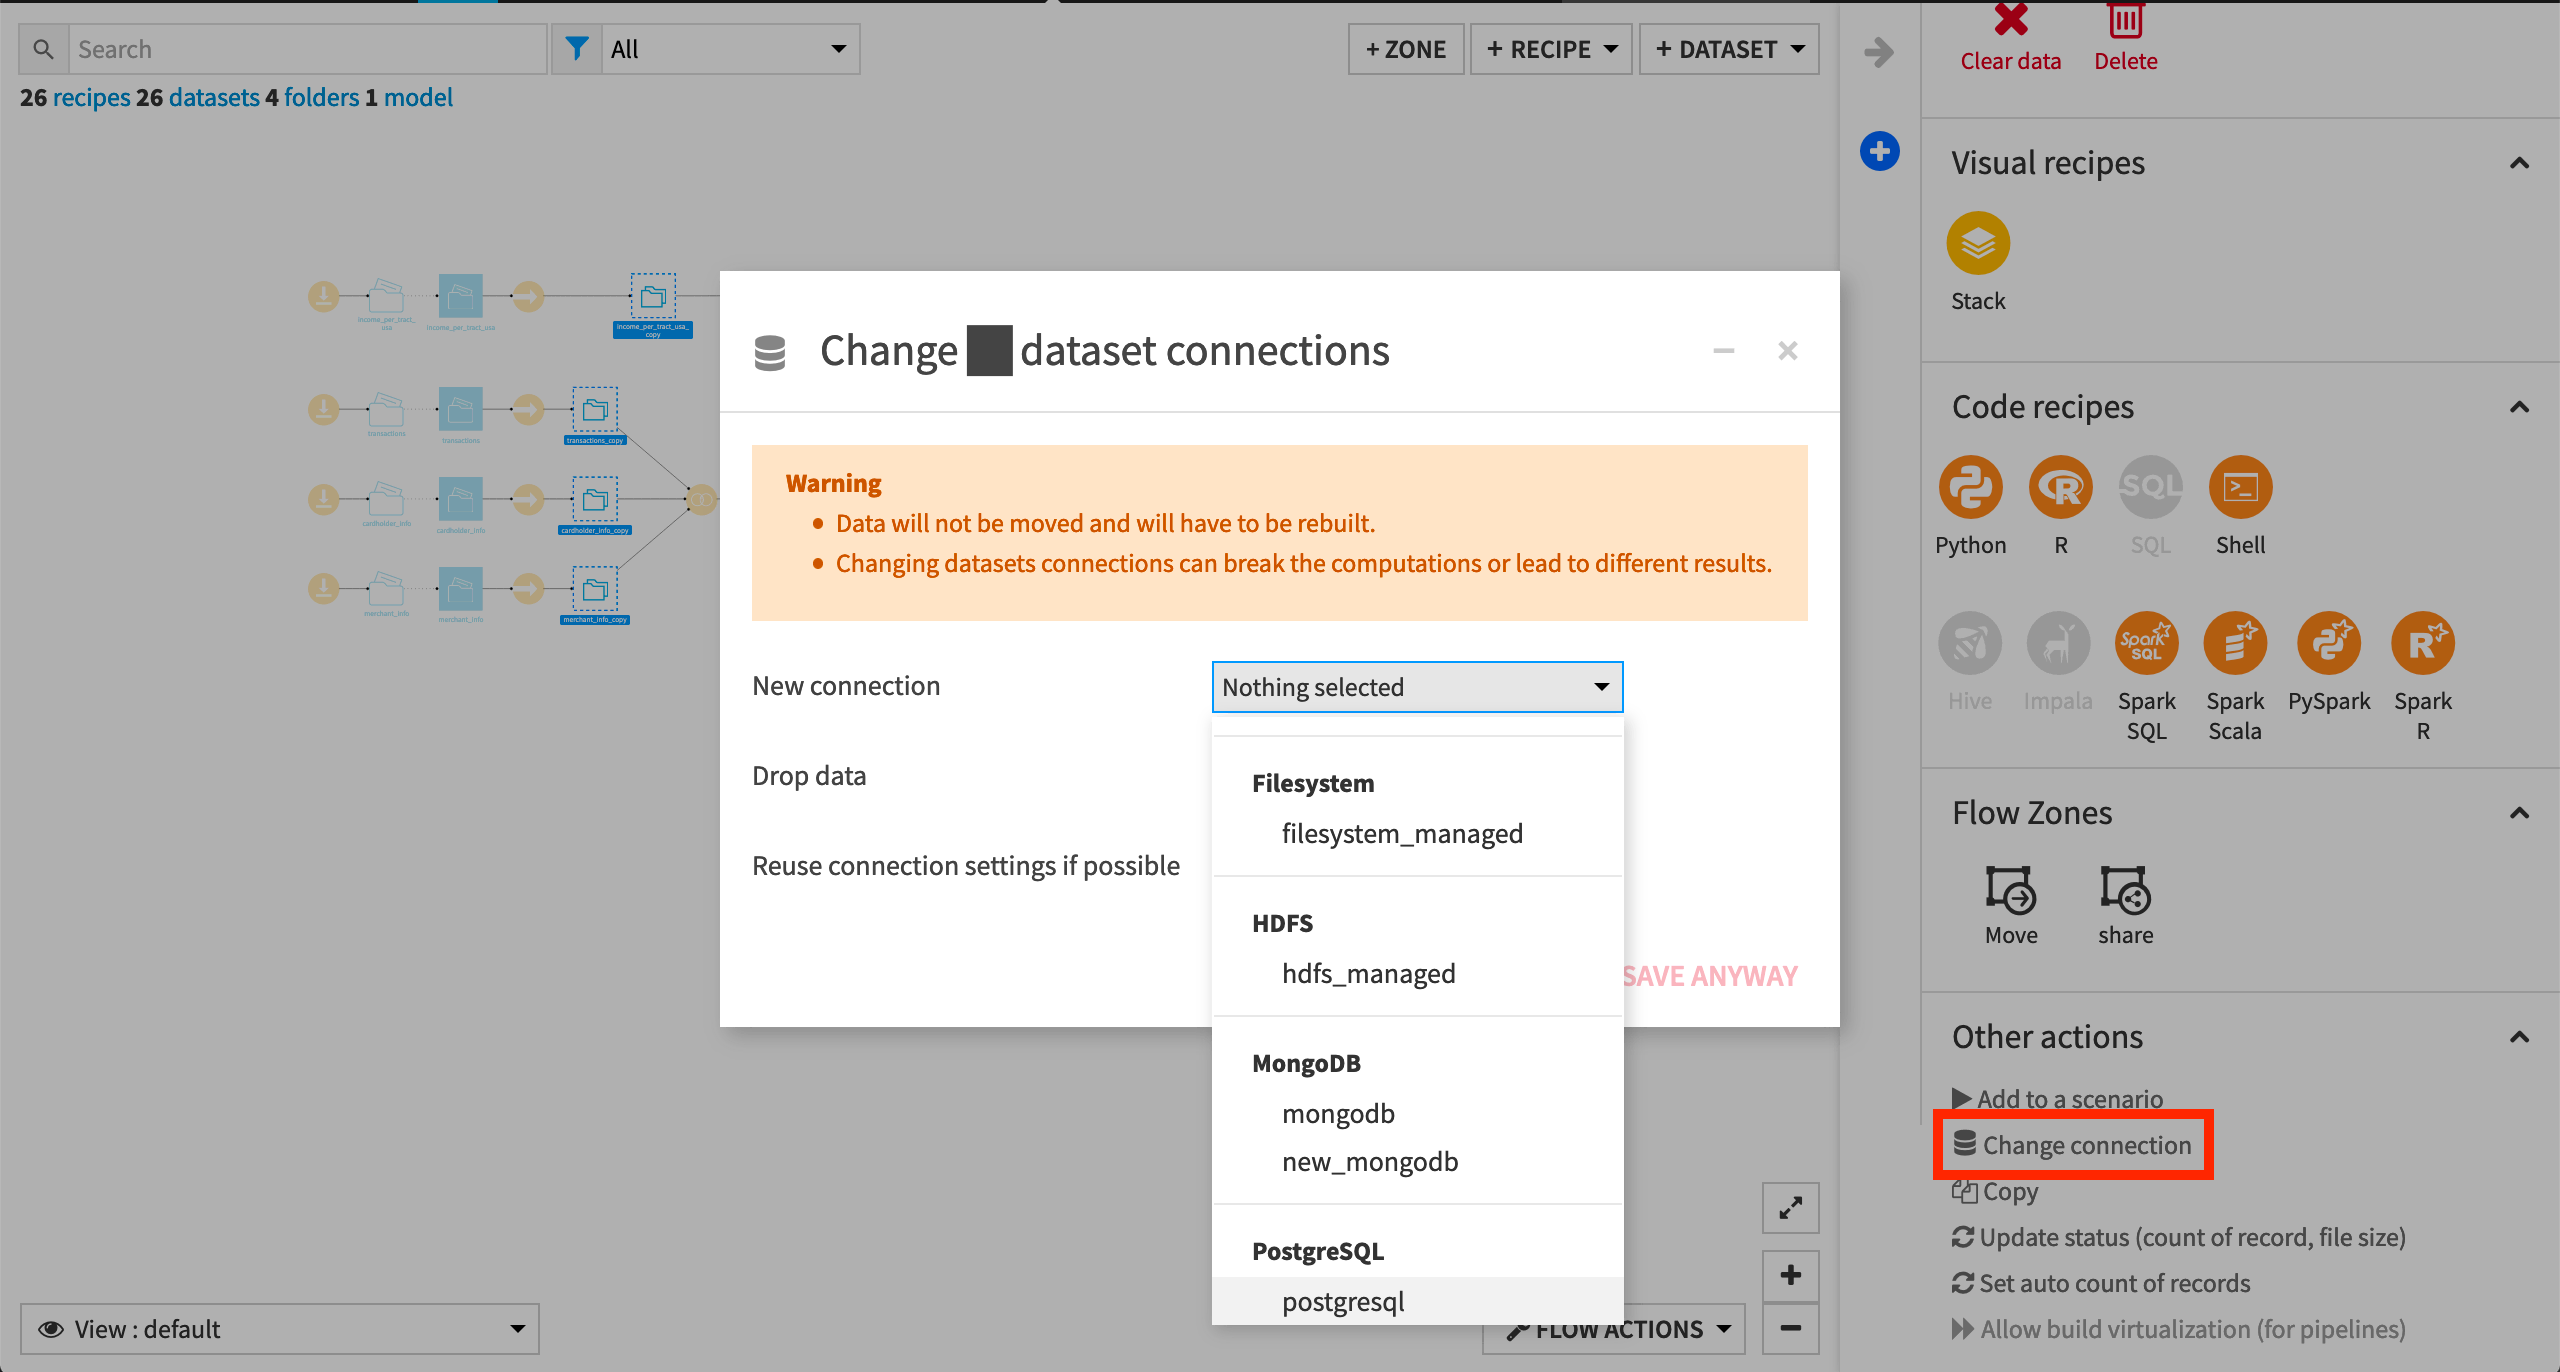
To use another connection, such as a SQL database, follow these steps:
Select the empty datasets from the Flow. (On a Mac, hold Shift to select multiple datasets).
Click Change connection in the “Other actions” section of the Actions sidebar.
Use the dropdown menu to select the new connection.
Click Save.
Note
For a dataset that is already built, changing to a new connection clears the dataset so that it would need to be rebuilt.
Note
Another way to select datasets is from the Datasets page (G+D). There are also programmatic ways of doing operations like this that you’ll learn about in the Developer learning path.
The screenshots below demonstrate using a PostgreSQL database.
Whether starting from an existing or fresh project, ensure that the datasets merchants_census_tracts_joined and transactions_unknown_scored are built.
See Build Details Here if Necessary
From the Flow, select the end datasets required for this tutorial: merchants_census_tracts_joined and transactions_unknown_scored
Choose Build from the Actions sidebar.
Leave the setting “Build required dependencies” in place.
Click Build to start the job, or click Preview to view the suggested job.
In the Jobs tab, you can see all the activities that Dataiku will perform.
Click Run, and observe how Dataiku progresses through the list of activities.
Note
When the datasets are built, note that the project has a variable state_name defined as “Delaware” (see the Variables tab of the More Options menu). This variable gets used in the Group recipe that creates the transactions_by_merchant_id dataset. Accordingly, the only value for merchant_state in the merchants_census_tracts_joined dataset is “Delaware”. We’ll see how to change this with a scenario later.
Standard Metrics
A key dataset in the Flow is transactions_joined_prepared. Let’s establish some metrics and checks for this dataset in order to monitor its status.
On the Status tab of every dataset in Dataiku DSS, we find a few standard metrics ready to be computed, such as the most recent build date and the column count.
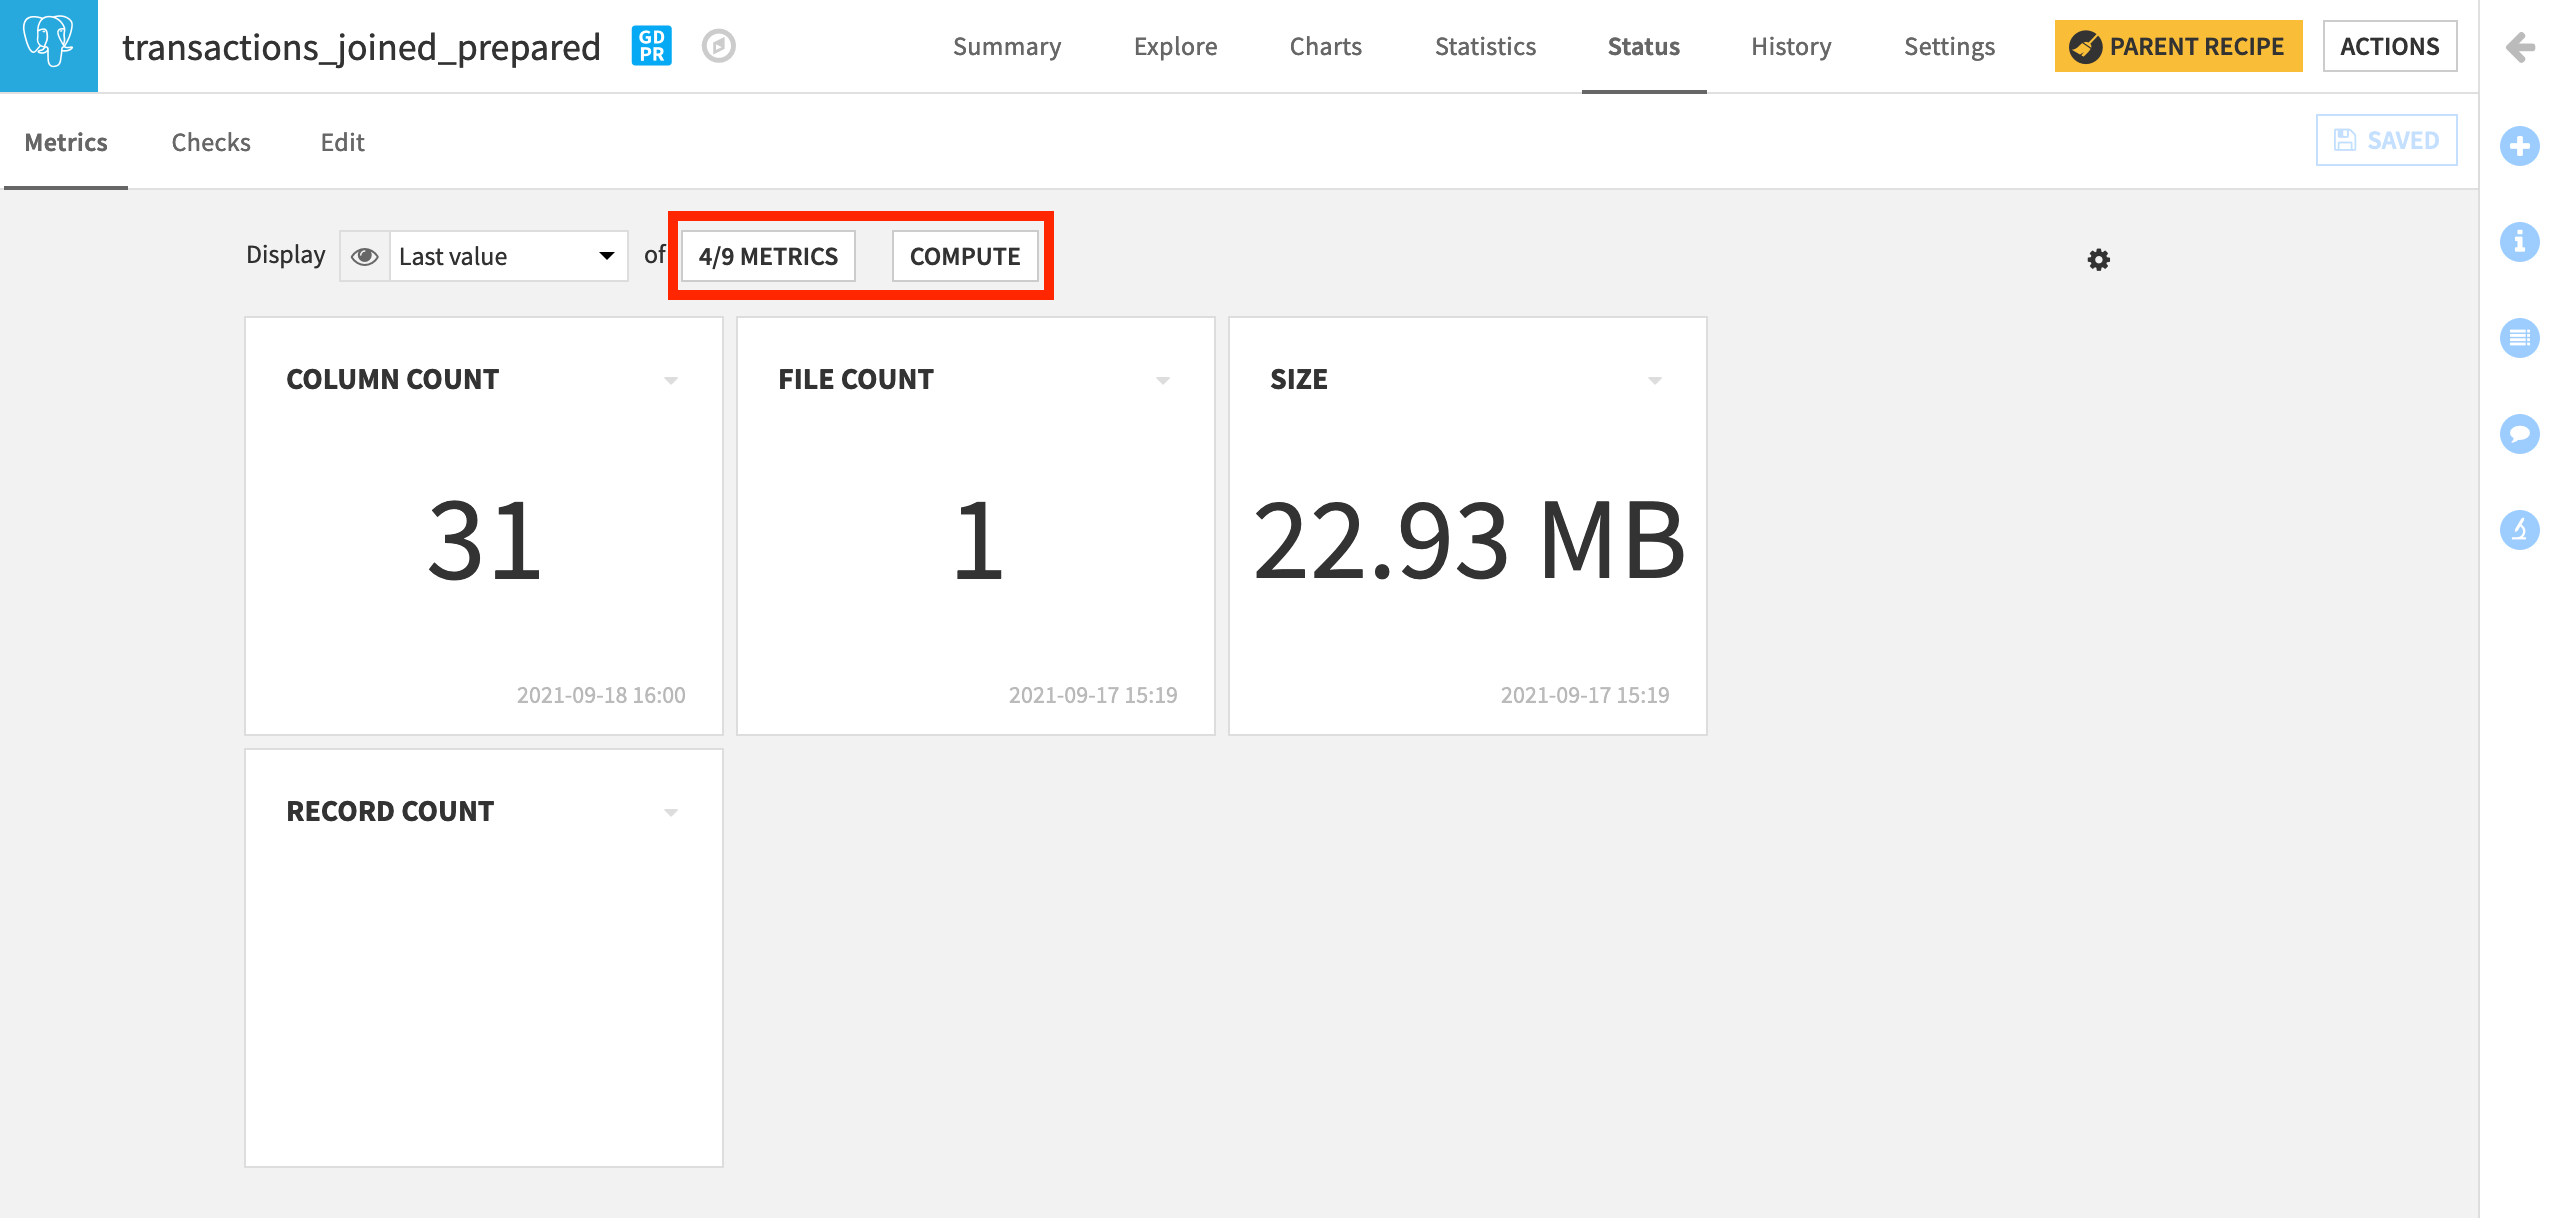
Open transactions_joined_prepared, and navigate to the Status tab.
On the Metrics subtab, we can control which metrics to display and in what format.
Click Compute to calculate all of the displayed metrics if not already done so.
Create Your Own Metrics
Now let’s take further control of our metrics.
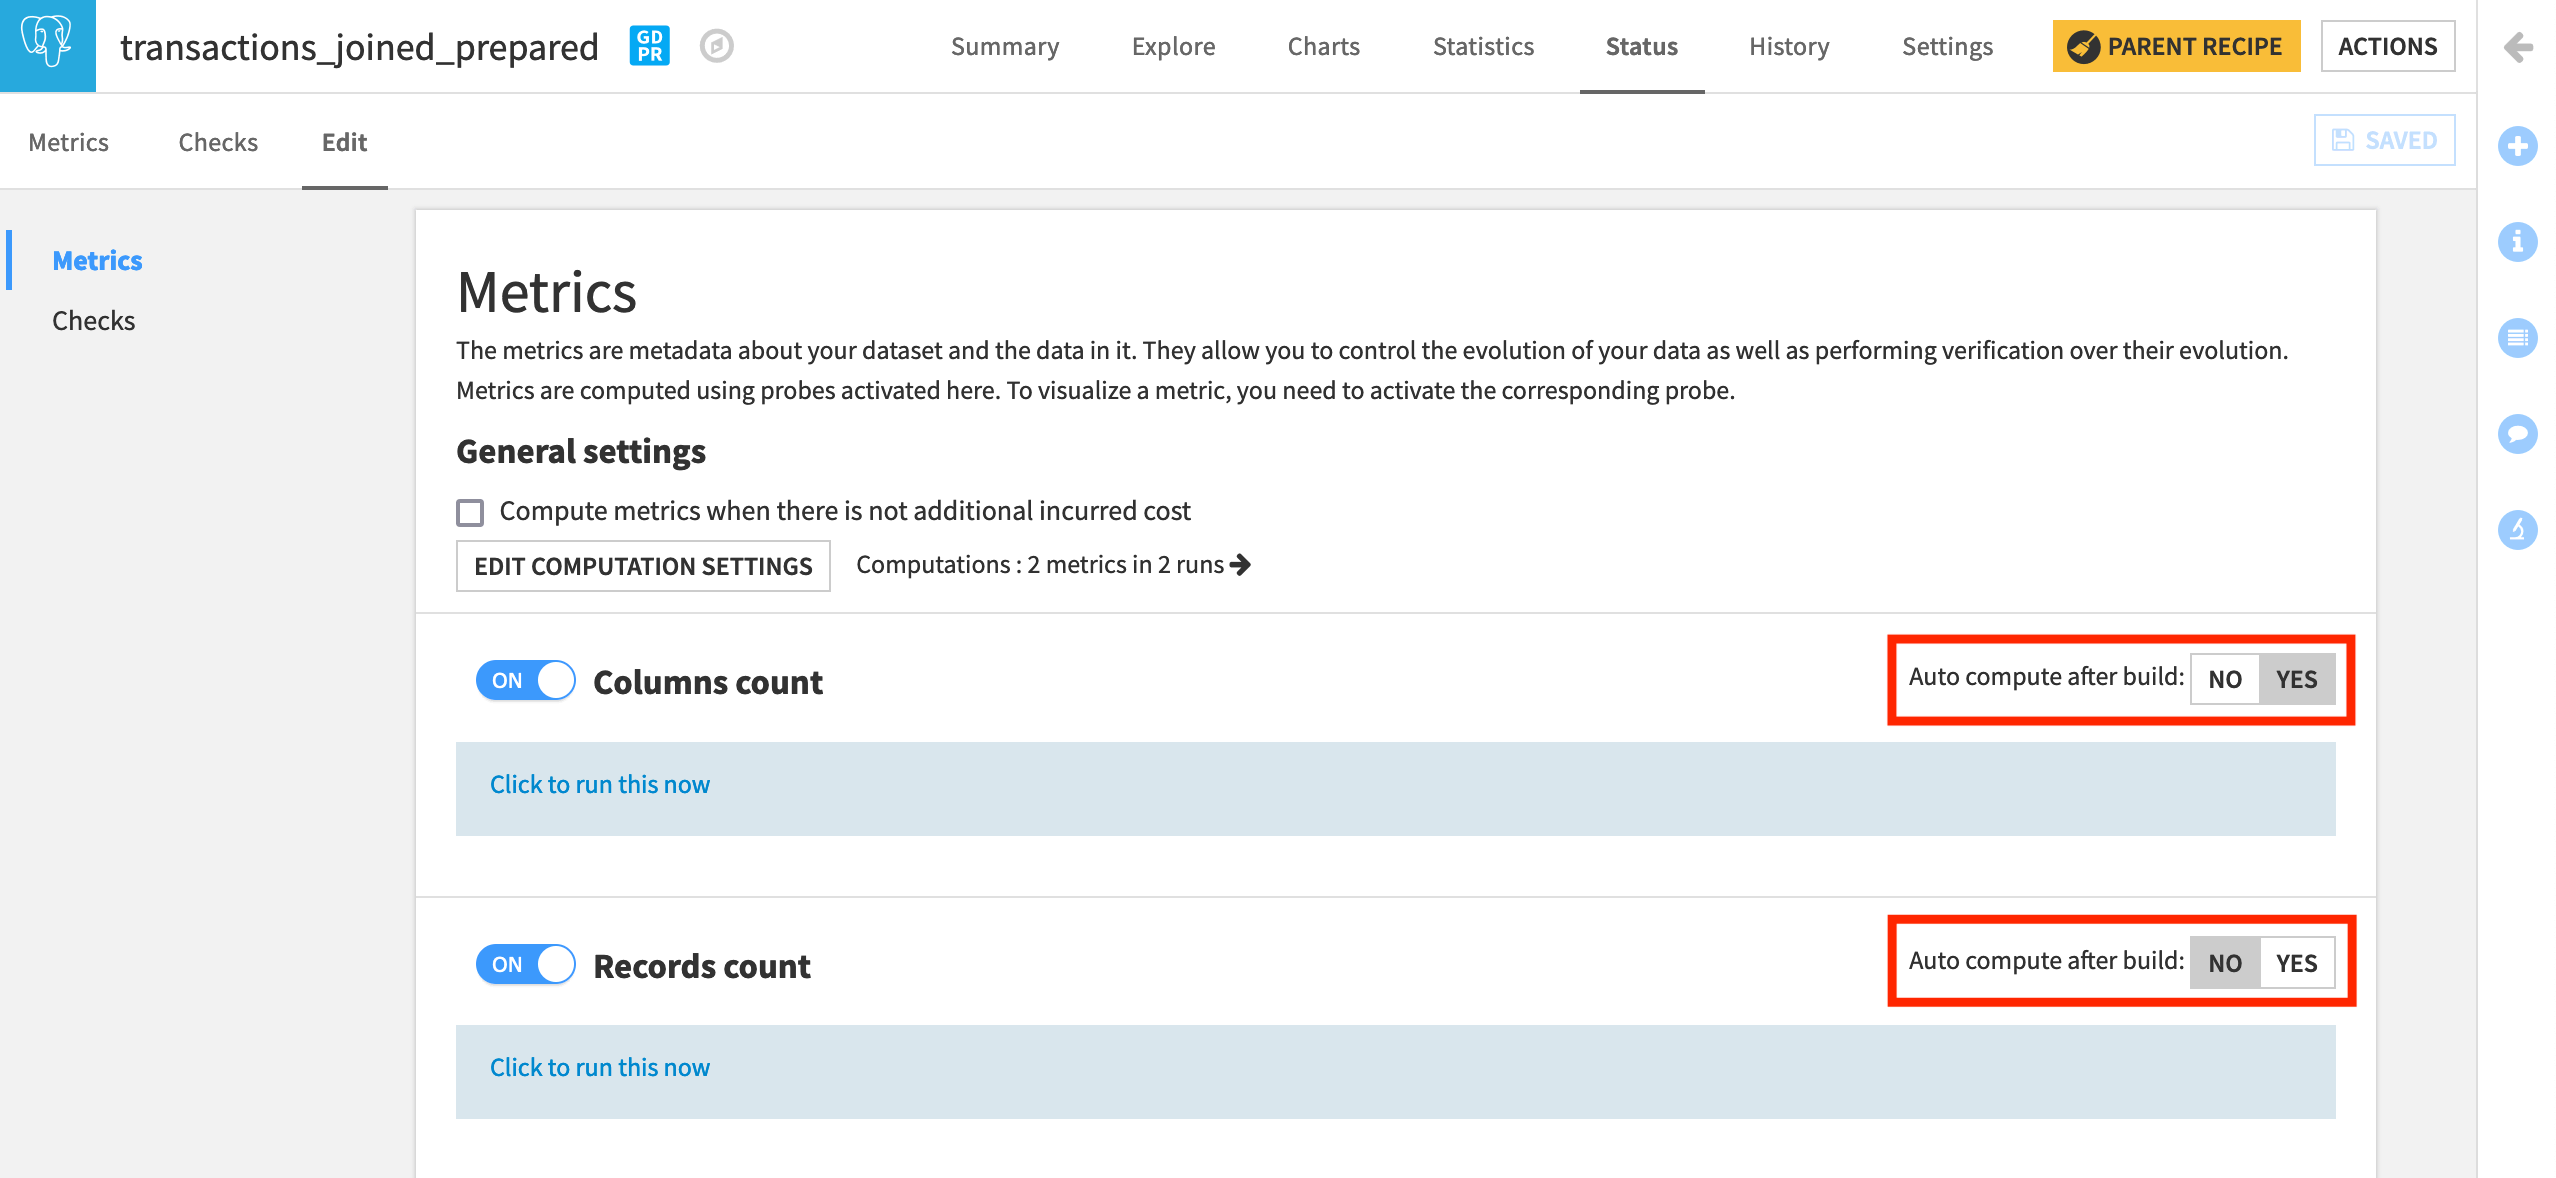
Navigate to the Edit subtab.
We can see that both “Column count” and “Record count” are switched ON. Only “Column count”, however, in this particular case, is set to auto-compute after build.
Now, let’s create a new metric from the available built-in options.
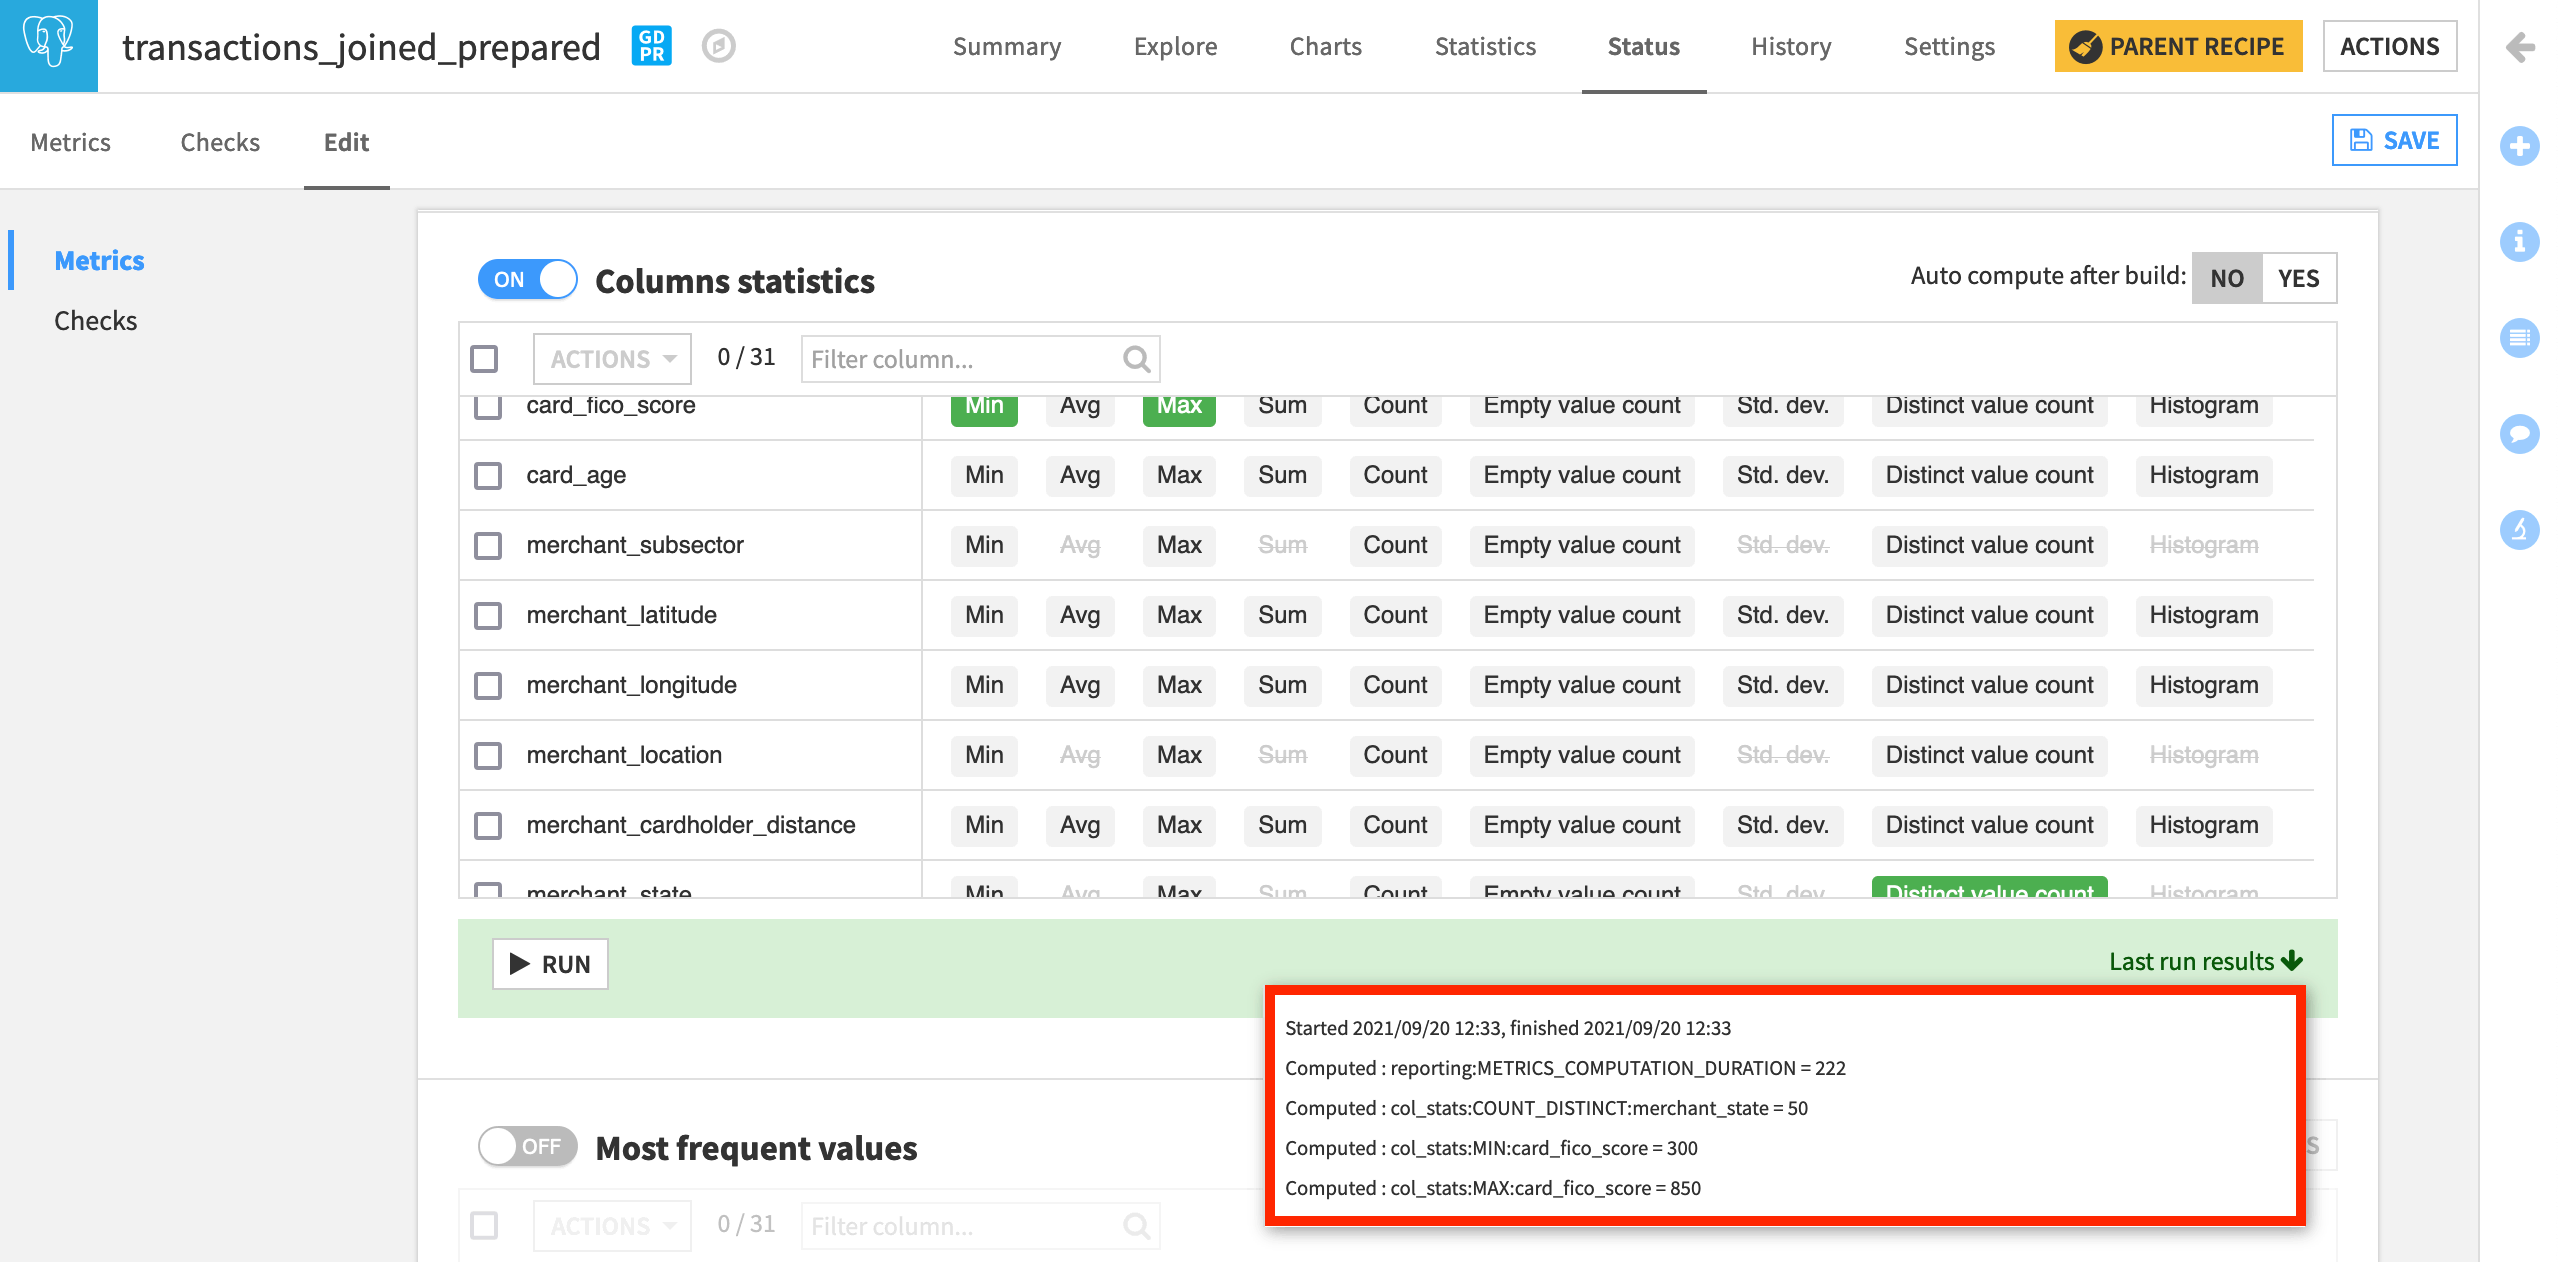
Turn on the Column statistics section. Here we can create metrics out of basic statistics like the minimum, maximum, or count of any column in the dataset.
By definition, FICO scores, a US system of scoring credit worthiness, range from 300 to 850.
With this range in mind, let’s track the Min and Max of card_fico_score.
Also, select the Distinct value count of merchant_state.
From this screen, run the probe to compute the three requested metrics.
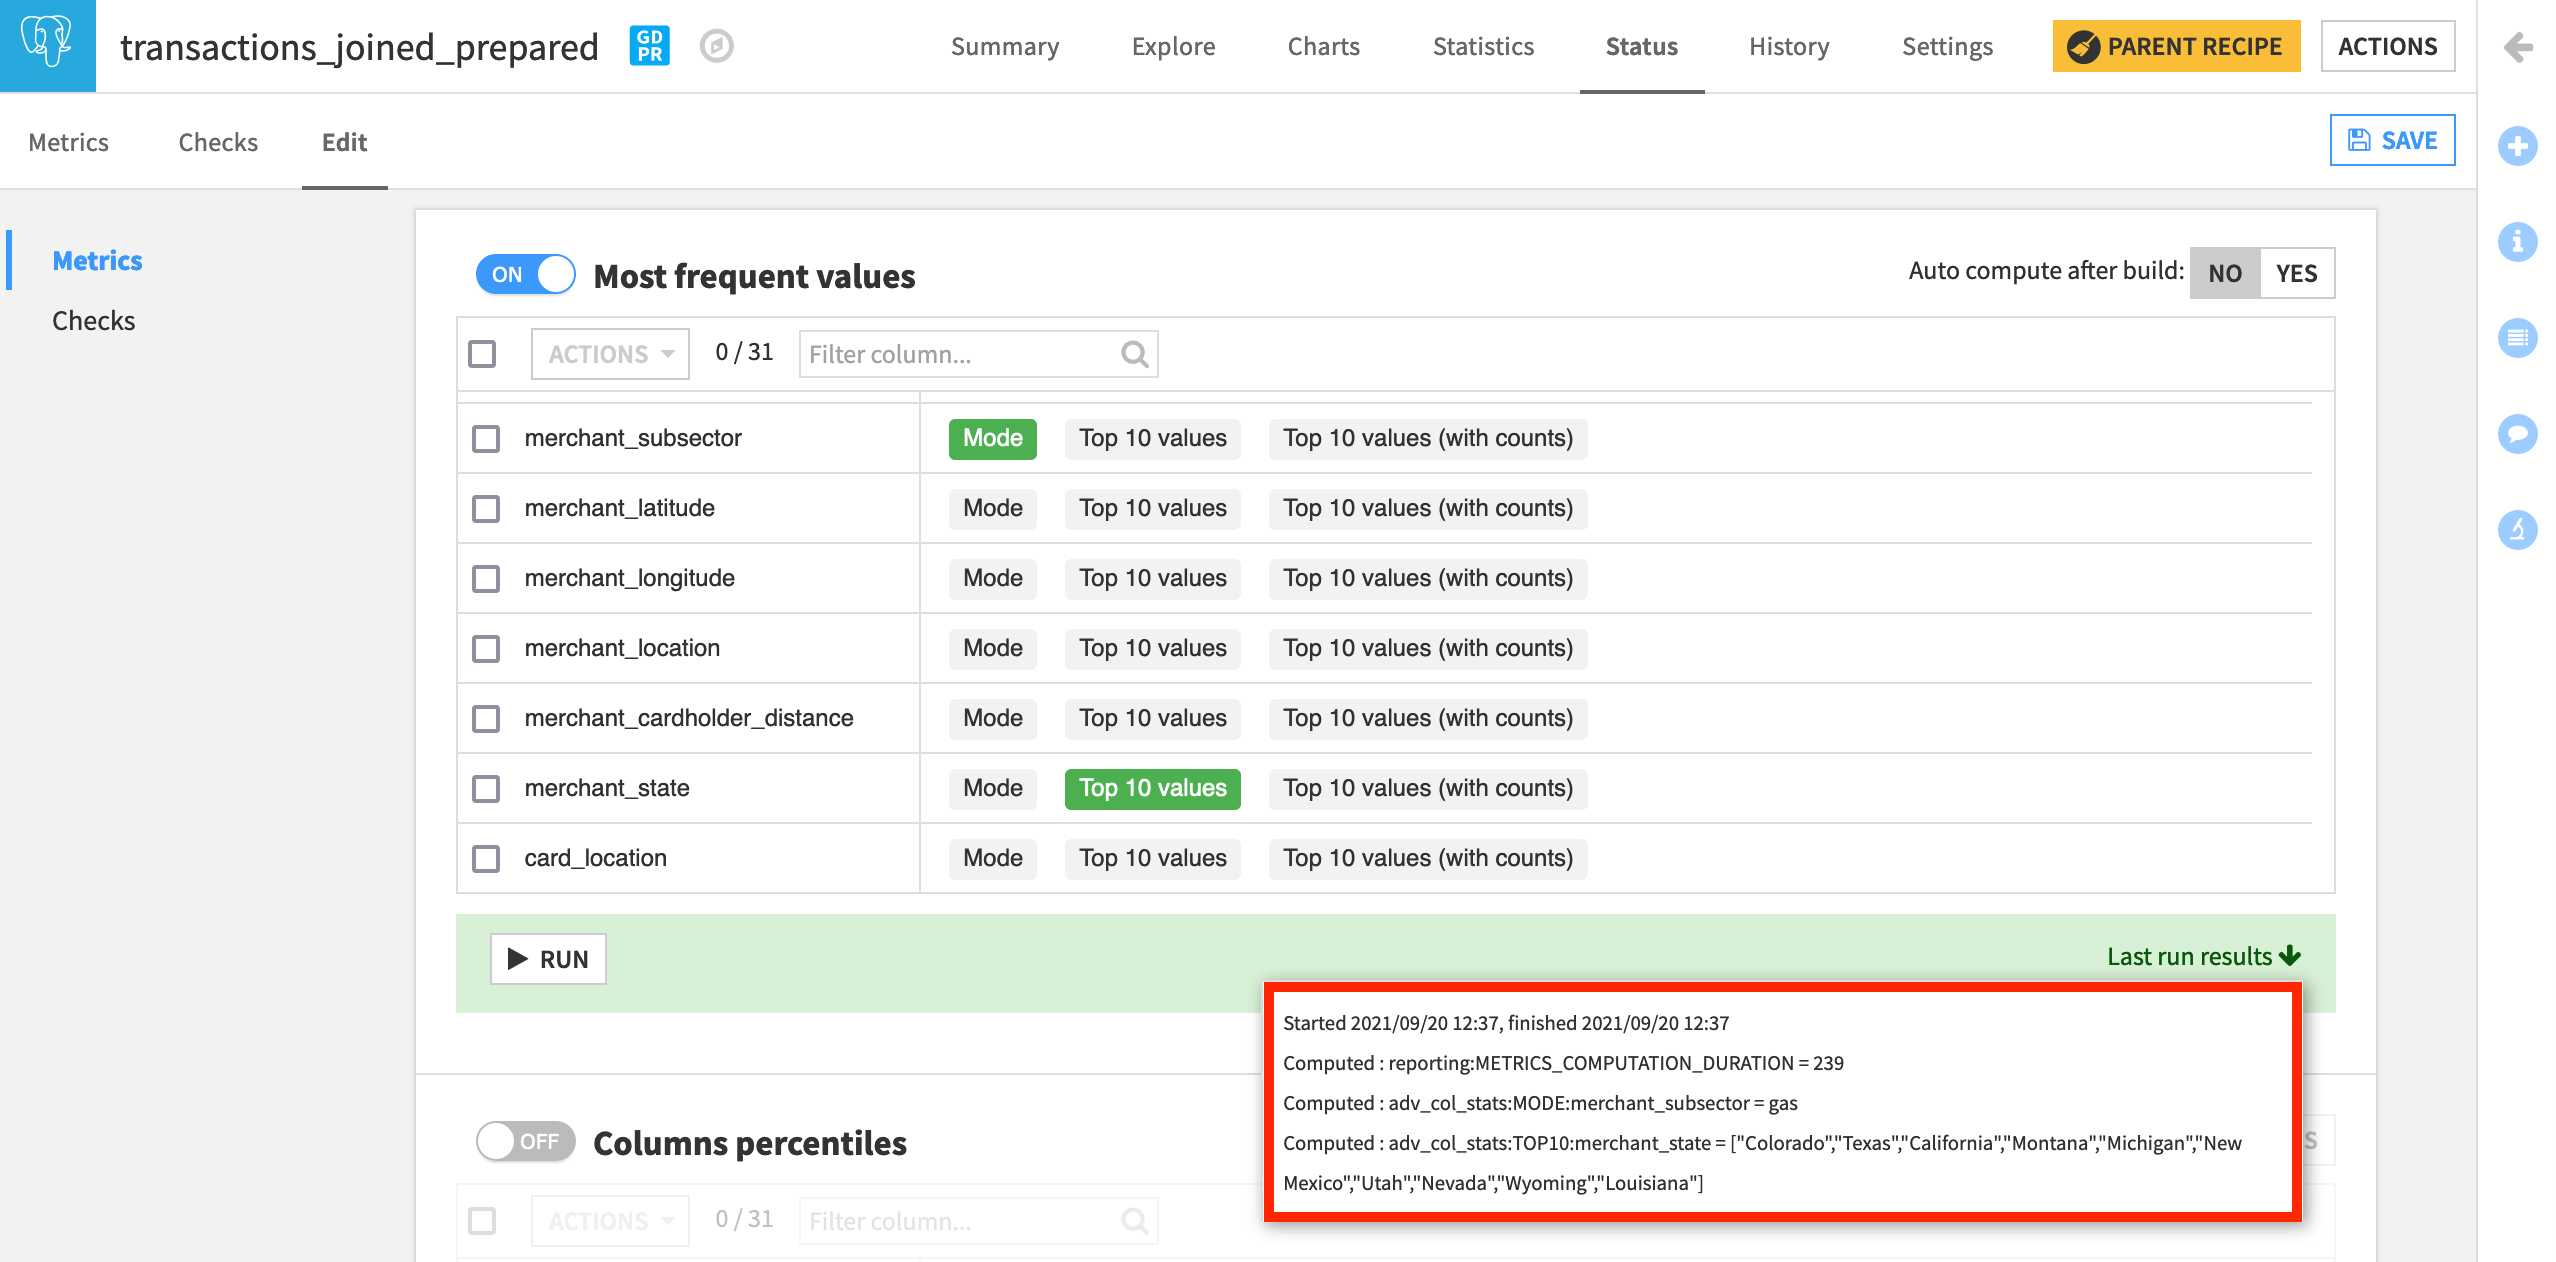
The next section of metrics allows us to compute the most frequent values of a column.
Turn on the section Most frequent values.
Select the Mode of merchant_subsector and the Top 10 values of merchant_state.
Click to run this probe as well and see the last run results.
Note
In addition to these kinds of built-in metrics, we can also define custom metrics with Python, SQL, or plugins. We’ll explore these in another lesson.
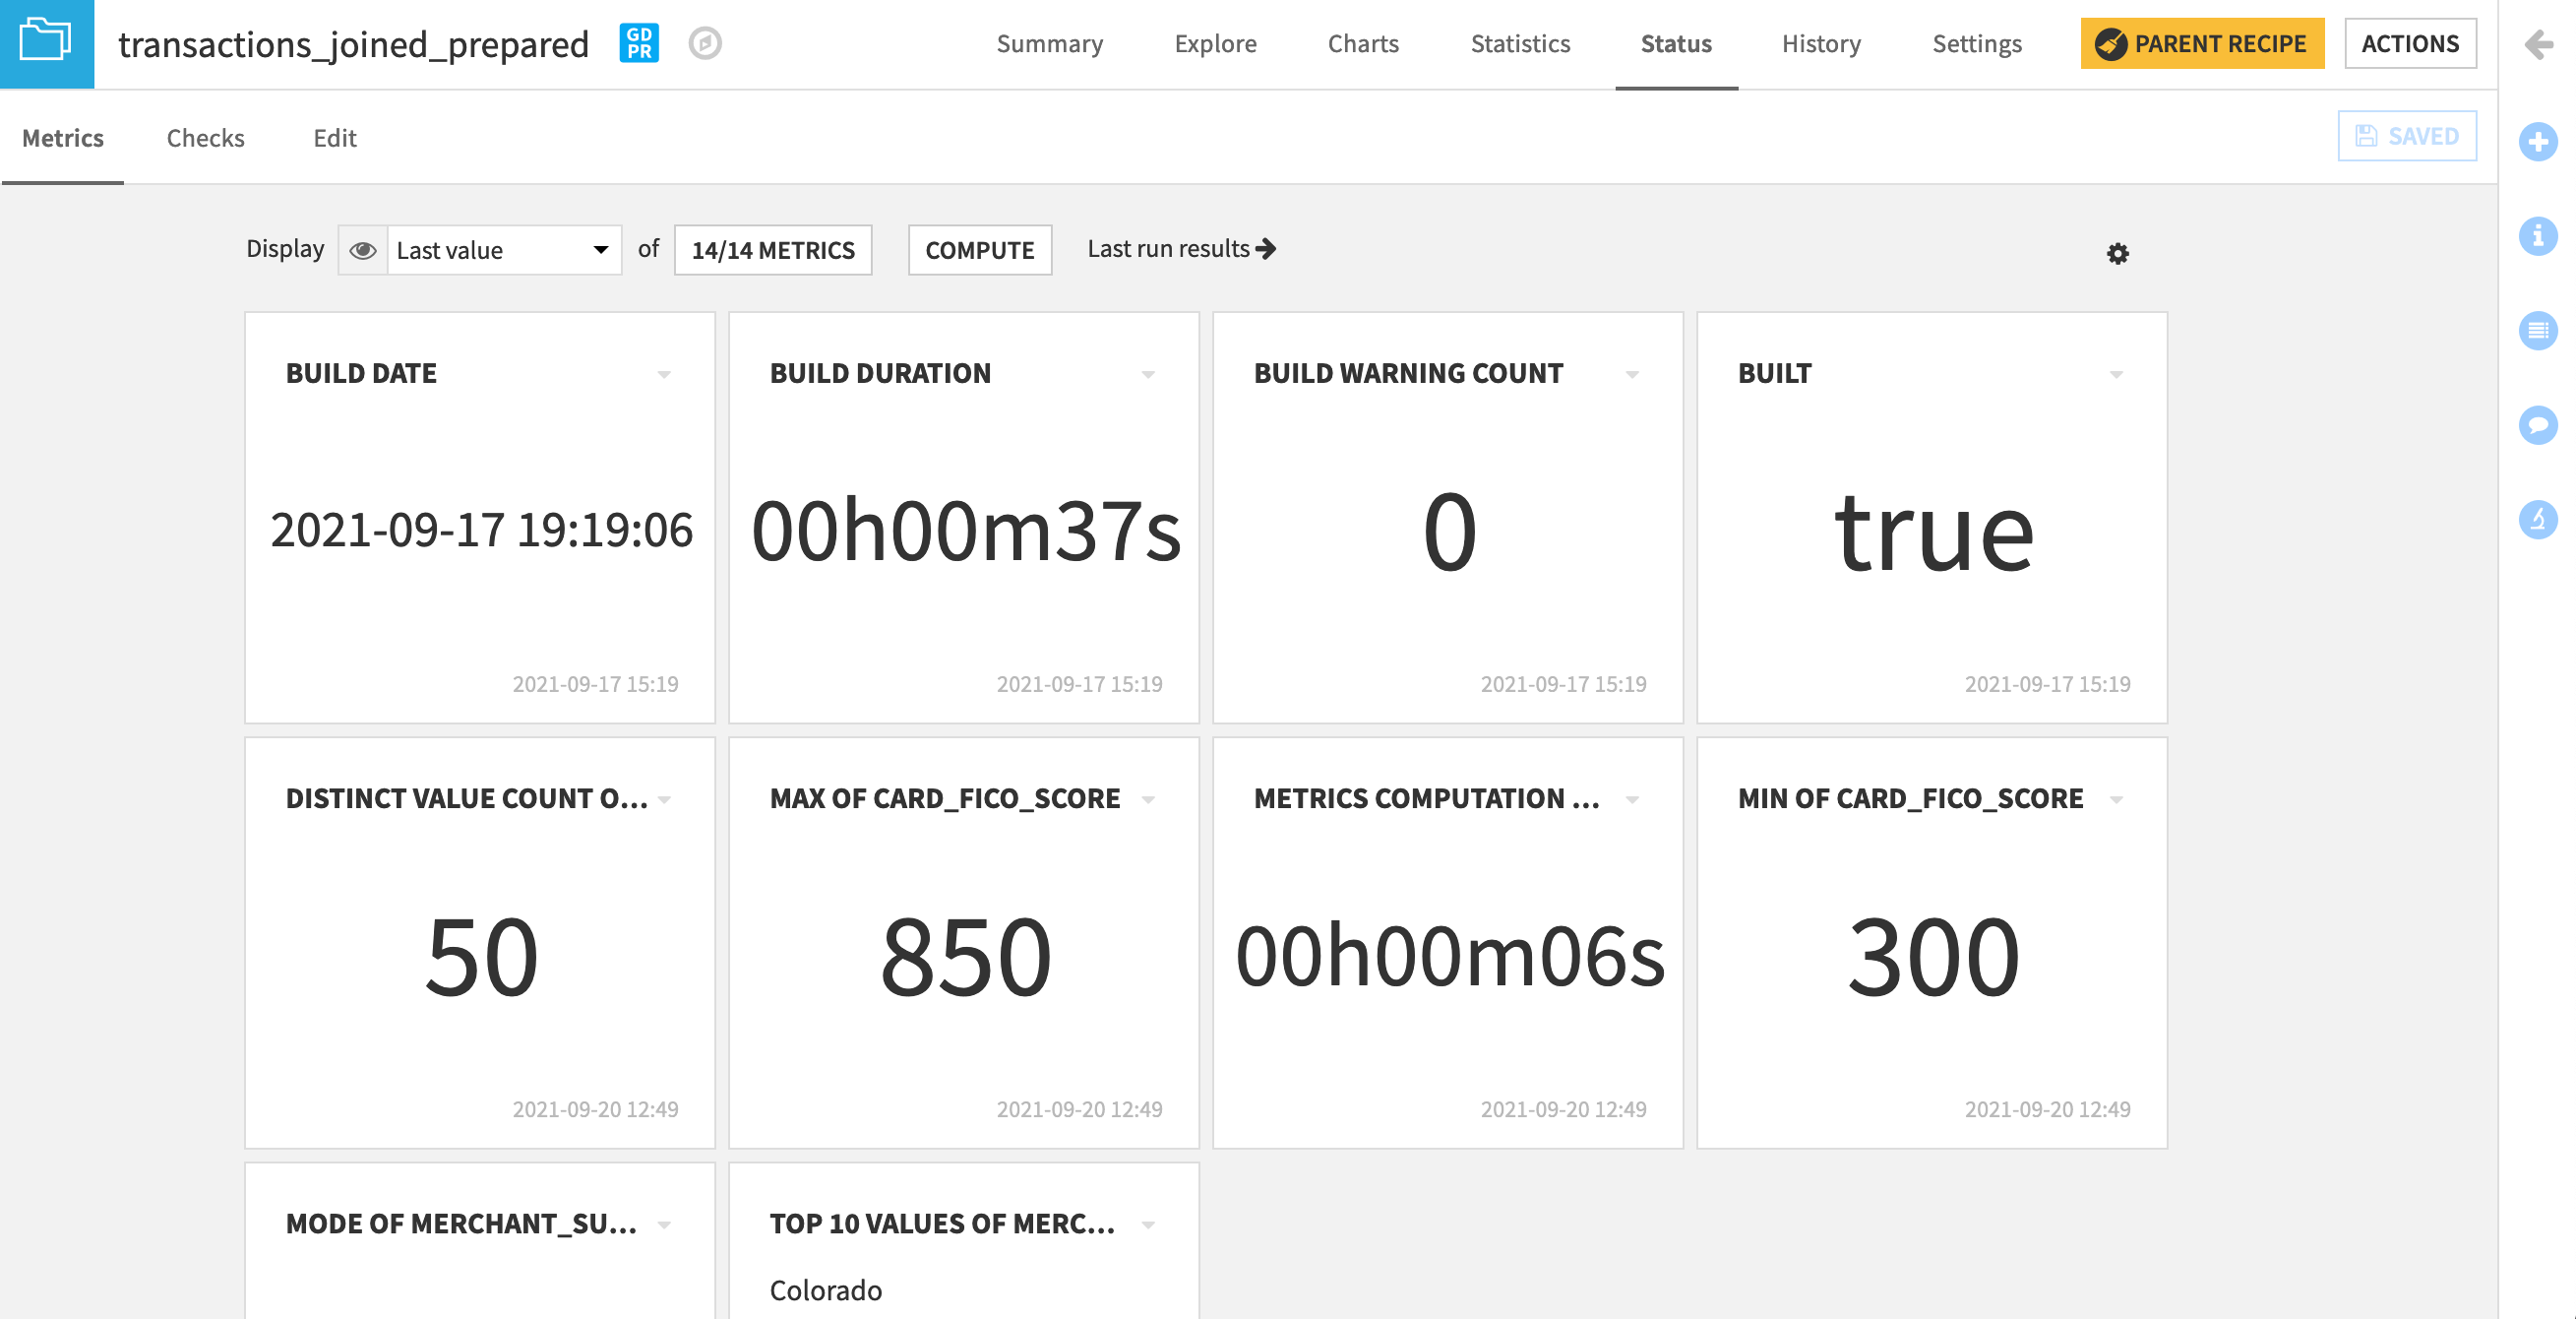
When returning to the Metrics subtab, we find our newly-created metrics as options available to be displayed.
Click on the button showing the number of metrics currently displayed, and Add all.
Click Compute to calculate the metrics if not already done so.
Experiment with different views by changing the Display from “Last value”, to “History”, to “Columns”.
Create Your Own Checks
Now let’s use these metrics to establish checks on the dataset.
Navigate to the Checks subtab.
None exist yet so create one in the Edit tab.
By definition, we know FICO scores range from 300 to 850. If a value is outside of this range, we will assume there must be some kind of data quality problem, and we want a failure notice.
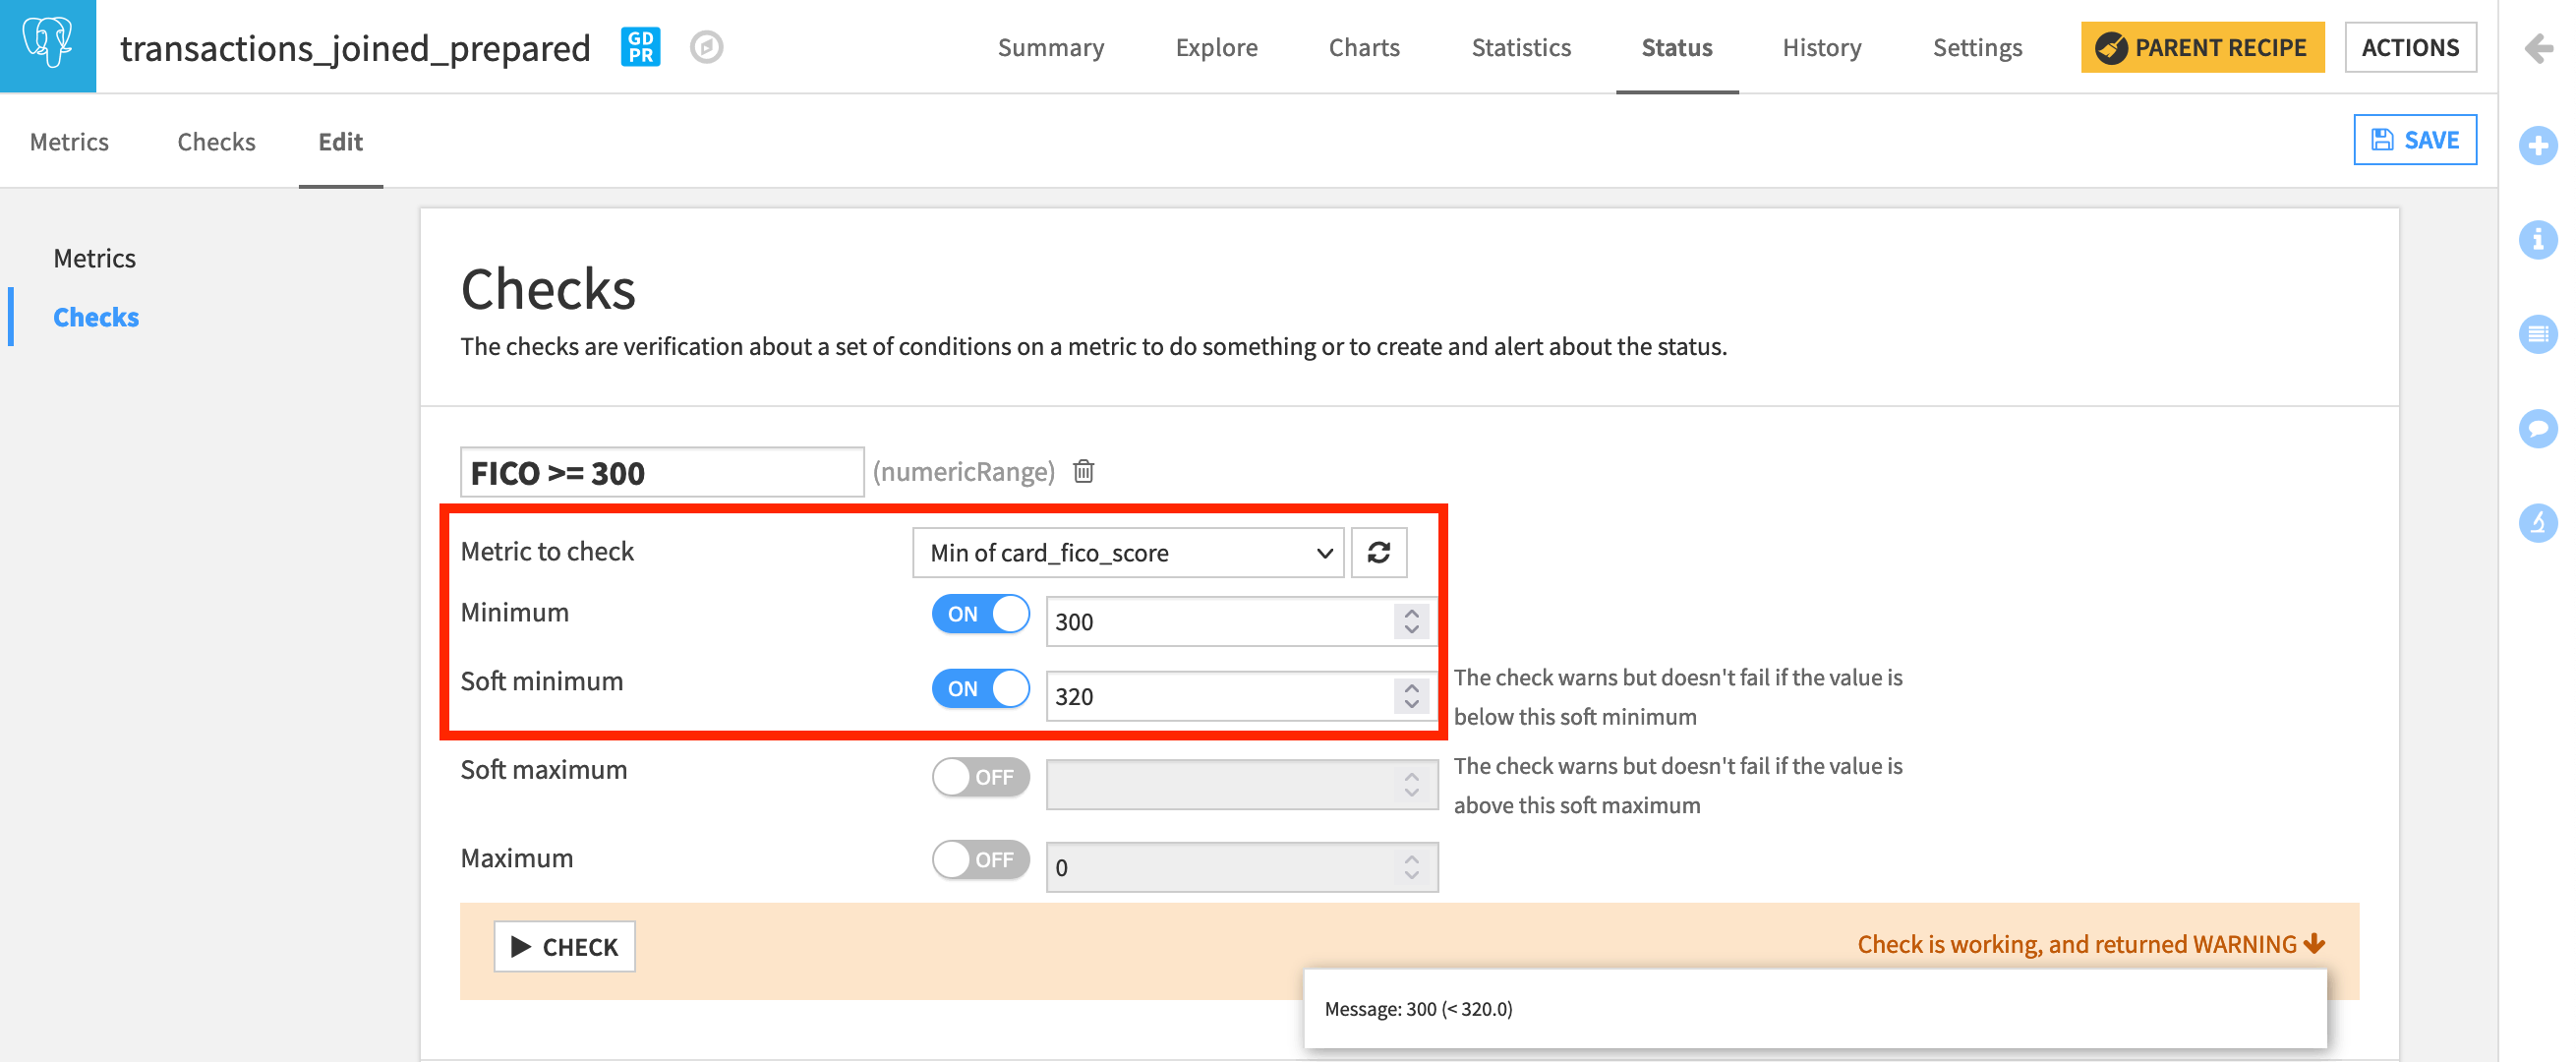
Under “Add a new check”, select Metric value is in a numeric range.
Name it
FICO >= 300.Choose Min of card_fico_score as the metric.
Turn the Minimum ON, and set it to
300.Click Check to see how it will work. It should return “OK”, and the message 300. We could have found the same result in the Analyze tool.
Note
When we check if a metric is in a numeric range, we have the ability to define a hard or soft maximum or minimum, depending on whether we want to trigger an error or a warning.
A value less than the minimum or greater than the maximum value produces an error.
A value less than the soft minimum or greater than the soft maximum produces a warning.
Let’s test this out on the same check.
Change the minimum of the “FICO >= 300” check from 300 to
320and run the check. Instead of returning “OK”, it returns an error because we have values in the dataset less than 320.Reset the minimum to
300. Then turn on a soft minimum of320(a very risky credit score). Now the check returns “WARNING”.
We can follow a similar process to check the upper bound.
Under “Add a new check”, select Metric value is in a numeric range.
Name it
FICO <= 850.Choose Max of card_fico_score as the metric.
Set the Maximum to
850.Click Check to confirm it is working as intended.
Assuming that all of these transactions are from the United States, we know that there should not be more than 51 distinct values of merchant_state (including the District of Columbia as a state). We can create a check to monitor this.
Under “Add a new check”, select Metric value is in a numeric range.
Name it
Valid merchant_state.Choose Distinct value count of merchant_state as the metric.
Set the Maximum to
51.After running the check, it should return “OK”.
We can also check if a metric is within a set of categorical values. For example, our domain knowledge might create the expectation that the most frequent merchant_subsector should be “gas”. Let’s make this a check.
Under “Add a new check”, select Metric value is in a set of values.
Name it
'gas' is subsector mode.Choose Mode of merchant_subsector as the metric.
Add
gasas the value.After running the check, it should return “OK”.
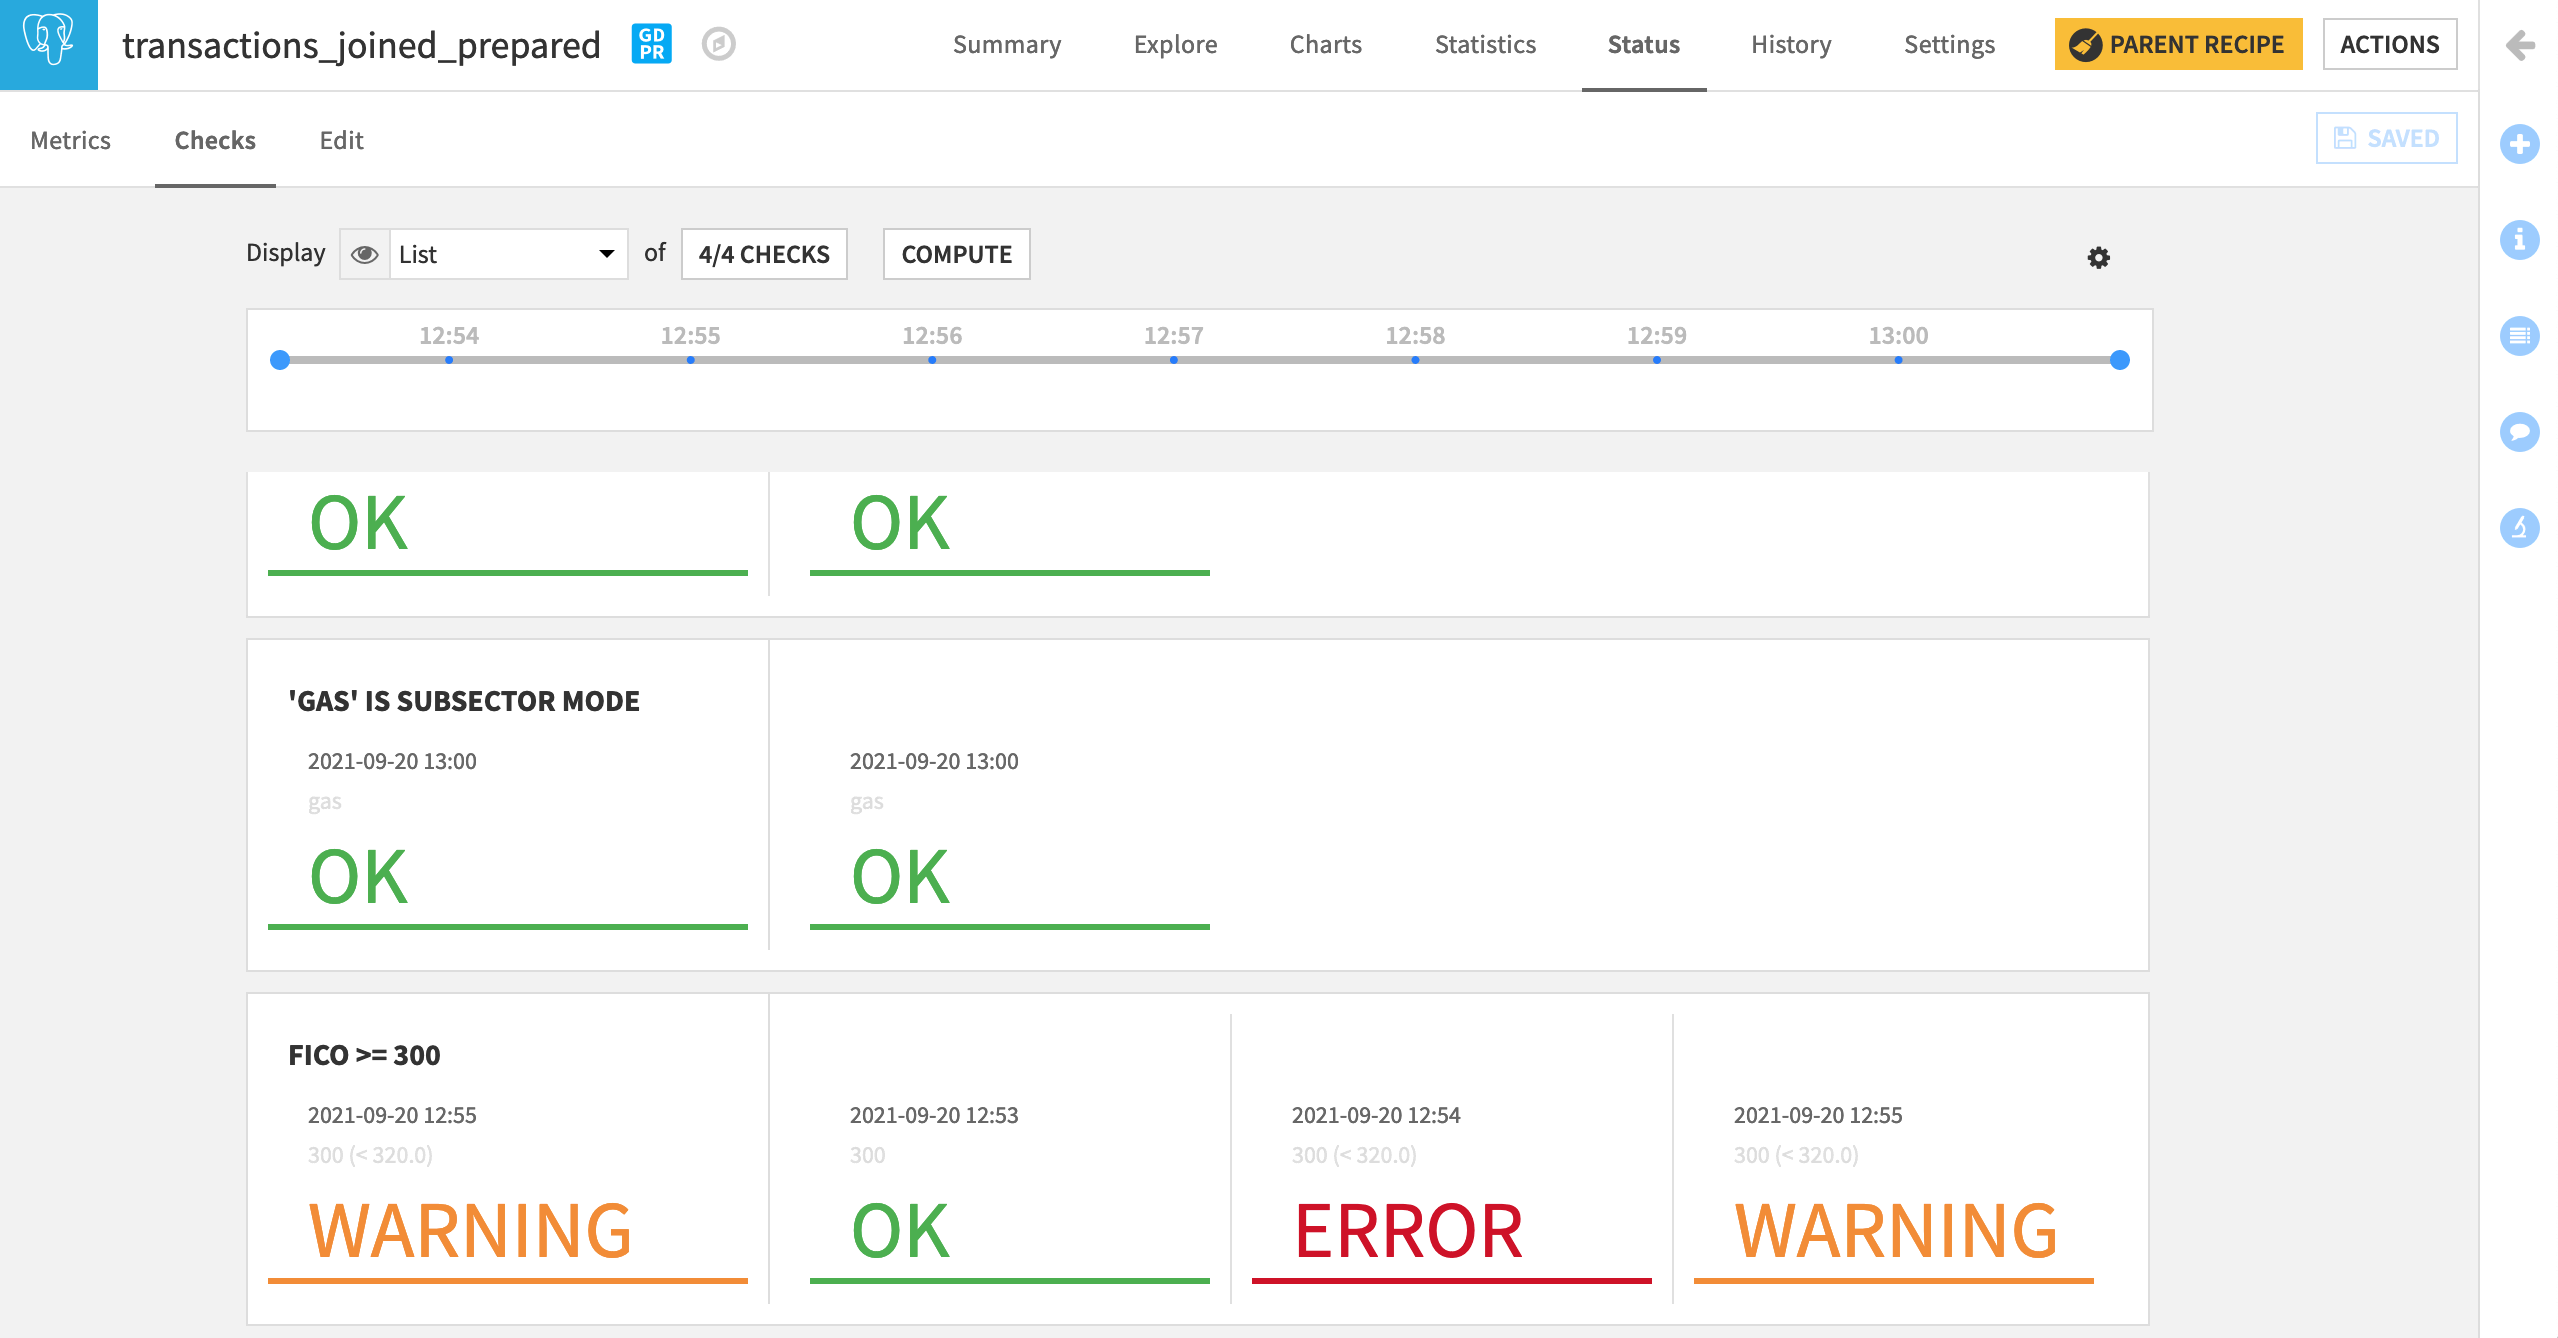
After saving the new checks, navigate from the Edit to the Checks tab.
Display all of the newly-created Checks.
Click Compute.
Note
We can also create custom checks with Python or plugins. We’ll see this in another lesson.
Model Metrics & Checks
Datasets are not the only Dataiku DSS object for which we can establish metrics and checks. Models are another object in need of close monitoring.
In the Flow, the green diamond represents the deployed model that predicts whether a credit card transaction will be authorized or not.
Select it, and Retrain it (non-recursively) from the Actions panel.
On opening the deployed model, we can see the active and previous versions. Note how the ROC AUC (or AUC), a common performance metric for classification models, is around 0.75.
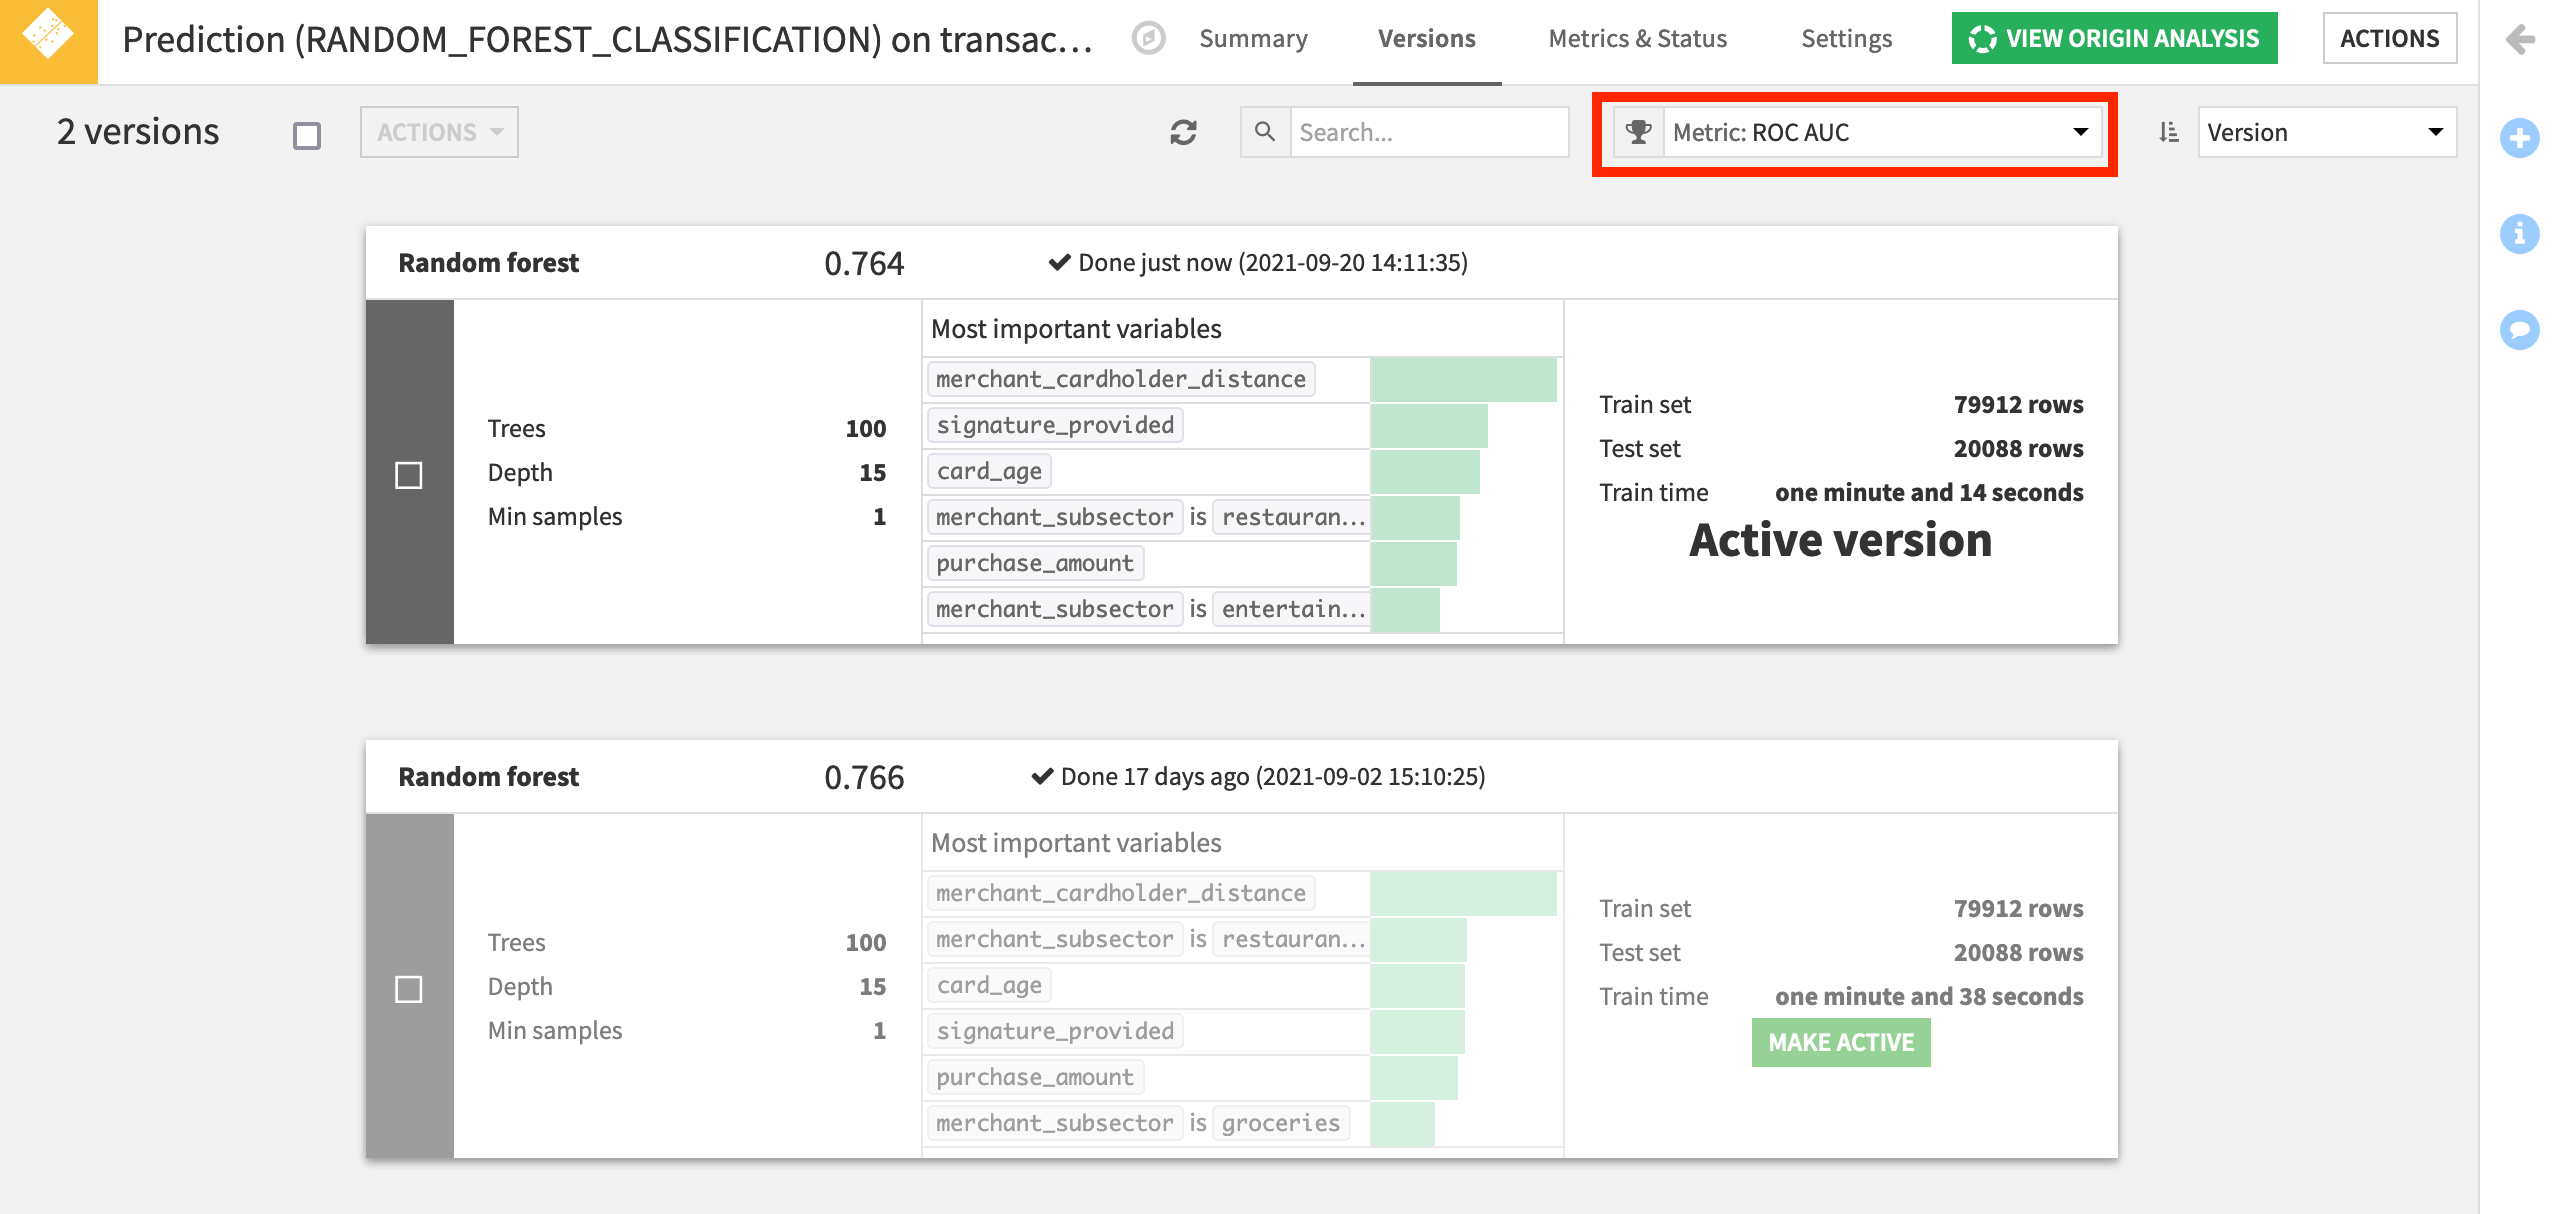
We can track this metric, along with many other common indicators of model performance.
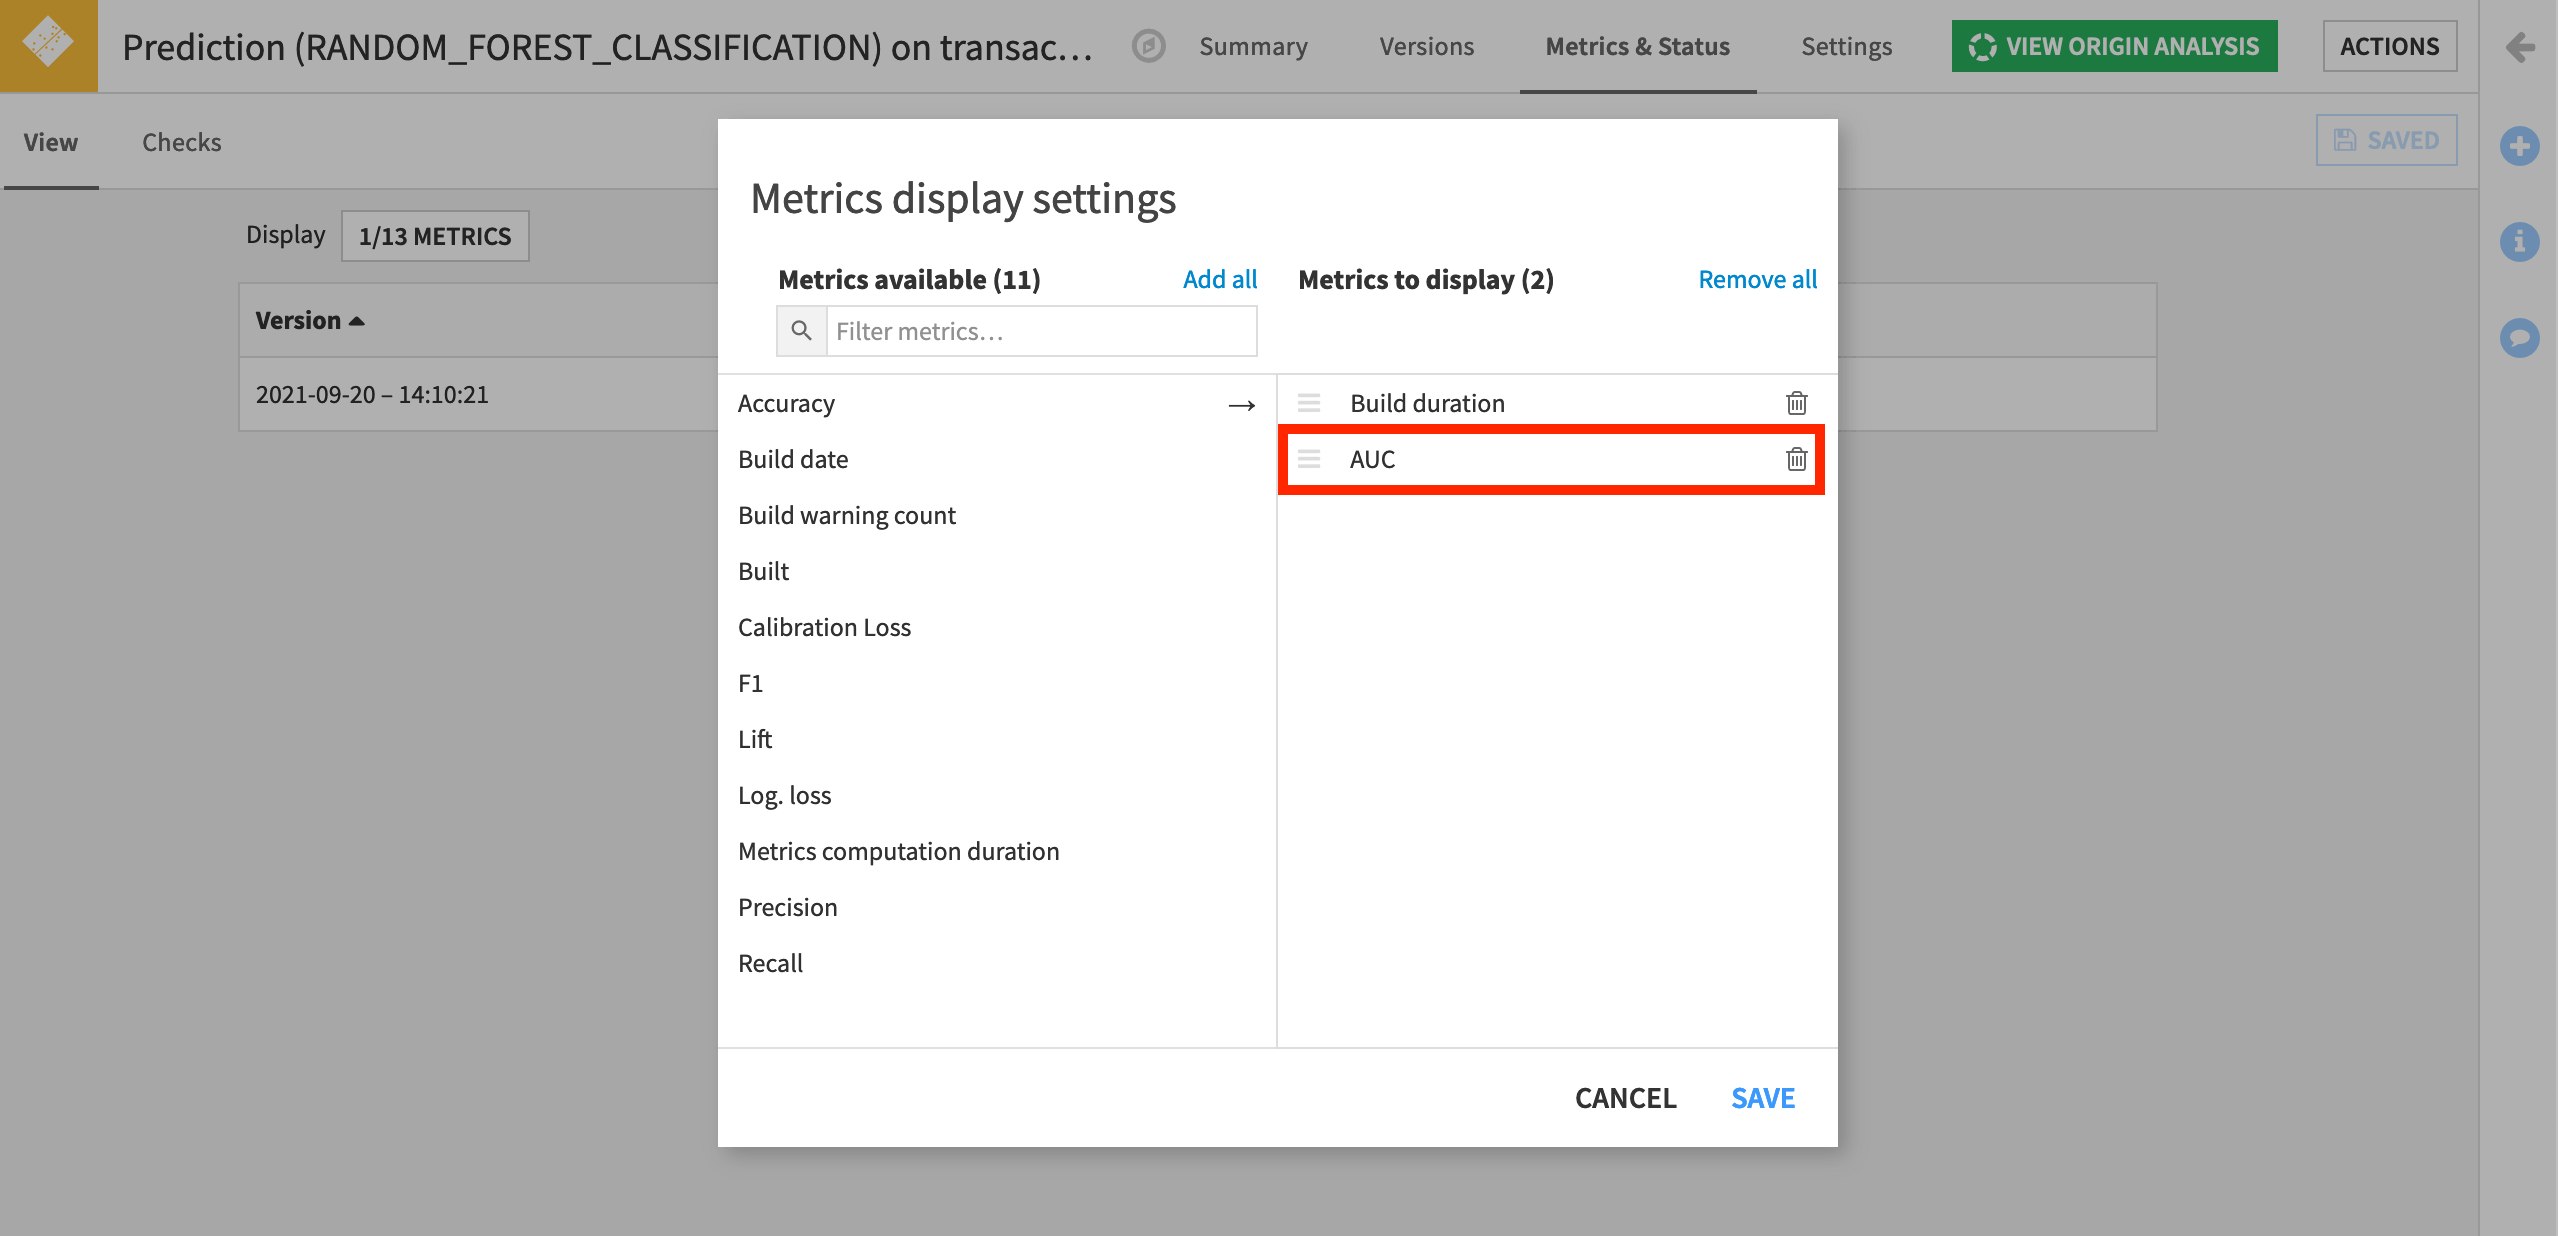
Navigate to the Metrics & Status tab of the deployed model object.
On the View subtab, click on the Display to show the built-in model metrics available.
Add and save AUC to the list of metrics to display. Other kinds of performance metrics, such as accuracy, precision and recall, are also available.
Now let’s create a check to monitor this metric.
Navigate to the Settings tab.
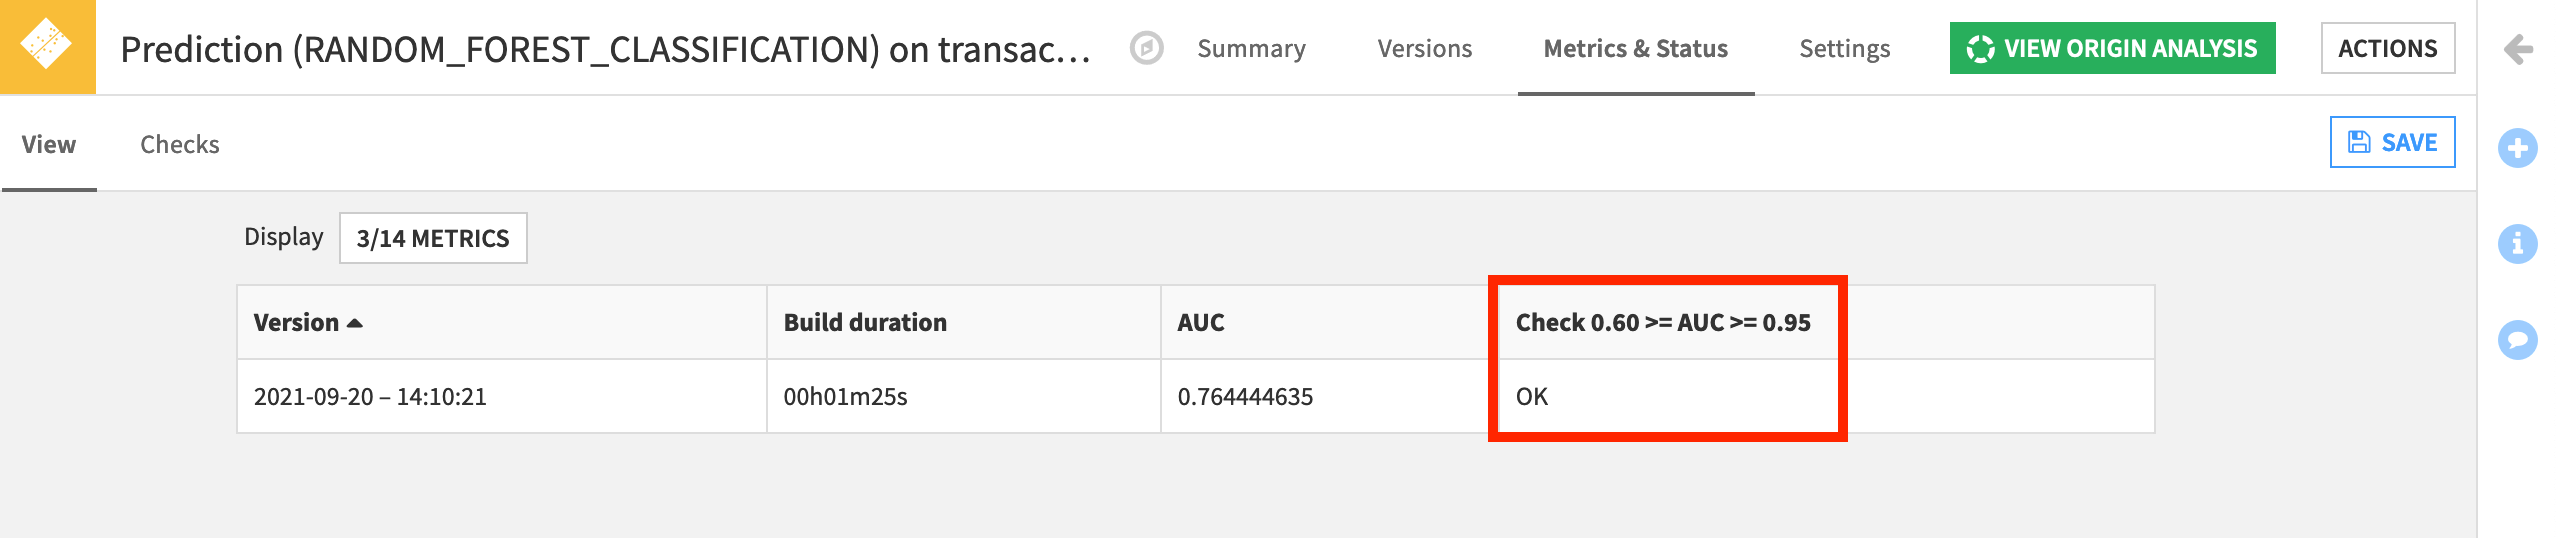
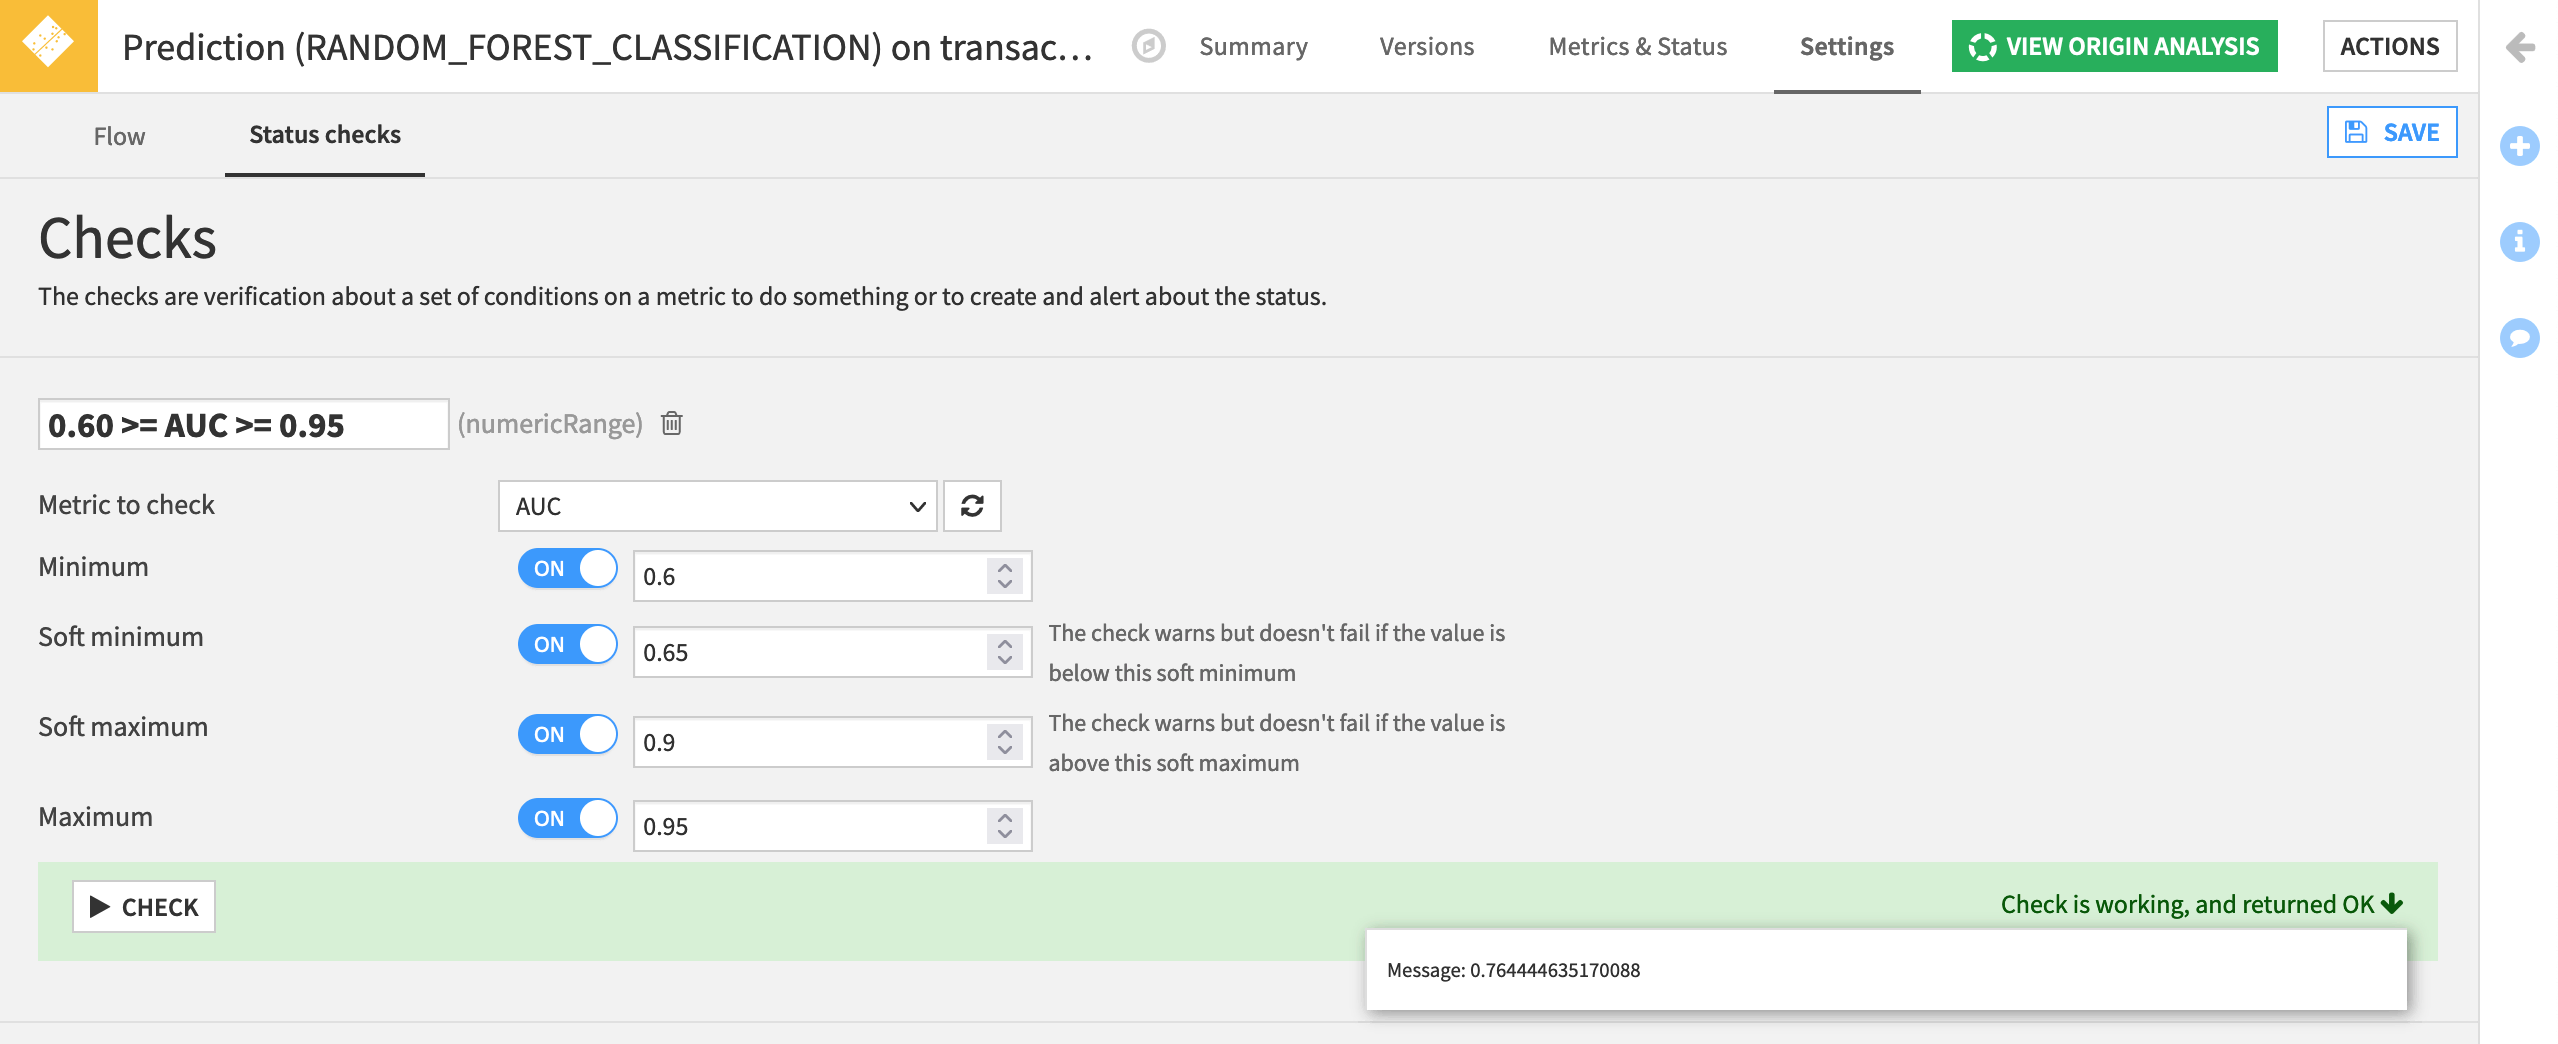
Under the Status checks subtab, add a new check for Metric value is in a numeric range.
Name it
0.60 >= AUC >= 0.95.Select AUC as the metric to check.
Set a minimum to
0.6and a maximum of0.95to throw an error if the model performance has either degraded or become suspiciously high.Set a soft minimum of
0.65and a soft maximum of0.9to warn us if the performance of the deployed model has decreased or increased.Run the check to see if it is working. Save it.
Note
This AUC range is just an example. For your own use case, an allowable deviation in AUC may be very different.
Return to the Metrics & Status tab and add the new check to the Display.