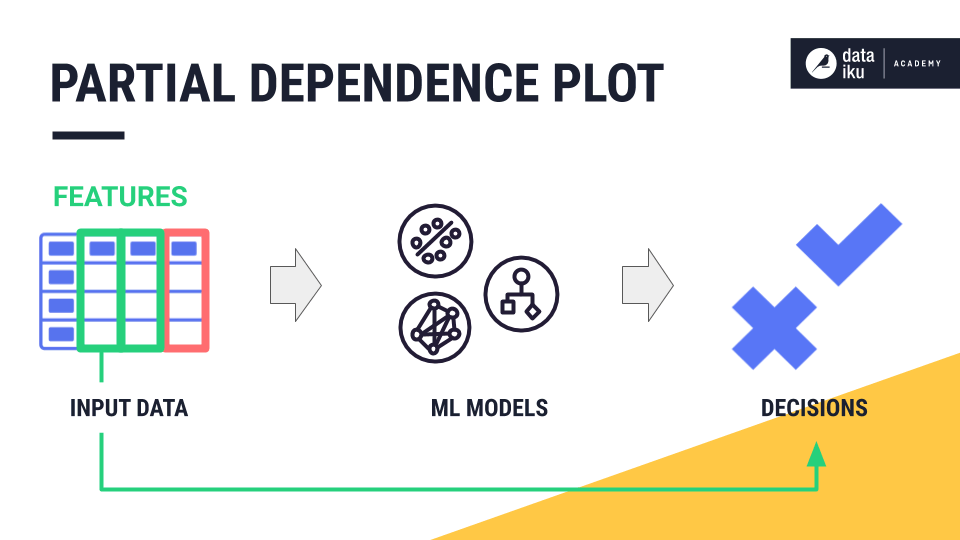
Concept: Partial Dependence
One way to understand the relationships between features and the target variable that you want to predict is through a partial dependence plot.
Note
The goal of a partial dependence plot is to demonstrate how a particular feature affects the model’s predictions.
For example, in the case of a model that classifies credit card applications, we might ask, “How do approval rates differ across a feature such as “gender” or “race”?”
With that goal in mind, let’s take a closer look at how to build and interpret a partial dependence plot in DSS. In our hospital readmission case study, we built a random forest model to predict whether a patient would be readmitted to the hospital. How would we explain these predictions to a hospital administrator? Or even perform sanity checks that the model is working as we expect?
From the model report page, we can see an option for Partial dependence. There, we can adjust sample settings and then investigate either numeric or categorical features.
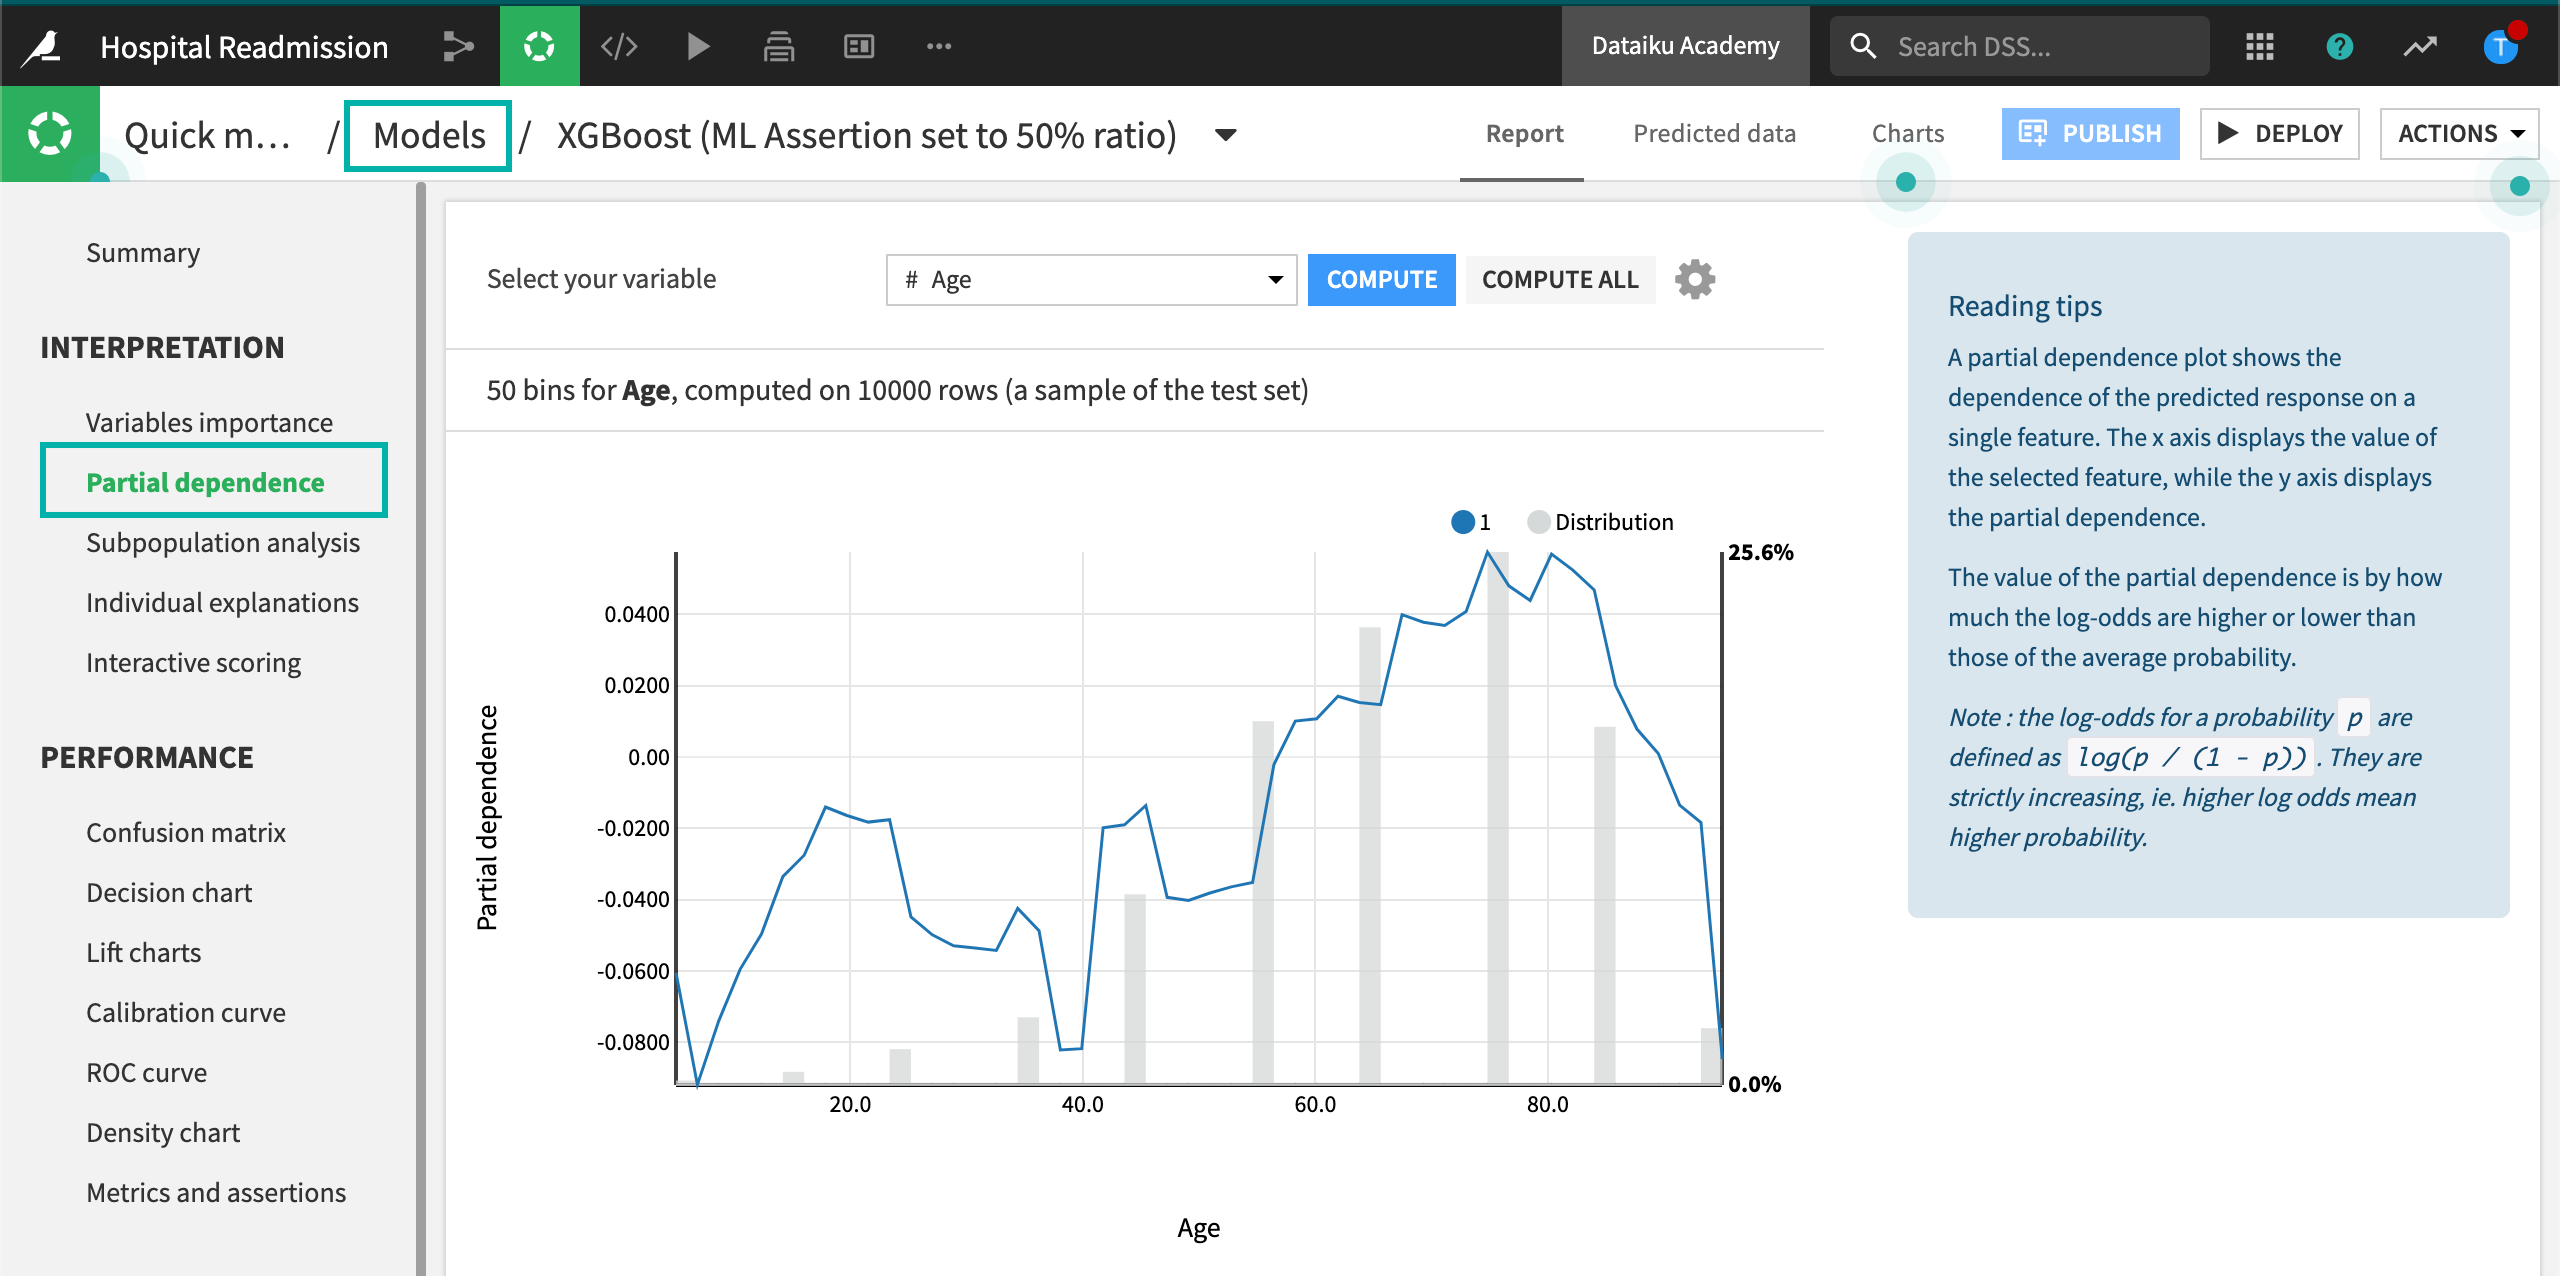
In this case, we might want to investigate questions like, “To what extent does a patient’s chances of being readmitted to the hospital depend on features like age, gender, or race?”
The chosen feature appears on the x-axis, while the y-axis plots the degree of partial dependence. The partial dependence value shows how the probability of being in the outcome class changes across different values of the feature.
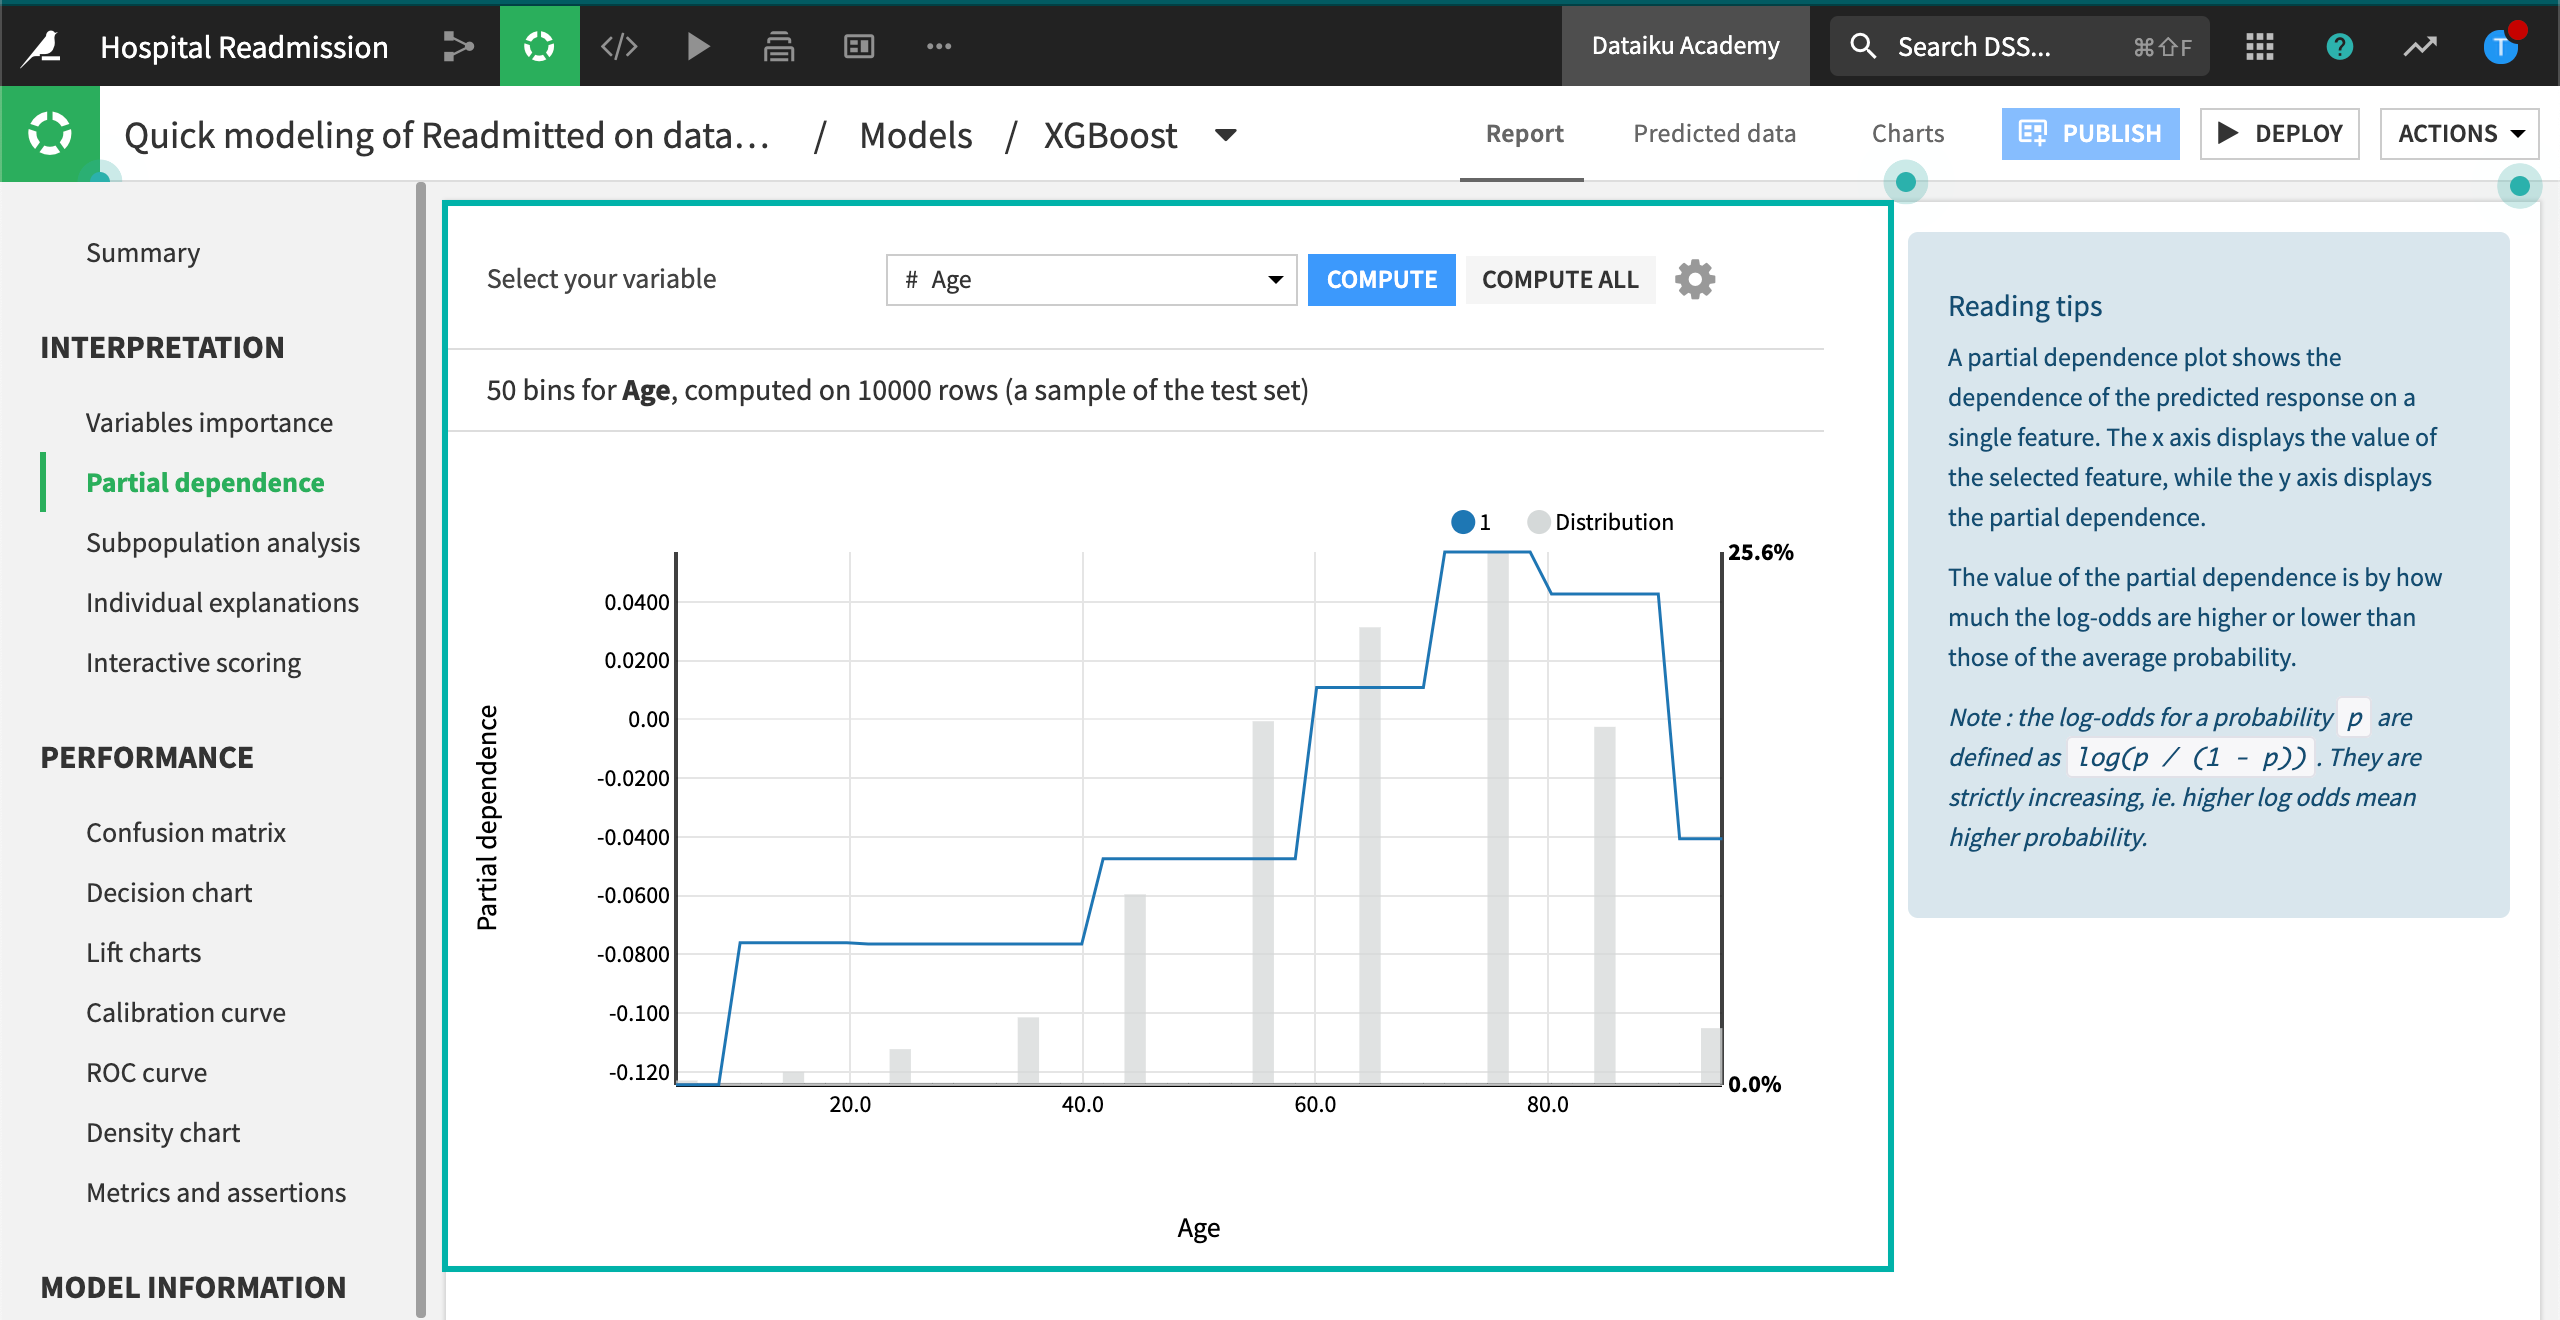
Let’s first examine the trend line. Is the relationship between the feature and target positive or negative? In this case, we can see that as age increases, the patient is more likely to be readmitted to the hospital.
In addition to the trend line, we also have the distribution of data. For example, we might be surprised that the probability of readmission goes down for the oldest age bin, but the small amount of data in this bracket could be a reason for the dip.
These plots are a valuable asset in the overall Explainable AI toolkit, as they offer insight into the relationships between features and the outcome–even for very complex black box models, such as neural networks.