Concept: Algorithms and Hyperparameters
The Modeling section of the Design tab lets us choose between the different machine learning algorithms available in DSS, optimize hyperparameters using a grid search, and leverage the different machine learning engines that are available.
Algorithms
DSS natively supports several algorithms that can be used to train predictive models depending on the machine learning task: Clustering or Prediction (Classification or Regression). We can also choose to use our own machine learning algorithm, by adding a custom Python model.
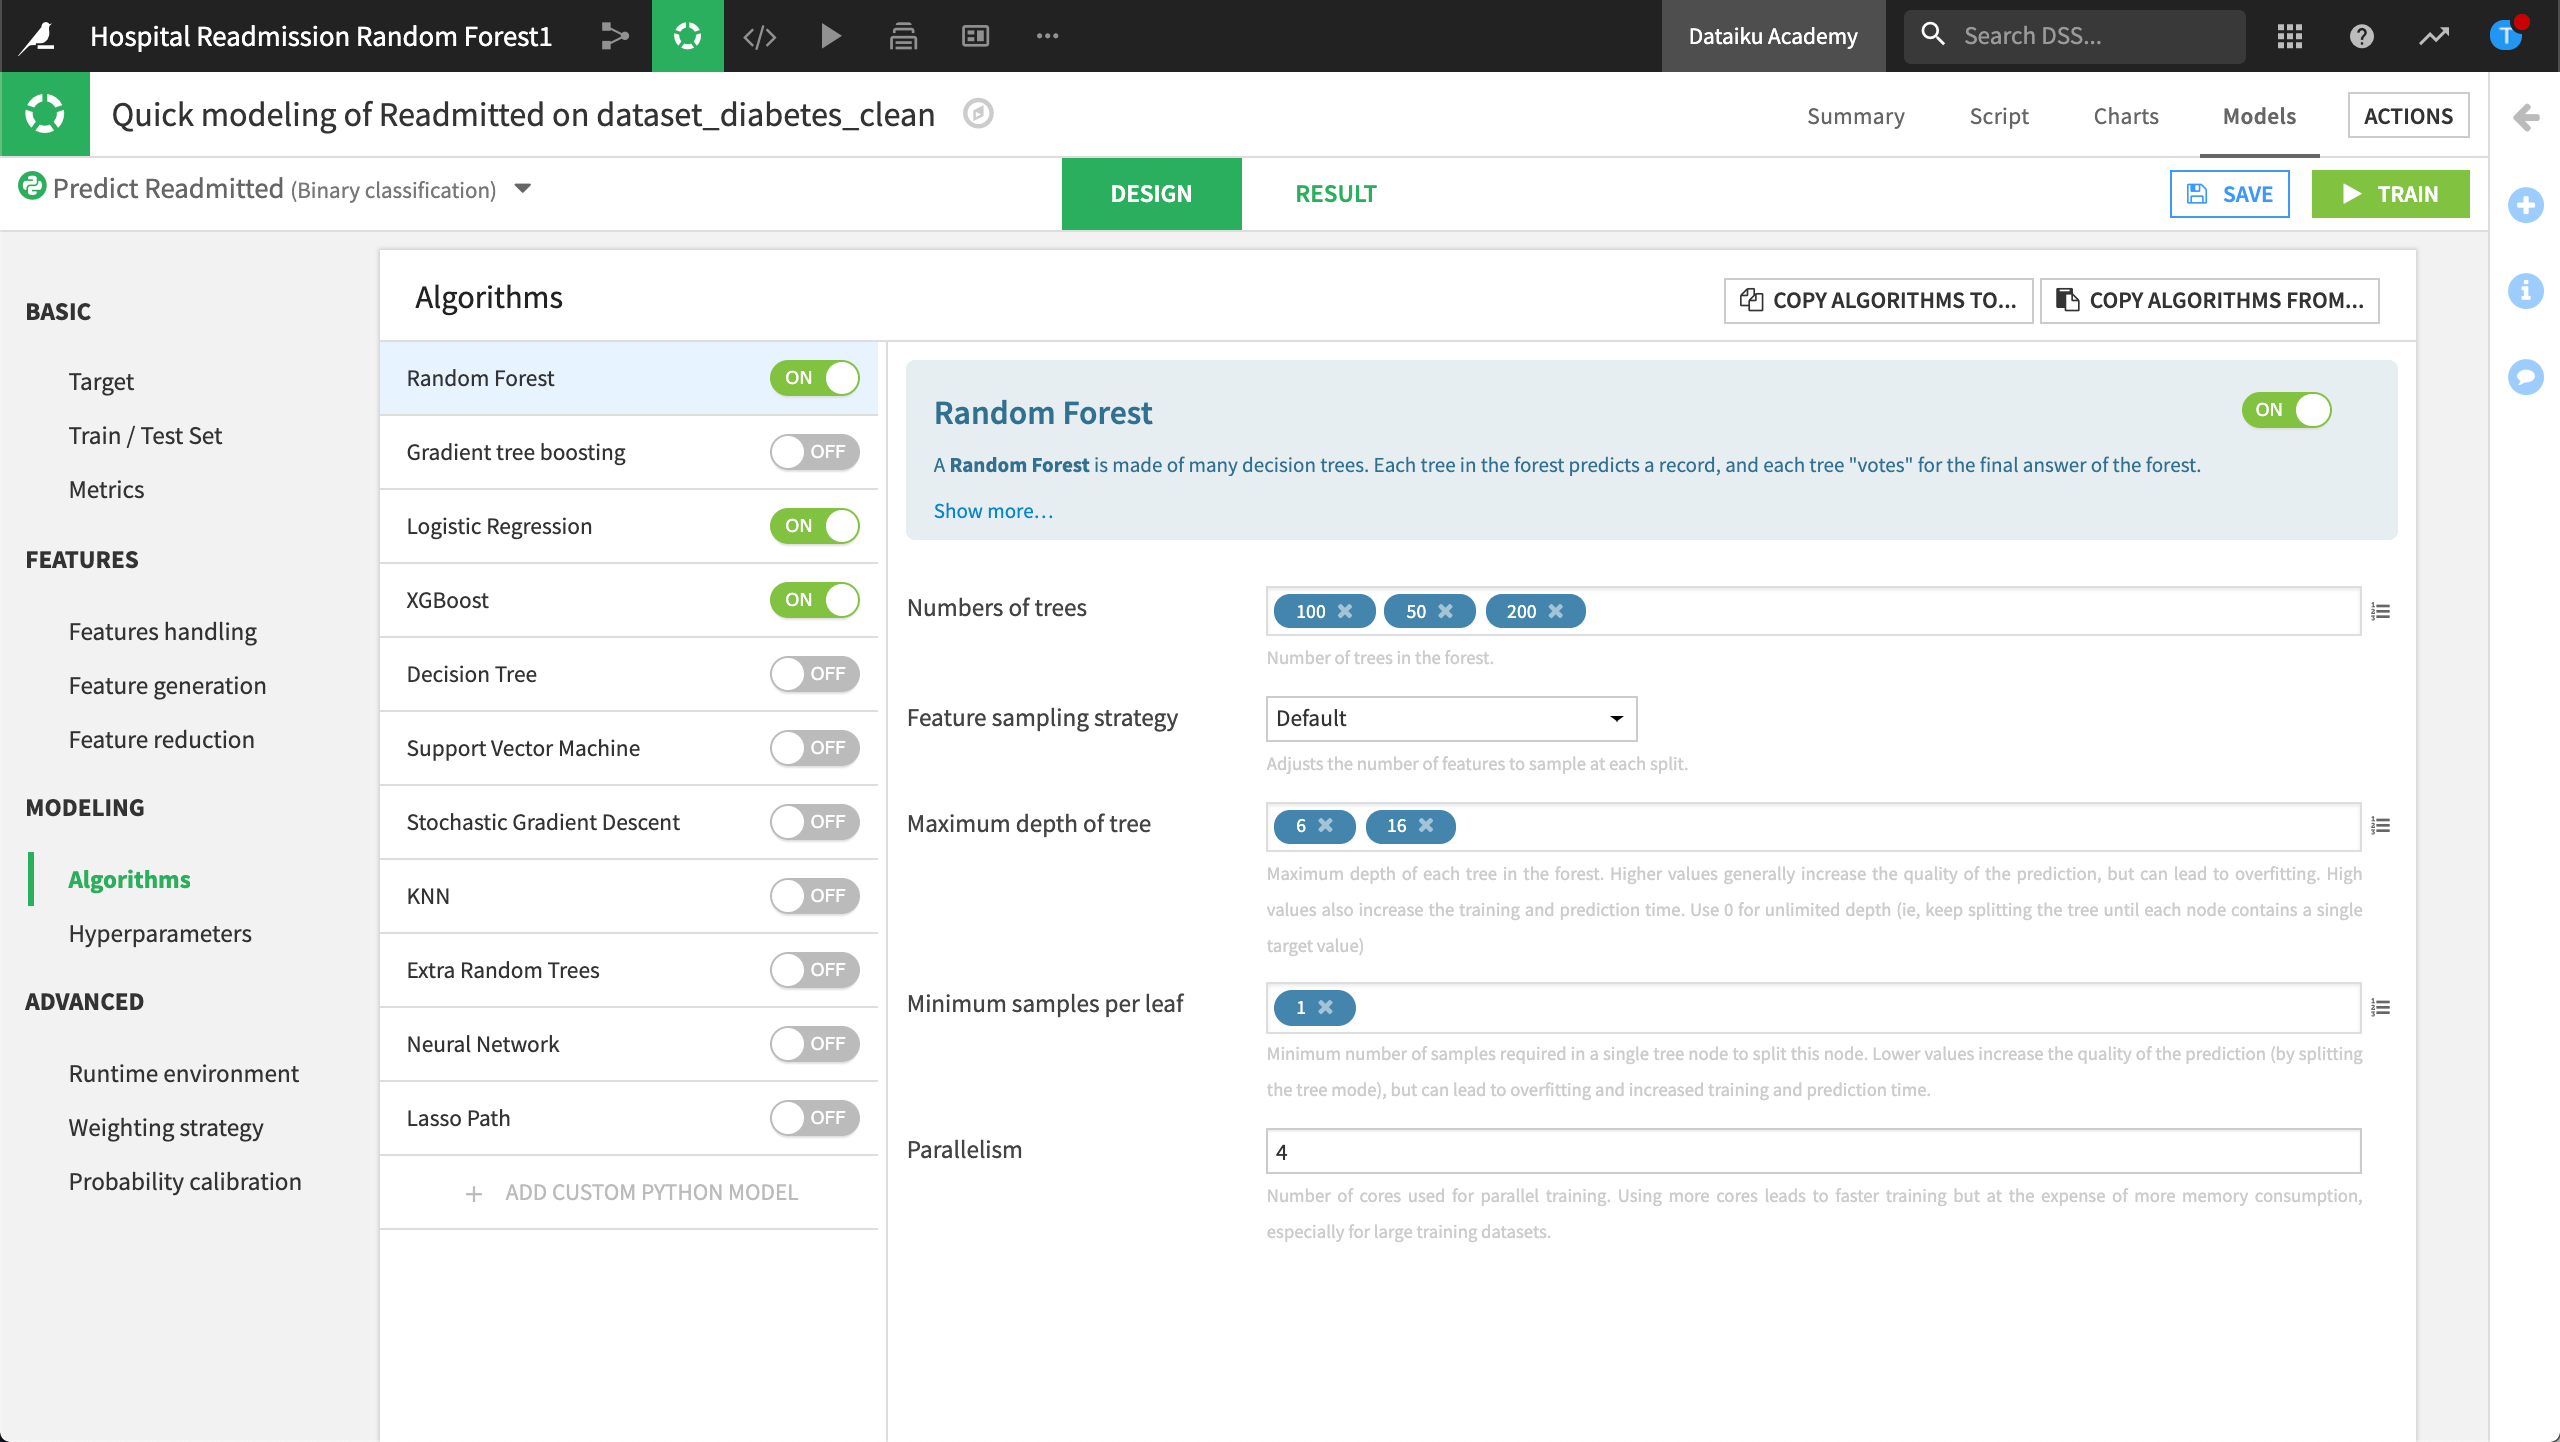
Let’s take a look at the Modeling section of a classification model we trained to predict whether a patient will be readmitted to the hospital.
For each of the algorithms that we selected, there is a set of hyperparameters that we can optimize to improve the model. For example, in the Random Forest algorithm, we can change the number of trees, the feature sampling strategy, or the maximum depth of the tree, to cite a few. For instance, we can try three different values for the number of trees: 100, 50 and 200.

The hyperparameters available to optimize depend on the algorithm and the engine selected to train the model. Every time we create a new machine learning model in DSS, we can select the engine to use for training the model. Most algorithms are based on the Scikit Learn or XGBoost machine learning library, and use in-memory processing.
We could also leverage our Spark clusters to train models on large datasets that don’t fit into memory, by using one of the following:
Spark’s machine learning library, MLLIB, or
Sparkling Water, H2O’s support for machine learning with Spark.
Each of these engines will lead to slightly different hyperparameters to optimize.
Hyperparameters
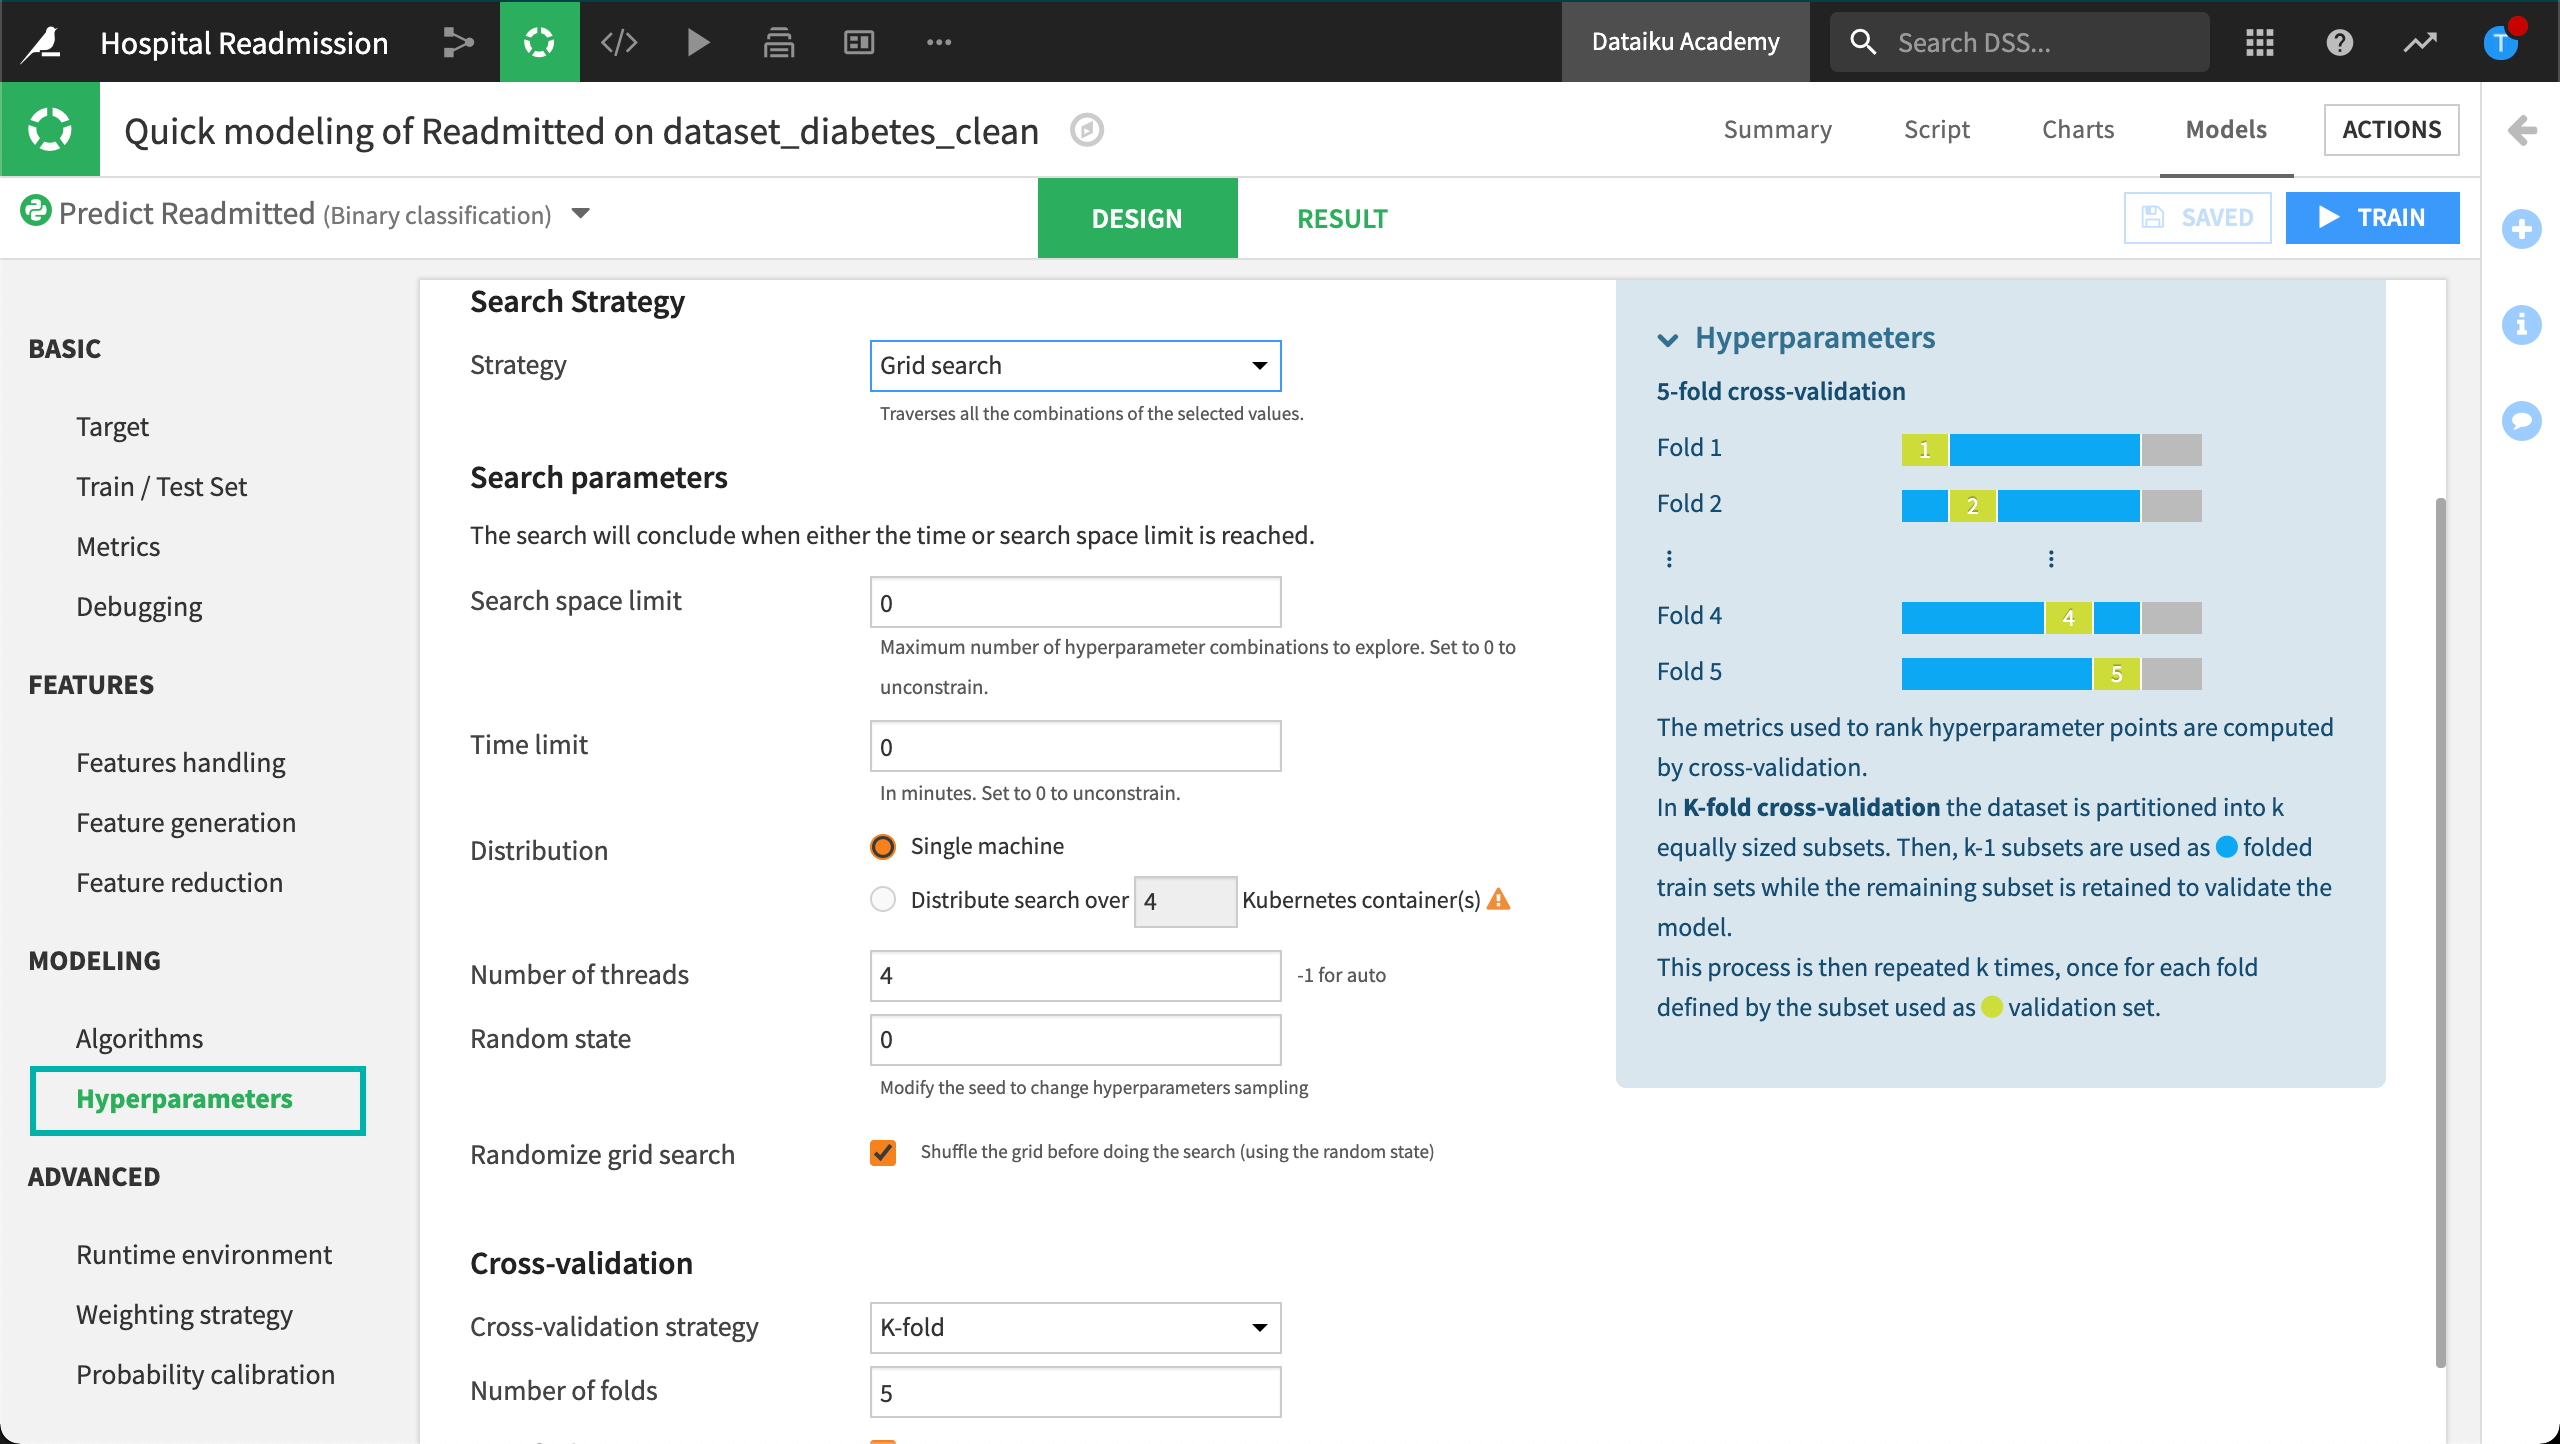
DSS allows us to define the settings for our hyperparameter search These search parameters control the optimization process and are available from the Hyperparameters tab.
For example, with Grid search, we can set the maximum search time to 2 minutes. When the time limit is reached, the grid search stops, and returns the best set of parameters for the model.
Note
The traditional way of performing hyperparameter optimization is Grid search. Grid search is simply an exhaustive search over all possible combinations of hyperparameters. For example, with Random forest, we might choose a few discrete values to explore for each hyperparameter, such as number of trees, and tree depth, and then try all combinations.
When Grid search is not the best strategy, such as when you have a dozen hyperparameters, you can use advanced search strategies like Random search and Bayesian.
Random search simply draws random points from the hyperparameter space and stops after N iterations.
Bayesian search works like Random search, but it generates new points depending on the performance of the previous ones. The idea is to focus the exploration around points that seem to work best.
To learn more about these advanced strategies, visit Advanced Models Optimization–Search Strategies.
We can also select our preferred validation strategy for the Grid search:
A simple train/test split,
A K-fold cross validation method, or
Our own custom cross-validation code.

View the Tuning Results
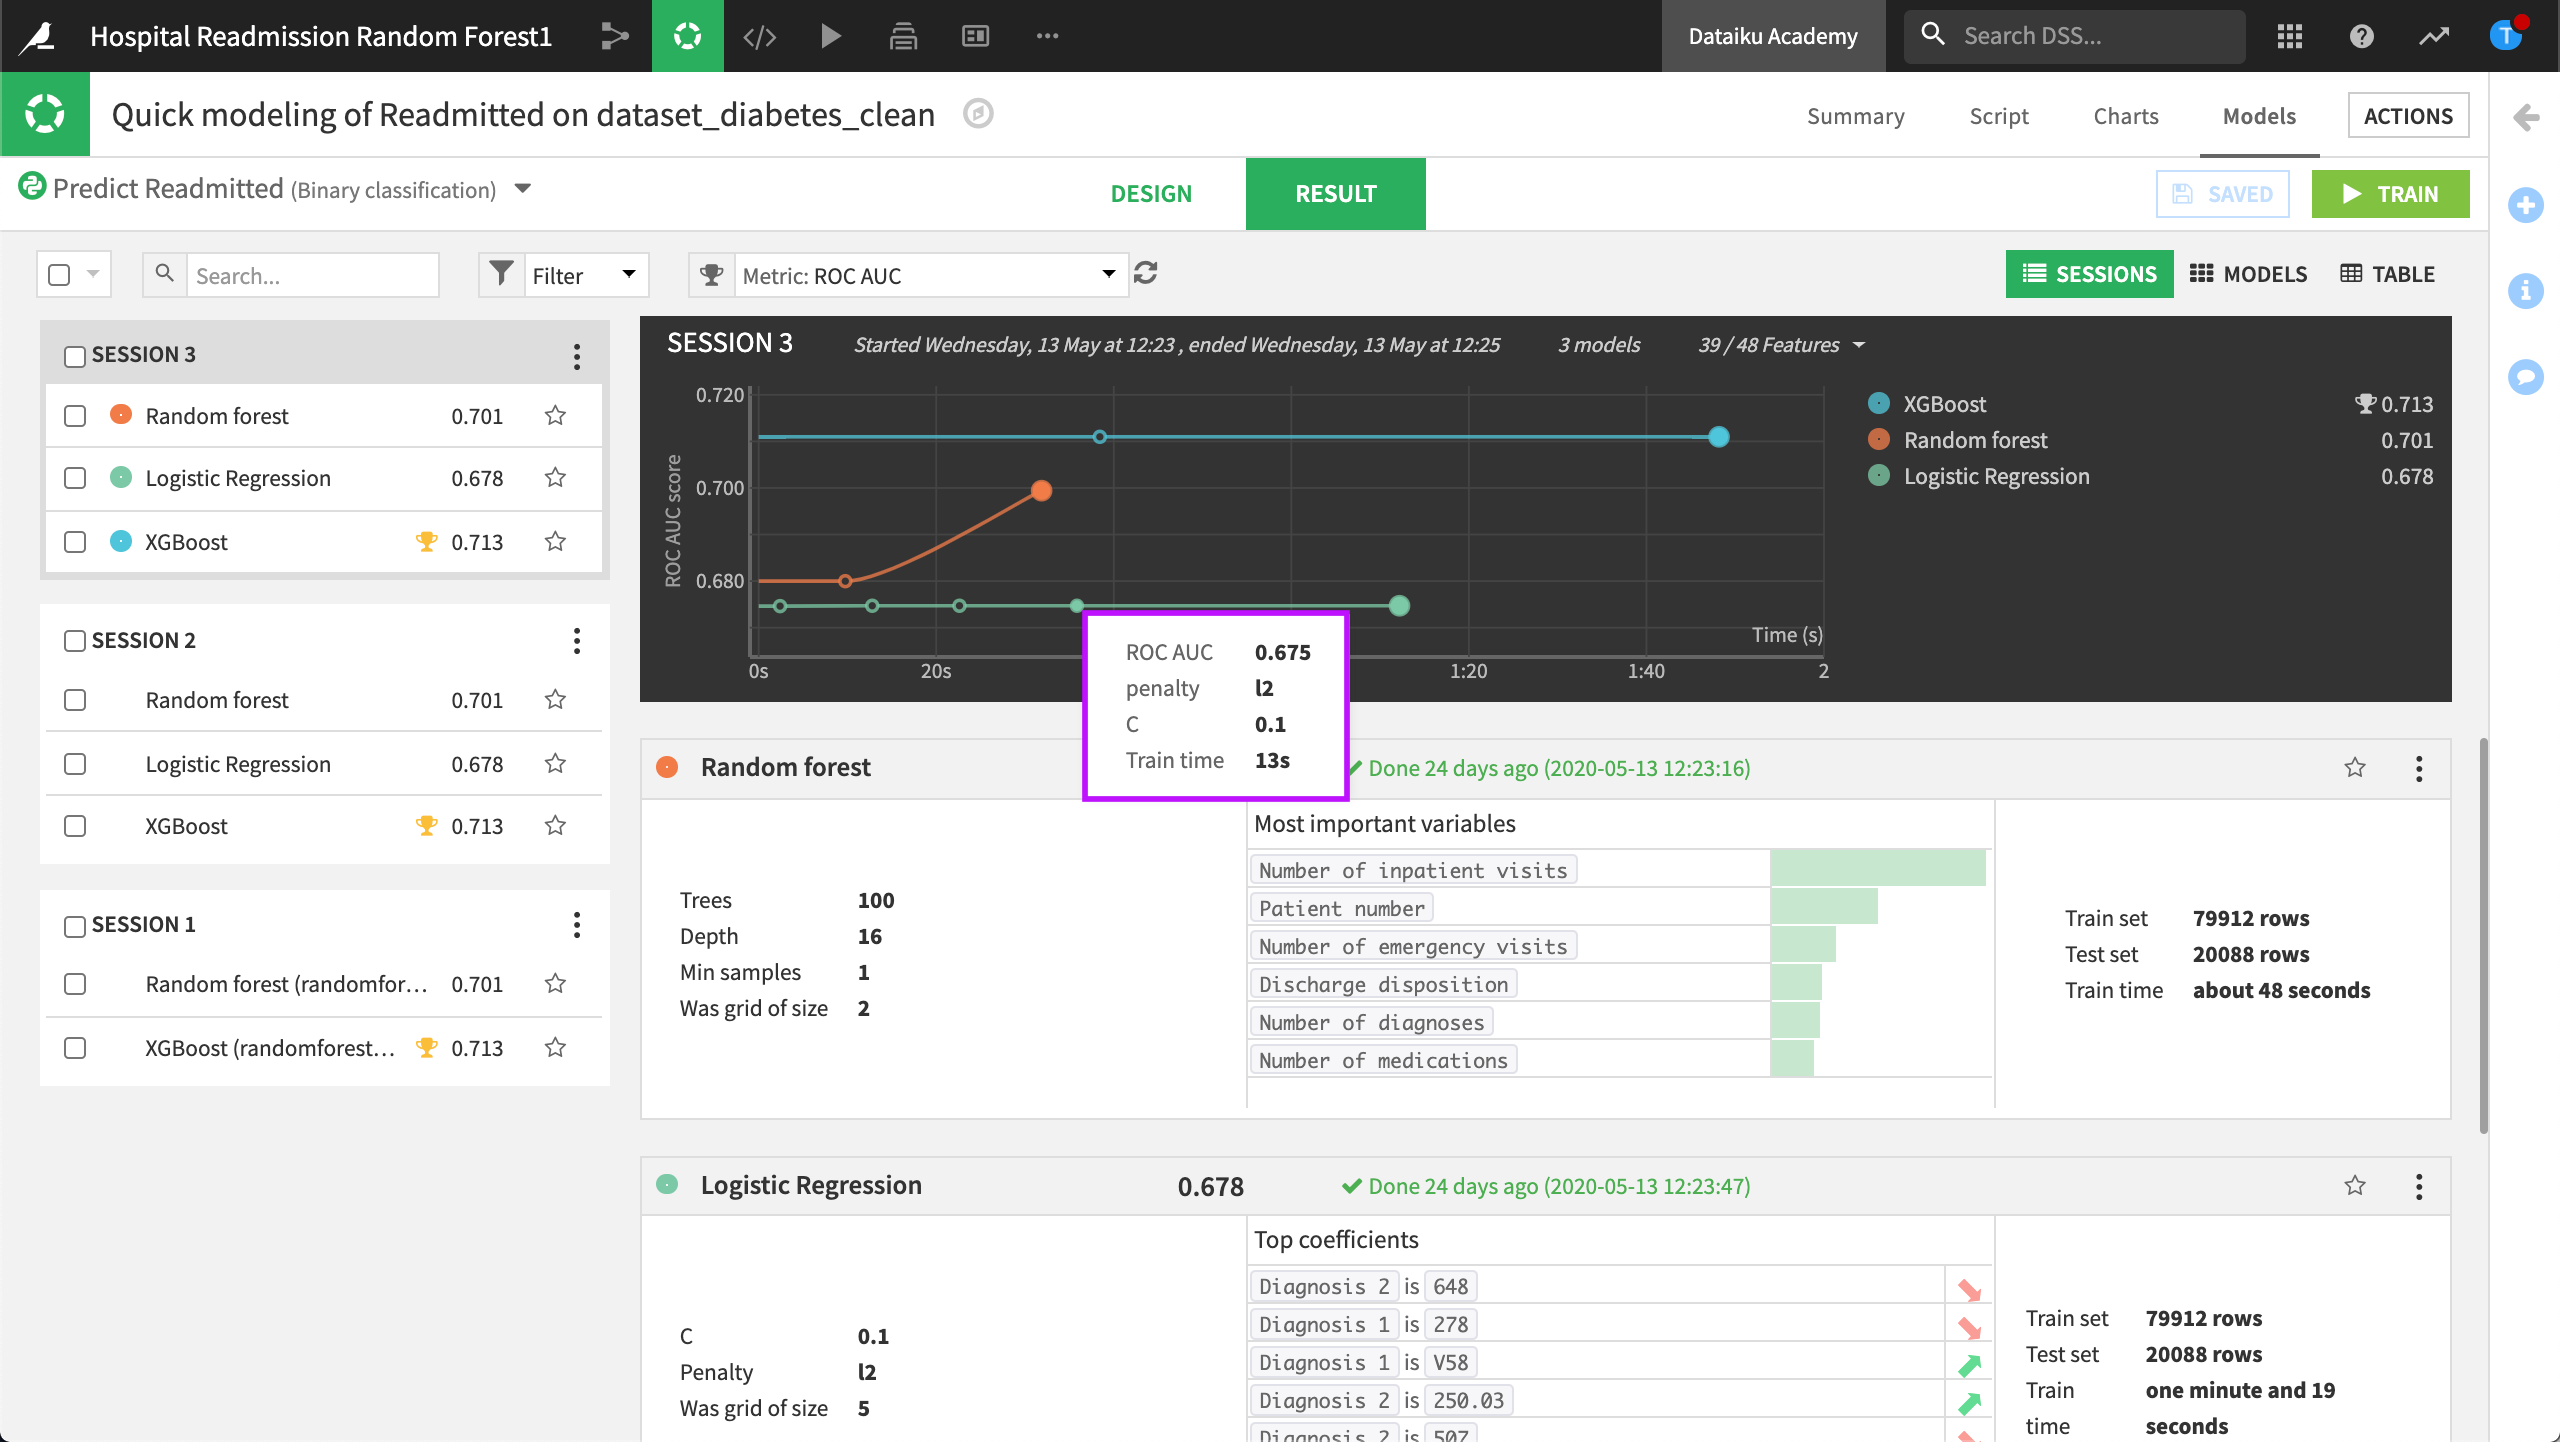
Once we are satisfied with our settings, we can train another iteration of our model, and visualize the evolution of our Grid search in the Result tab.
Note
We can choose to interrupt the optimization while DSS is implementing the grid-search. DSS will then finish the current grid point that it is evaluating, and will train and evaluate the model on the “best hyperparameters found so far”. Later on, we can resume the interrupted grid search, and DSS will continue the optimization using only the hyperparameter values that have not been tried.
Here, DSS displays a graph of the evolution of the best cross-validation scores found so far. Hovering over one of the points, we can see the evolution of the hyperparameter values that yielded an improvement. In the right part of the charts, we can see final test scores.
