Hands-On: Fit Univariate Distributions
Note
This lesson is a continuation of the Interactive Visual Statistics hands-on tutorial.
Another aspect of descriptive statistics involves modeling the probability distribution of your dataset.
DSS allows you to estimate the parameters of univariate probability distributions using the Fit Distribution card. This feature is available only for numerical variables.
For example, let’s attempt to fit the Normal and Beta distributions to the dataset, considering only the alcohol variable.
Click the New Card button from the “Worksheet” header, and then select Fit curves & distributions.
Select the Fit Distribution card.
Select alcohol as the “Variable” and Normal as the “Distribution”.
Add another distribution by clicking the +Add a Distribution box and selecting Beta.
Click Create Card.
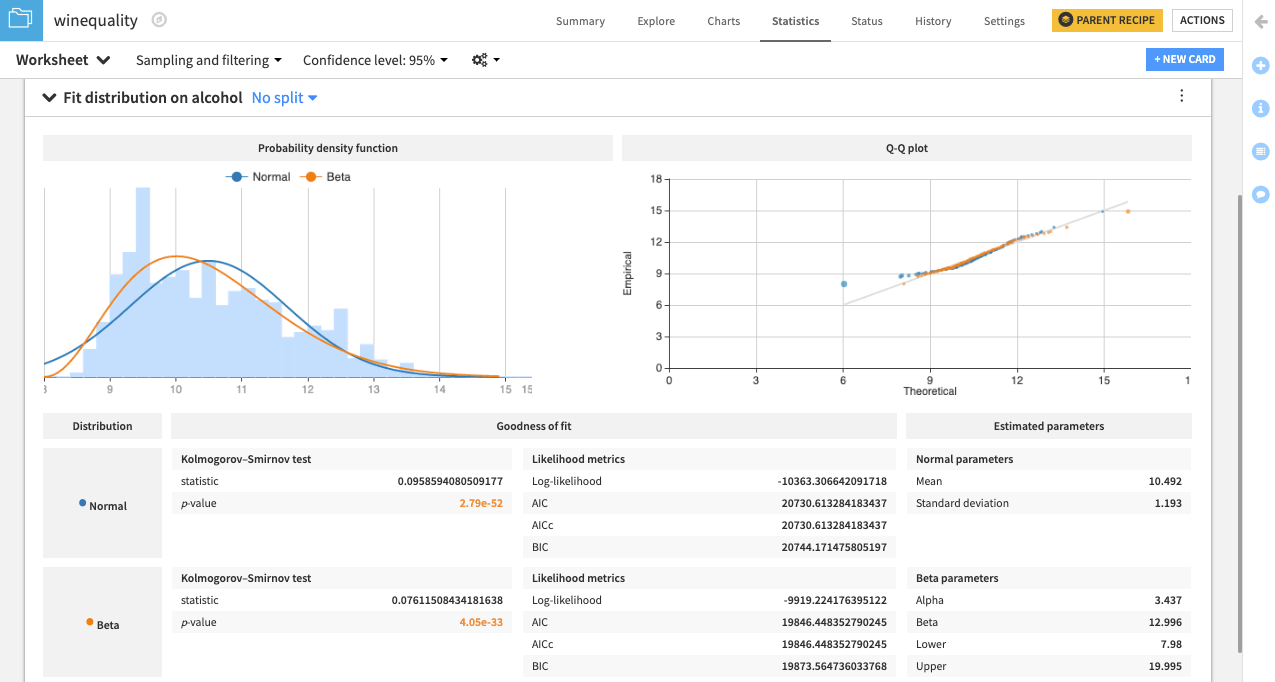
DSS creates a card that shows the normal and beta probability density functions fit to the data. There is also a Q-Q plot that compares the quantiles of the data to the quantiles of the fitted distributions. Observing points that are far from the identity line suggests that the data could not have been drawn from either distribution.
Additionally, the card includes goodness of fit metrics and the estimated parameters for the normal and beta distributions.