Hands-On: Explore the Interactive Statistics Interface
Dataiku DSS provides the ability to perform exploratory data analysis (EDA) through the Statistics tab of a dataset. Using this feature, you can implement and visualize the following tasks:
Descriptive statistics: Univariate and bivariate analysis, curve and distribution fitting, and correlation computation.
Inferential statistics: Hypothesis testing.
Dimensionality reduction: Principal Component Analysis (PCA).
This course walks you through how to perform EDA tasks on the wine quality dataset [1] that is available in the UCI Machine Learning Repository. The original dataset consists of 12 features (or variables), and in this tutorial, we create an additional column for a variable Type to indicate whether an observation belongs to the red wine or white wine category. For the purpose of this course, the type and quality variables in the dataset are treated as categorical variables, while all other variables are numerical.
Prerequisites
This tutorial assumes that you have access to Dataiku DSS version 8.0 or above.
Create Your Project
The first step is to create a new Dataiku DSS Project.
From the Dataiku homepage, click +New Project > DSS Tutorials > ML Practitioner > Interactive Visual Statistics (Tutorial).
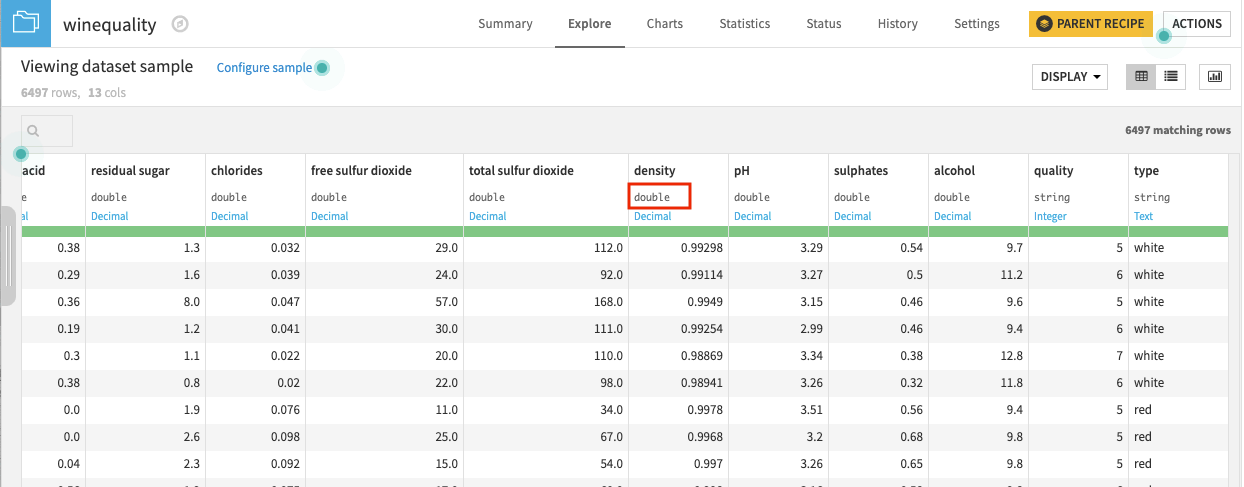
Notice that the project contains input datasets that have been stacked to create the winequality dataset. The following figure shows a snippet of the winequality dataset, with the red box highlighting the storage type for one of the numerical columns.
This dataset has been prepared as follows:
A new column, type, was created to indicate the data source (white or red).
The storage type for the numerical columns has been changed from “string” to “double”. This is so that Dataiku DSS can treat these columns as numerical variables instead of categorical variables.
The Statistics Interface
The Statistics page of a dataset allows you to generate statistical reports on your data by creating worksheets.
Go to the Flow.
Open the winequality dataset to explore it.
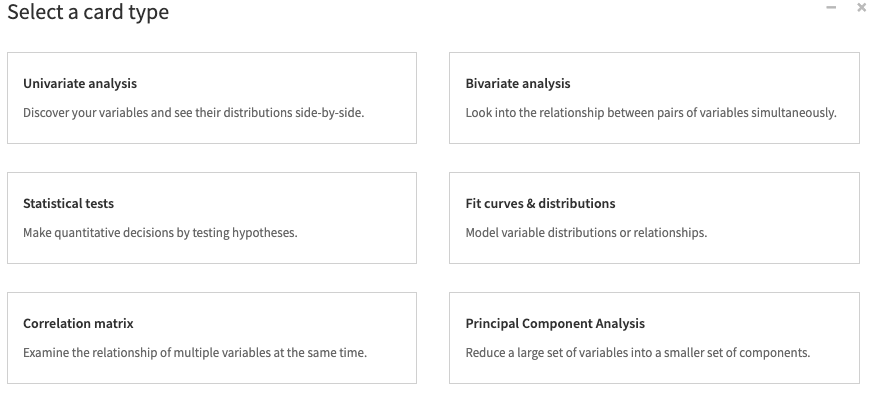
Navigate to the Statistics page of the dataset and click +Create Your First Worksheet.
This brings up a window that contains a selection of card types.
Reference
[1] Paulo Cortez, António Cerdeira, Fernando Almeida, Telmo Matos, and José Reis. Modeling wine preferences by data mining from physicochemical properties. 2009.