Concept Summary: Time Series Components
We can decompose a time series into four parts. These are:
Trend
Seasonality
Cycle
Random variation
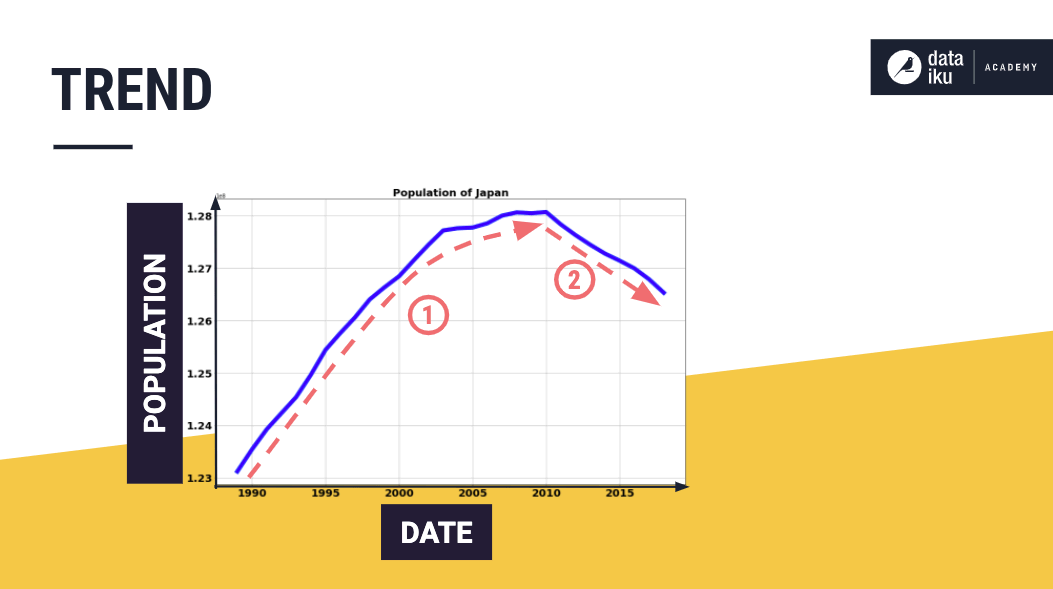
Trend
The trend is a non-repeating, long-term direction of a time series. Trends can be upward, downward, horizontal, linear, or nonlinear. For example, see the upward and downward trend in the plot of Japan’s population.
Seasonality
The seasonality describes a repeated behavior that occurs, over the short term, at predictable intervals that span less than a year.
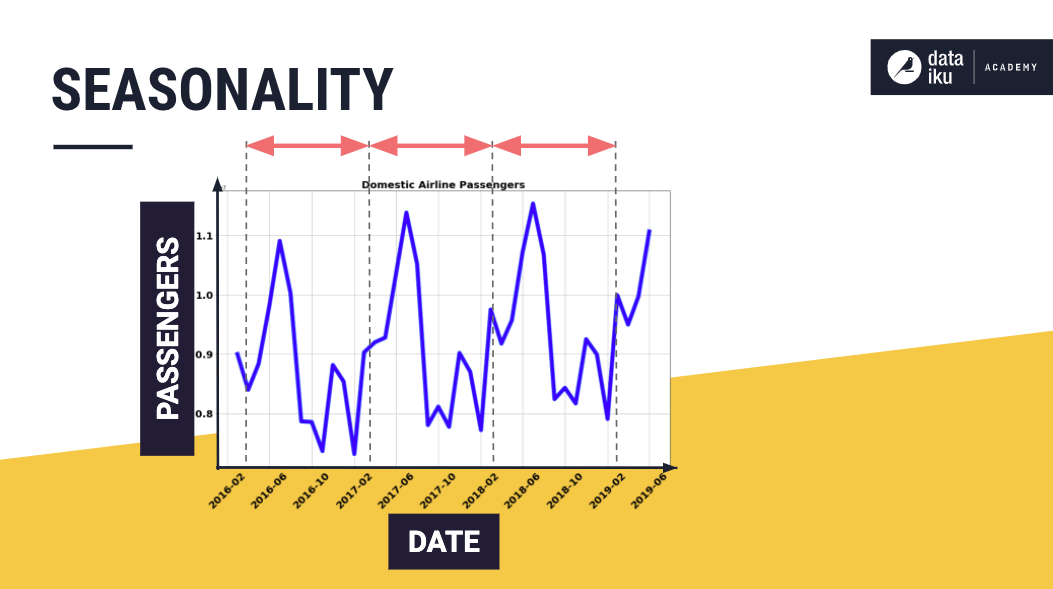
Man-made events, such as airline travel, can lead to seasonality in data. Also, natural forces, such as weather and changing seasons, can cause seasonality, as is the case with crop production and sales of umbrellas.
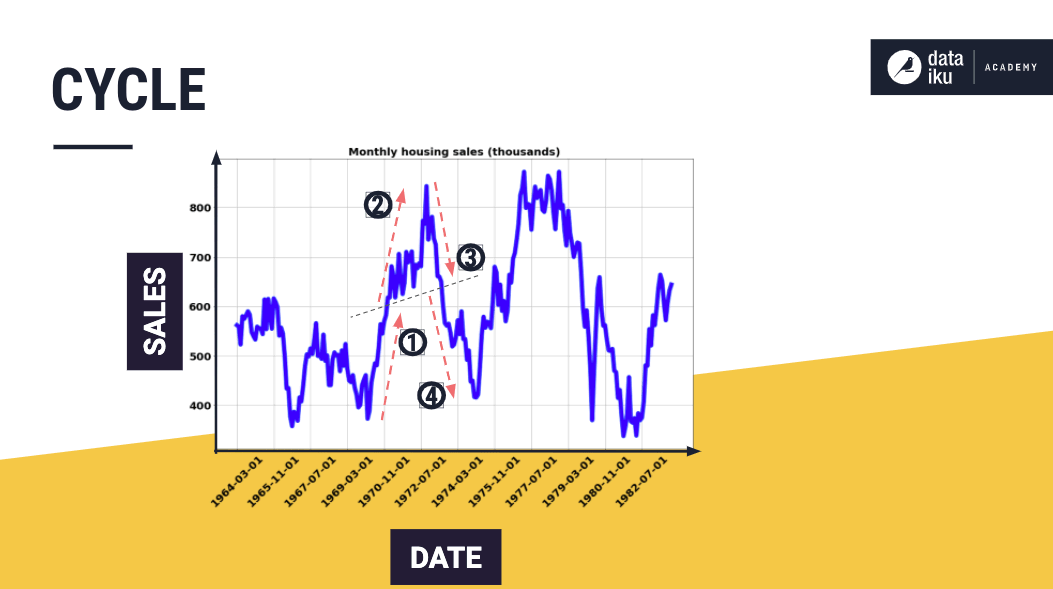
Cycle
Cycles occur when a time series follows a non-seasonal, up-and-down pattern. Cycles are hard to predict because they do not occur in predictable time intervals.

A typical example is the business cycle, comprising the phases of recovery, prosperity, recession, and depression.
Seasonality Vs. Cycle
Note these critical distinctions between seasonality and cycle.
When the changes in a time series repeat with a fixed frequency associated with some aspect of the calendar, then the changes are seasonal. Whereas, if the changes occur with varying frequencies, then they are cyclical.
In general, the average length of cycles tends to be longer than that of seasonal patterns, and the magnitudes of cycles tend to be more variable than that of seasonal ones.
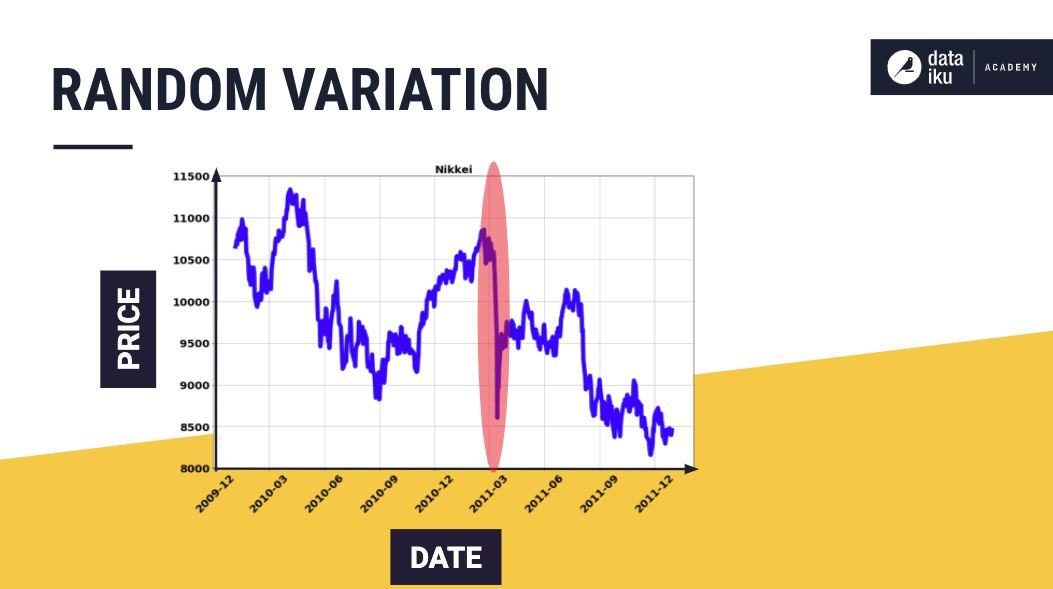
Random Variation
A random variation in time series data occurs due to uncontrollable and unpredictable events, such as earthquakes, wars, floods, famines, and so on.
This plot of the Nikkei 225 stock index shows a plunge in value, which coincided with the earthquake and tsunami in March 2011.
Modeling with Time Series Components
Identifying time series components is useful for understanding the underlying patterns in the data, and for modeling the data as a combination of the components.
Models can be additive, representing the time series as a sum of the components. Here, the magnitude of the seasonality tends to stay constant over time.
Models can also be multiplicative, representing the time series as a product of the components. In this case, the magnitude of the seasonality tends to increase over time.