Loading the data
We will work with a toy dataset emulating the data that an e-business company (and more precisely an internet market place) might have.
First, create a new project, then import the two main datasets into DSS:
Events are a log of what happened on your website: what page users see, what product they like or purchase…
Product is a look-up table containing a product id, and information about its category and price. Make sure to set product_id column as bigint in the schema.
As with any data science project, the first step is to explore the data. Start by opening the events dataset: it contains a user id, a timestamp, an event type, a product id and a seller id. For instance, we may want to check the distribution of the event types. From the column header, just click on Analyze:
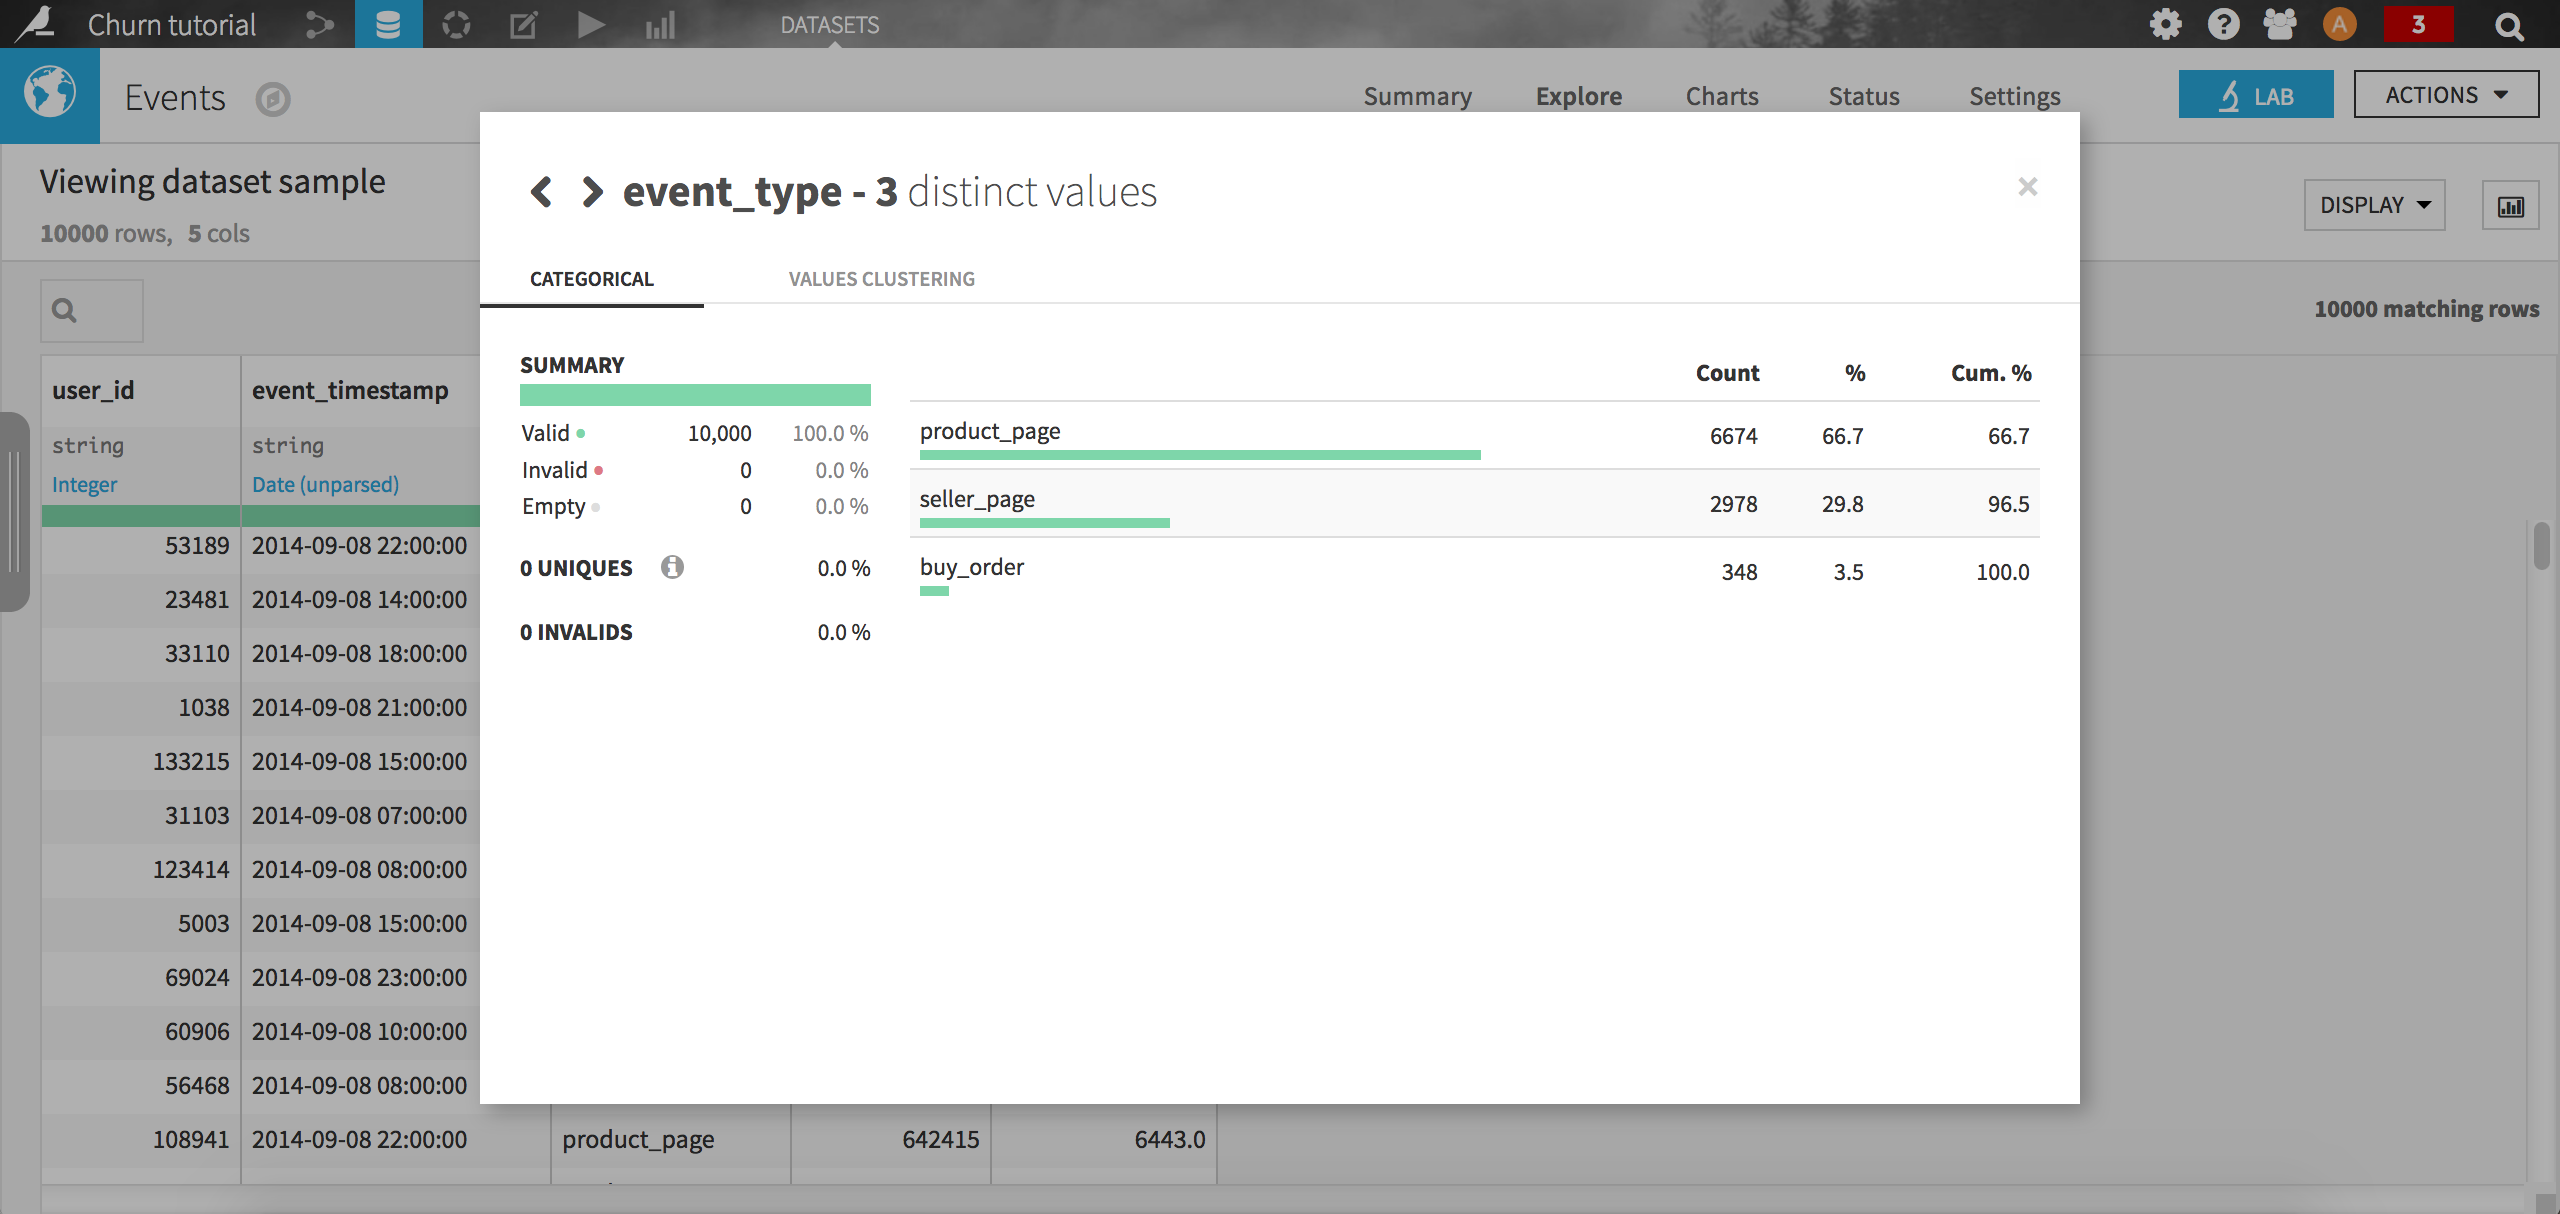
Not very surprisingly, the most common event type is viewing a product, followed by viewing a seller page (remember it is a market place e-business company). The purchase event is way less frequent with only 3.5 % of all records in the sample.
When looking at this dataset again, we can see that it contains a timestamp column which is not stored in a standard ISO format. To make it more suitable for analysis, we can quickly parse the event_timestamp column (using the format yyyy-MM-dd HH:mm:ss) using a visual data preparation script. Make sure the resulting column is stored in the Date format. Once done, you can deploy the script and directly store the resulting dataset into PostgreSQL.
On the other hand, the product dataset contains an id, a hierarchy of categories attached to the product, and a price. You may want to check for instance the distribution of the price column, by clicking on the header and selecting Analyze in the drop-down menu. Again, load the dataset into PostgreSQL, this time using a Sync recipe.
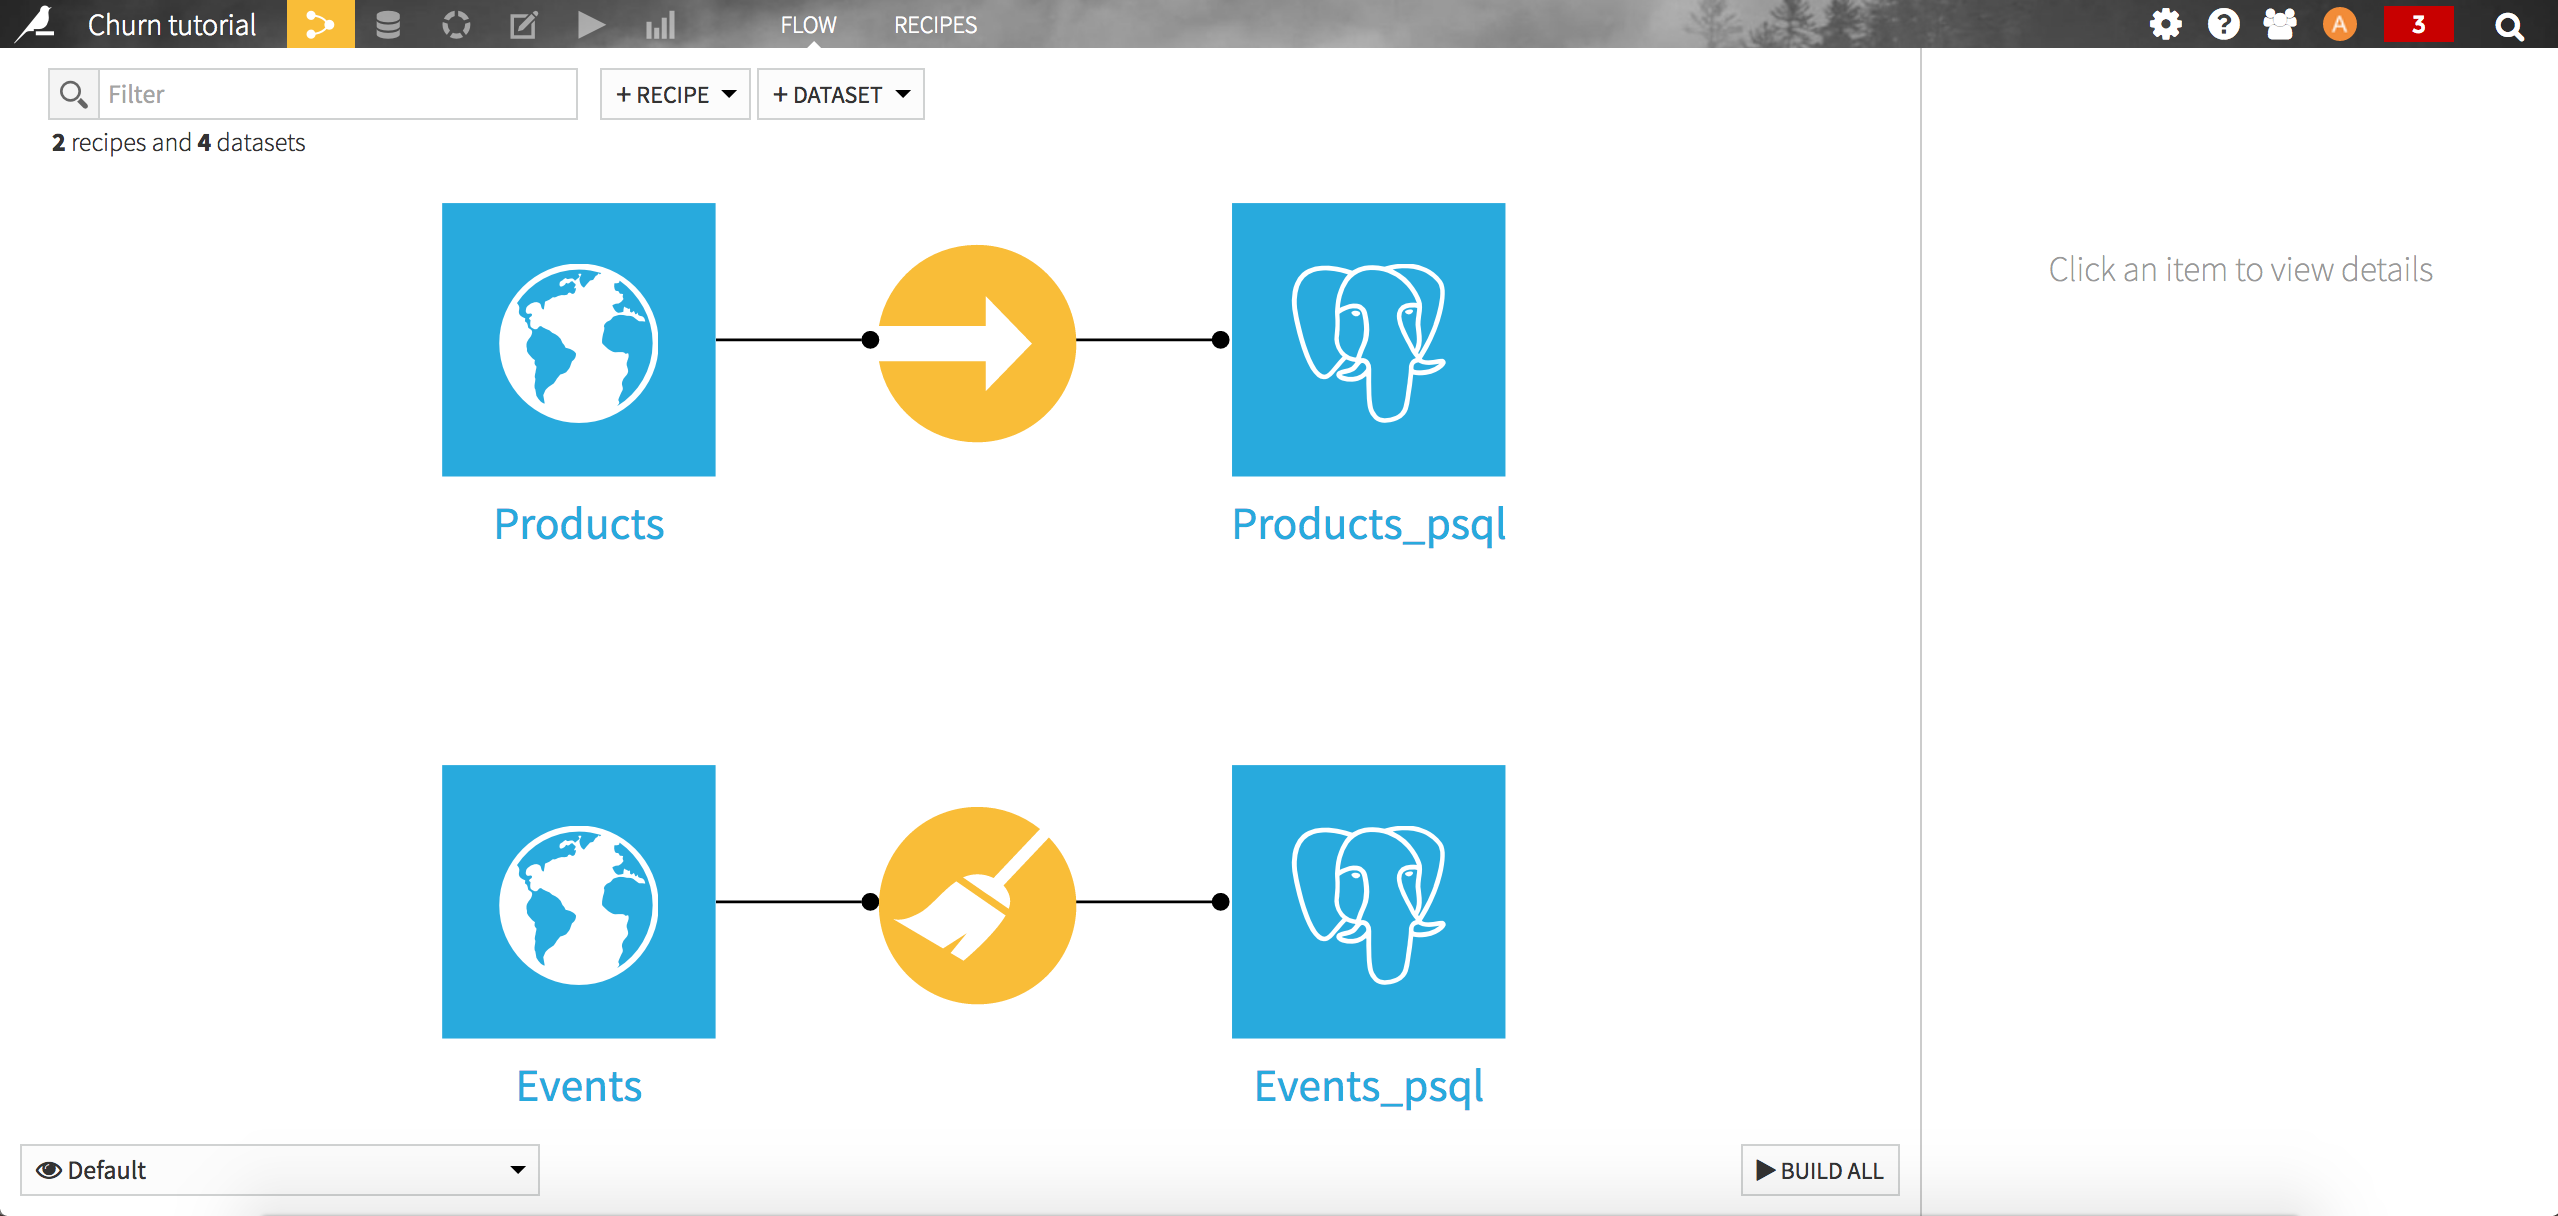
Your flow should now look like this: