Generating Features
Before making our first model on the training dataset, let’s create a few more features that may be useful in predicting failure outcomes.
Because we are still designing this workflow, we’ll create a sandbox environment that won’t create an output dataset, yet. By going into the Lab, we can test out such transformations as well as try out some modeling strategies, plus much more. Nothing is added back to the Flow until we are done testing and ready to deploy!
Note
The Basics courses covers how steps in an analytics workflow can move to and from the Lab to the Flow.
With the training dataset selected, find the Lab in the Actions menu or in the right-click menu.
Under the Visual Analysis side, select New and accept the default name
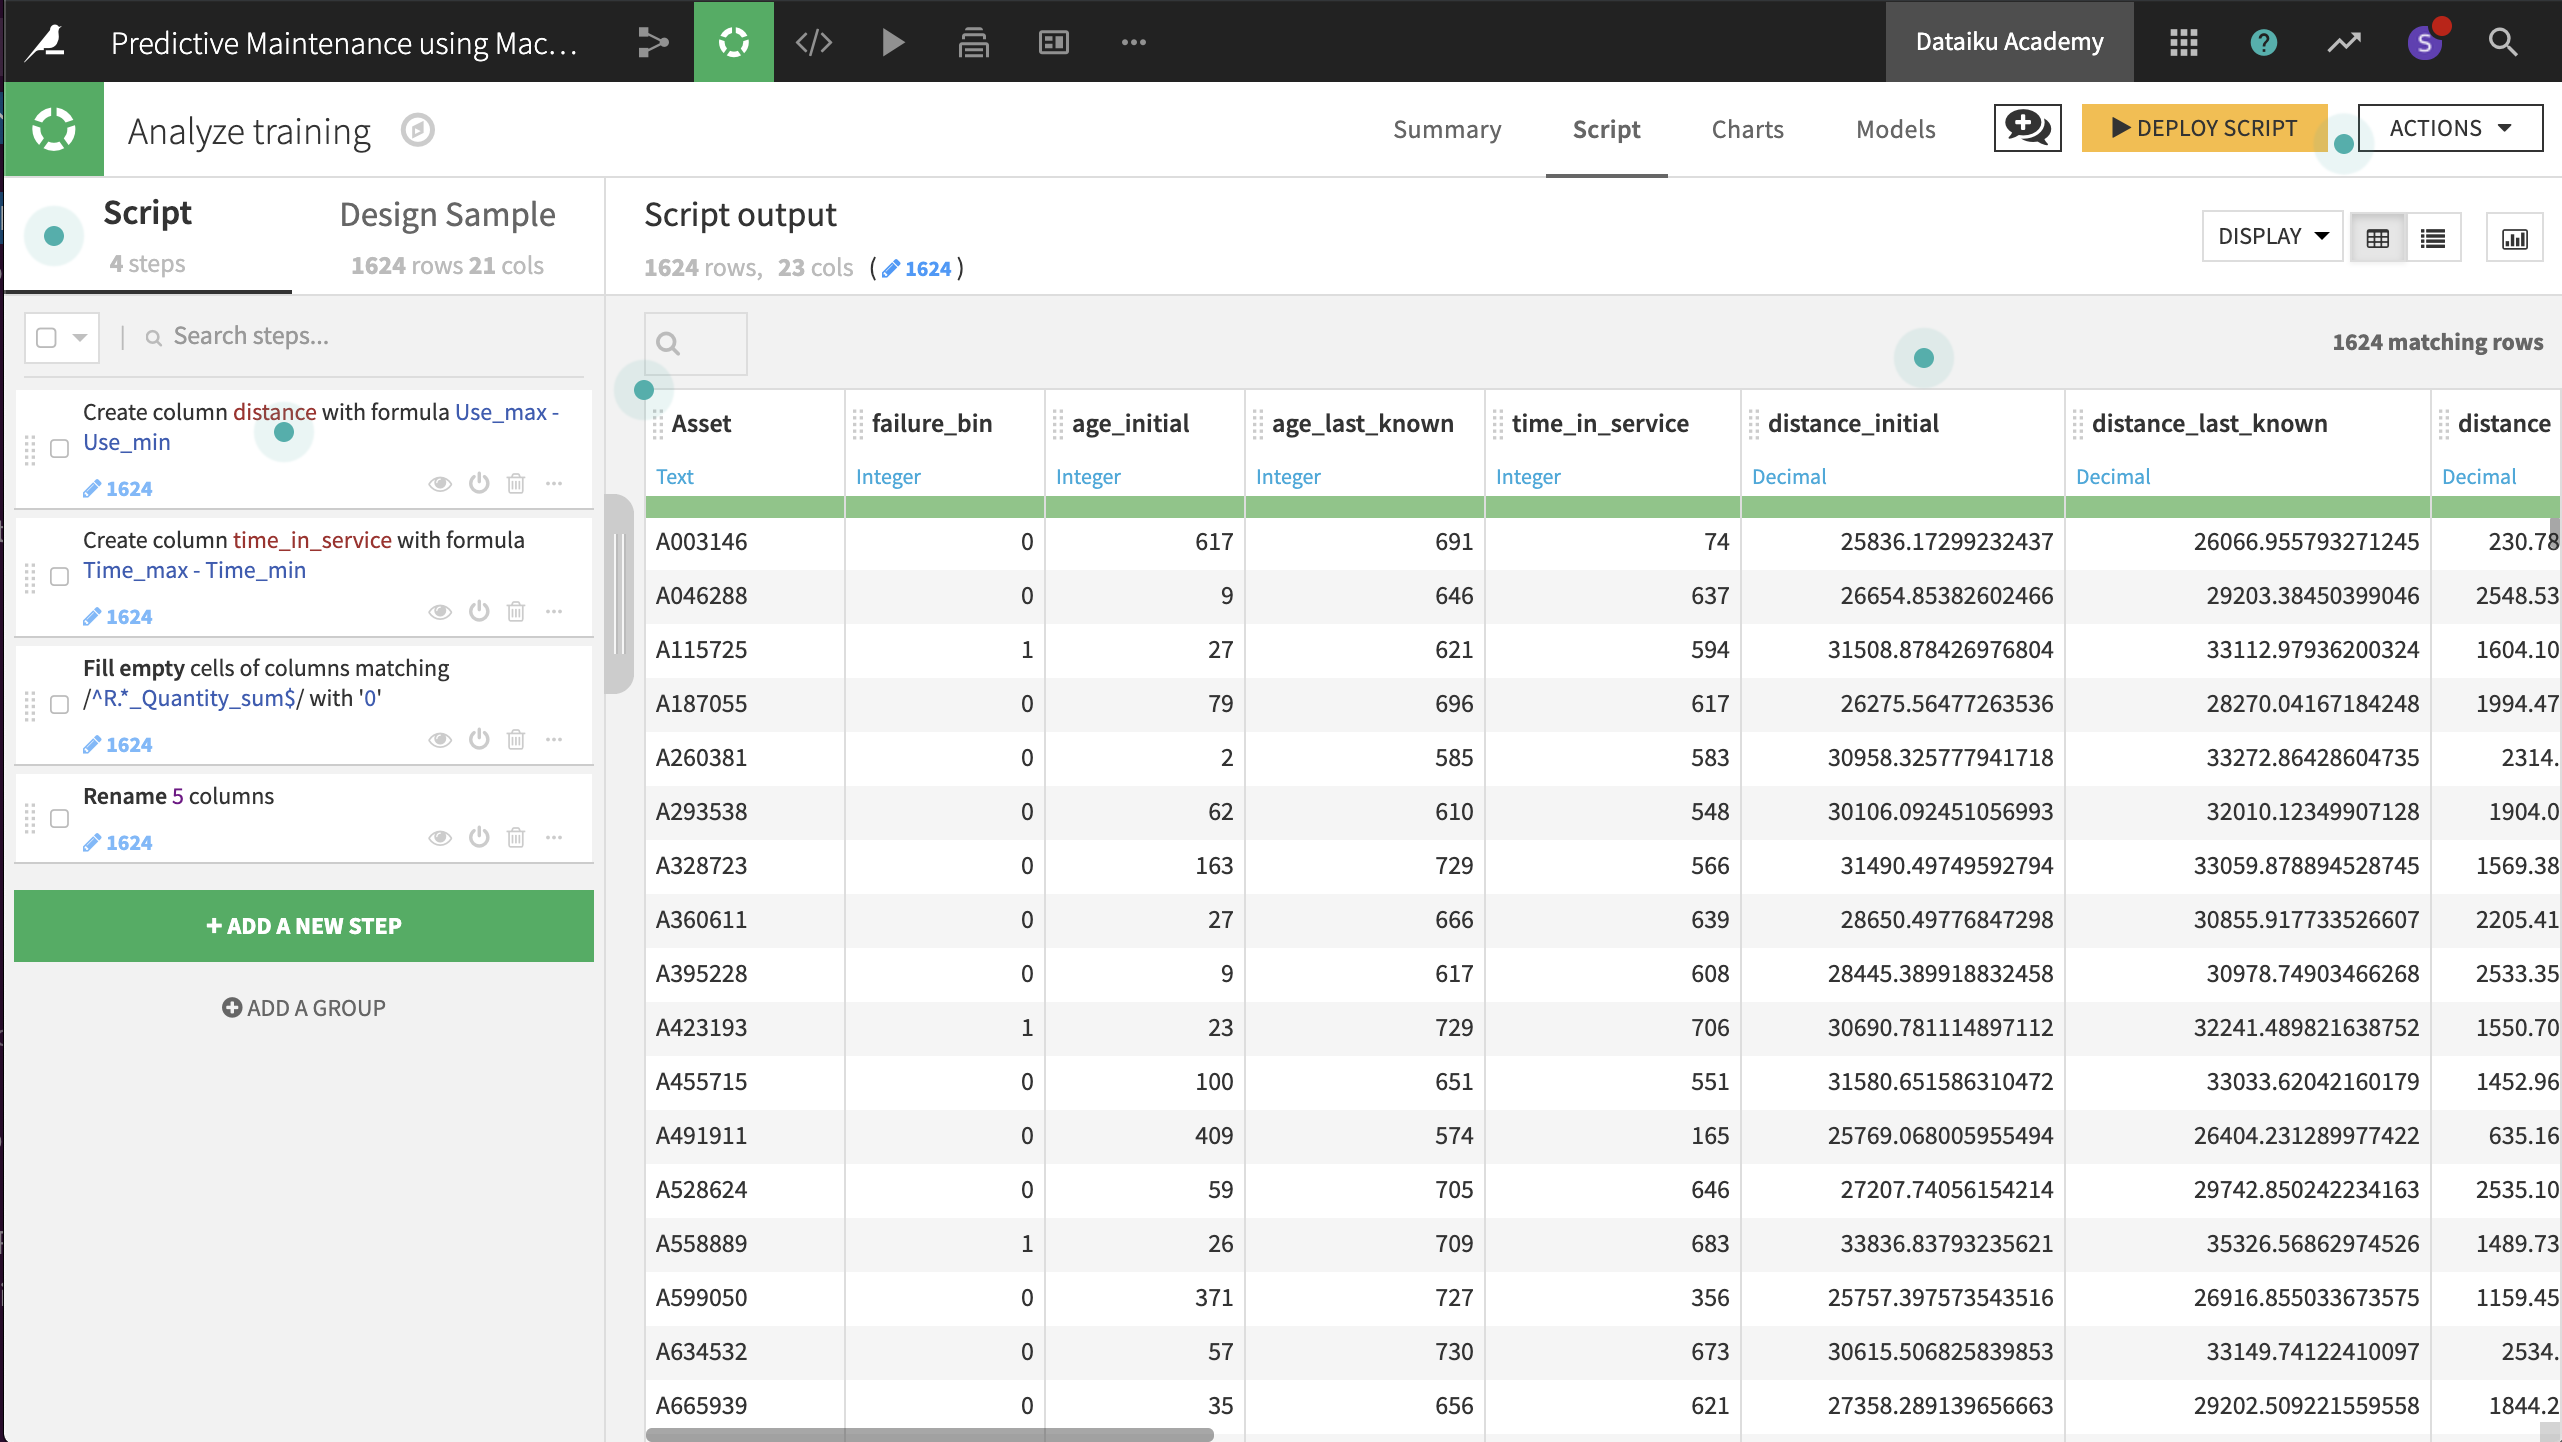
Analyze training.In the screen which looks similar to a Prepare recipe, create two new variables with the formula processor.
distancefrom the expression,Use_max - Use_min
time_in_servicefrom the expression,Time_max - Time_min
Use the Fill empty cells with fixed value processor to replace empty values with 0 in columns starting with Reason. The regular expression
^R.*_Quantity_sum$is handy here.Lastly, in order to make the model results more interpretable, use the Rename columns processor according to the table below.
Old col name |
New col name |
|---|---|
count |
times_measured |
Time_min |
age_initial |
Time_max |
age_last_known |
Use_min |
distance_initial |
Use_max |
distance_last_known |
Note
It is not necessary to deploy a script created in the Lab to the Flow in order to make use of the new features in the modeling process. Any models created in a Visual Analysis have access to any features created in the same Visual Analysis.

Next, we’ll make some models!