How To: Use Visual ML Diagnostics
Visual ML diagnostics are a set of checks that help you to detect and correct common problems, such as overfitting and data leakage, during the model development phase. Learn how to use Visual ML diagnostics with this hands-on exercise.
Getting Started
You will need a Dataiku DSS project with a dataset that you can use to create a predictive model. We will use the starter project from the Machine Learning Basics course; there are two ways you can import it:
From the Dataiku DSS homepage, click +New Project > DSS Tutorials > ML Practitioner > Machine Learning Basics (Tutorial).
Download the zip archive for your version of Dataiku DSS, then from the Dataiku DSS homepage, click +New Project > Import project and choose the zip archive you downloaded.
You should now be on the project’s homepage.
Go to the project’s Flow and select the customers_labeled dataset.
In the right panel, click Lab > AutoML Prediction.
In the dialog that opens, choose to create a prediction model on the column high_revenue.
Click Create to create a new prediction modeling task.
Your quick model is now ready to train.
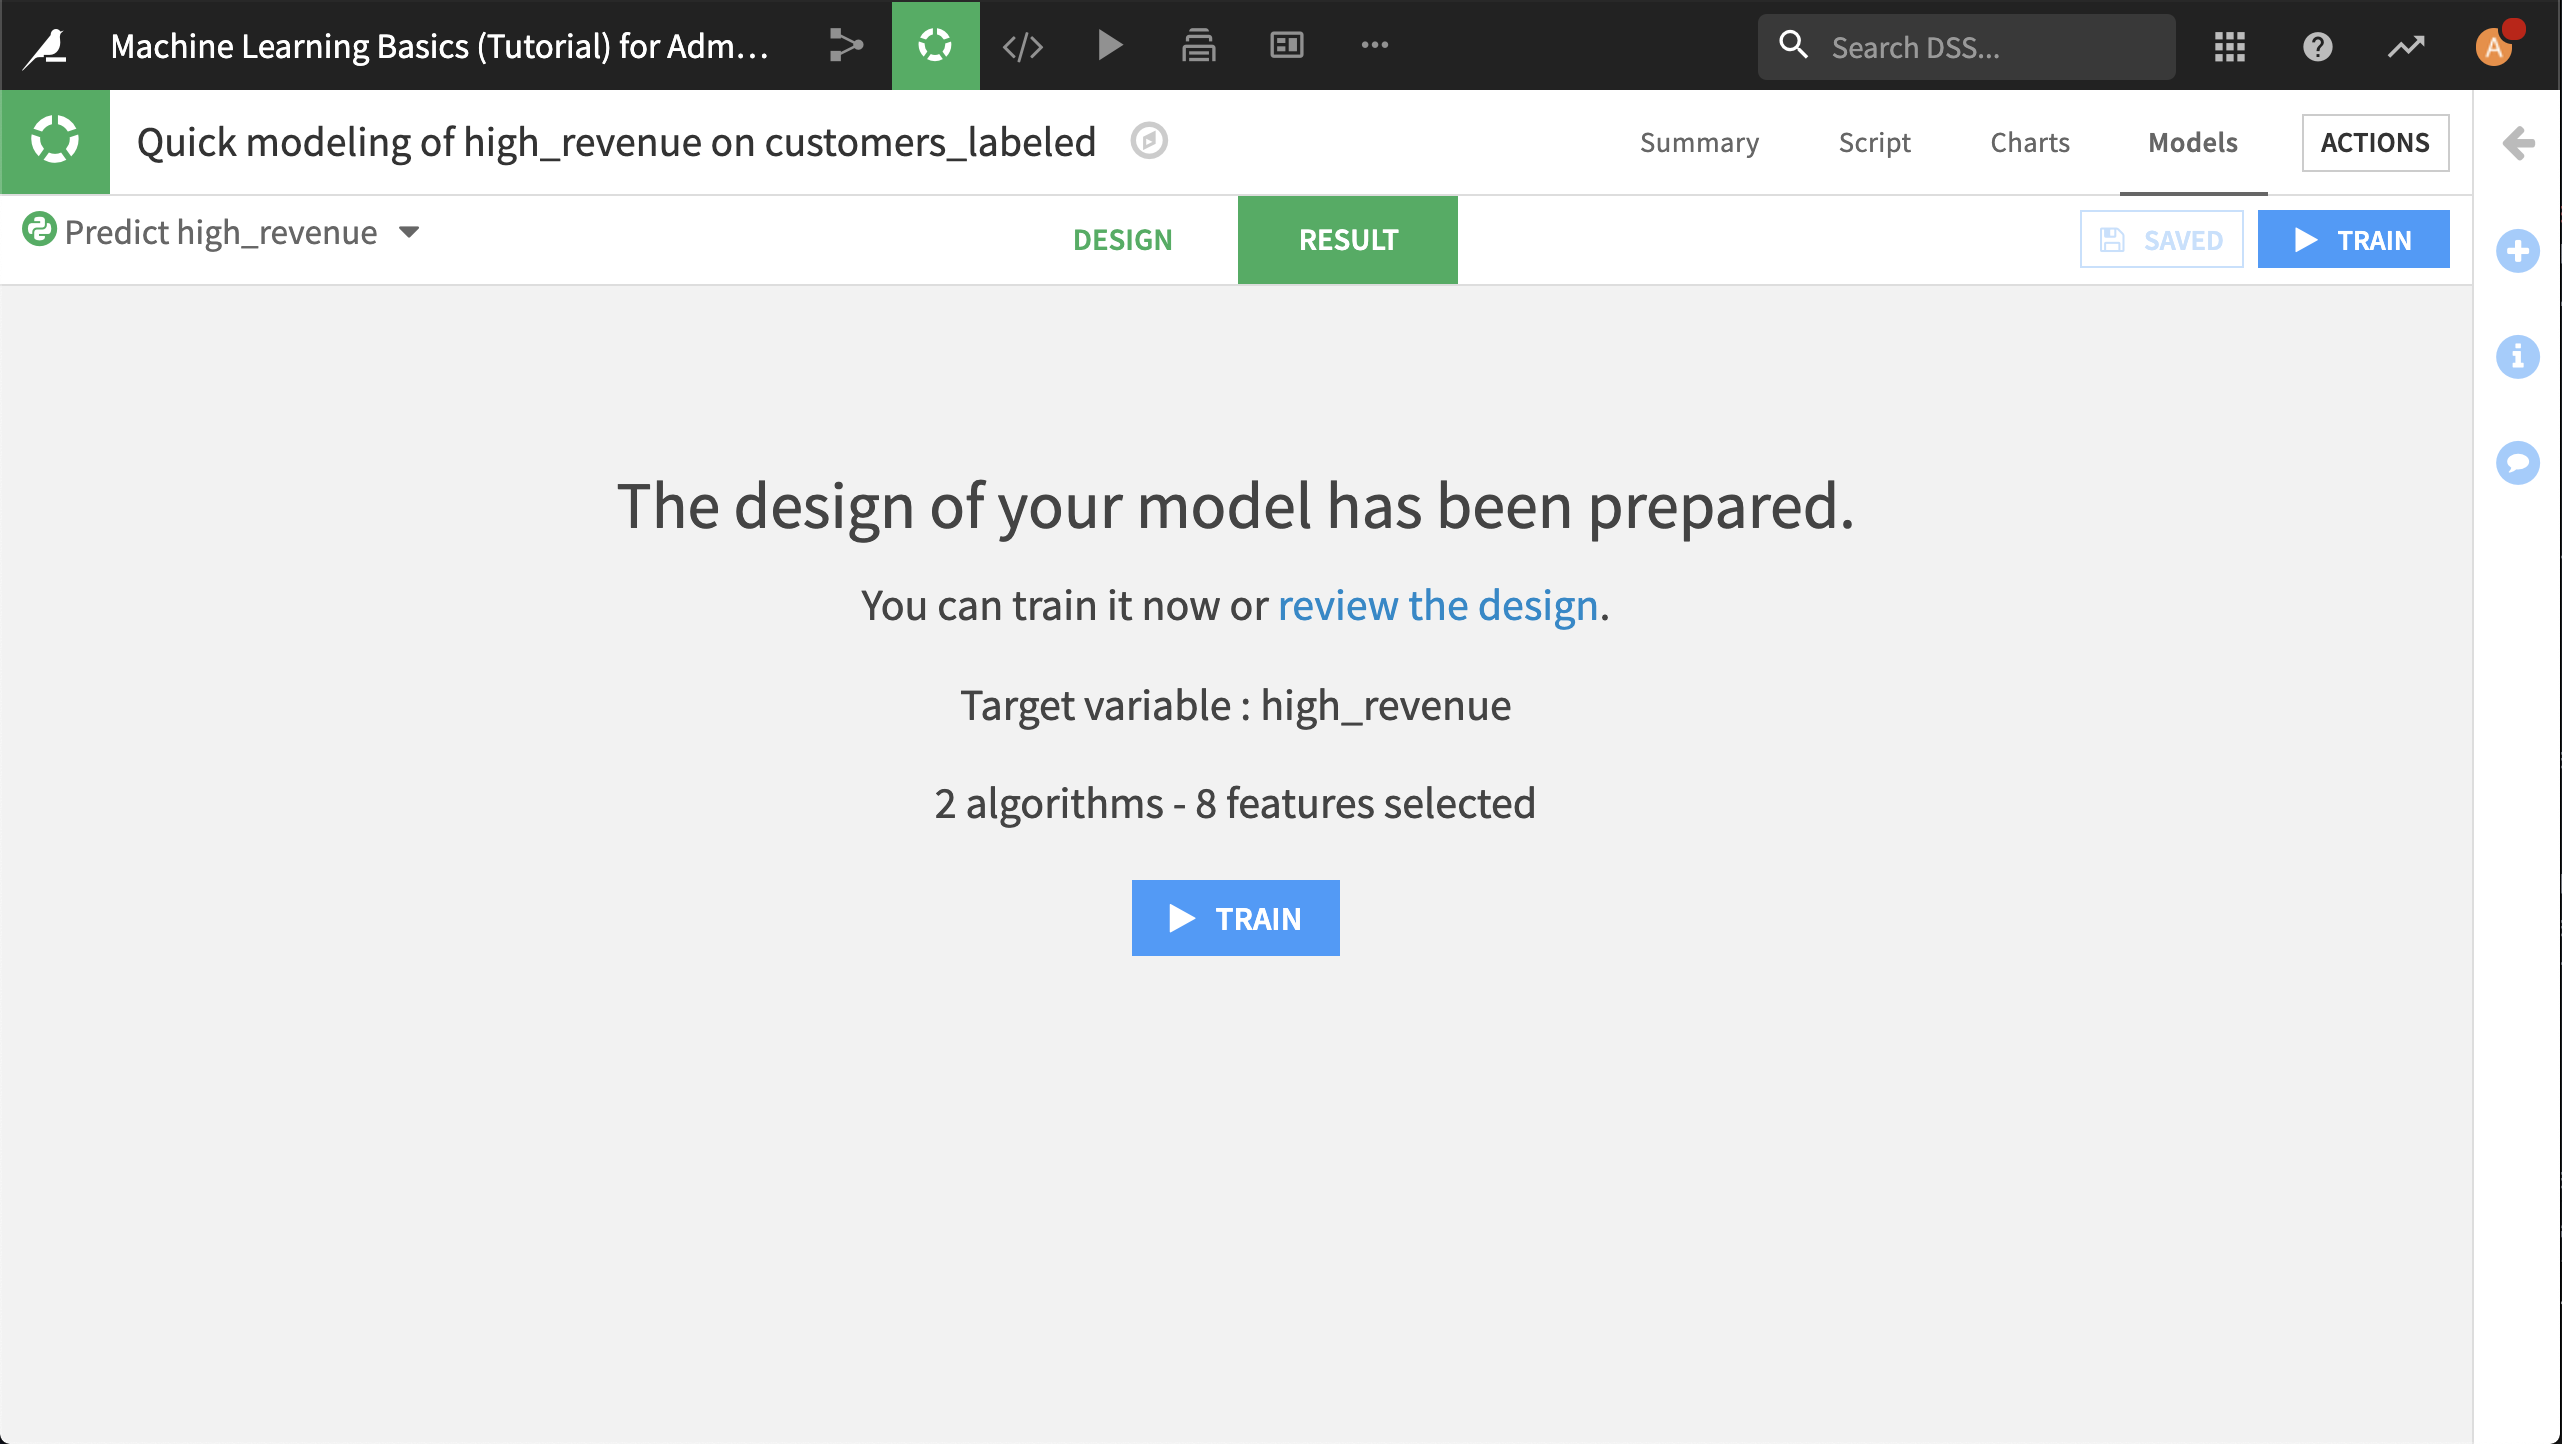
Using Diagnostics
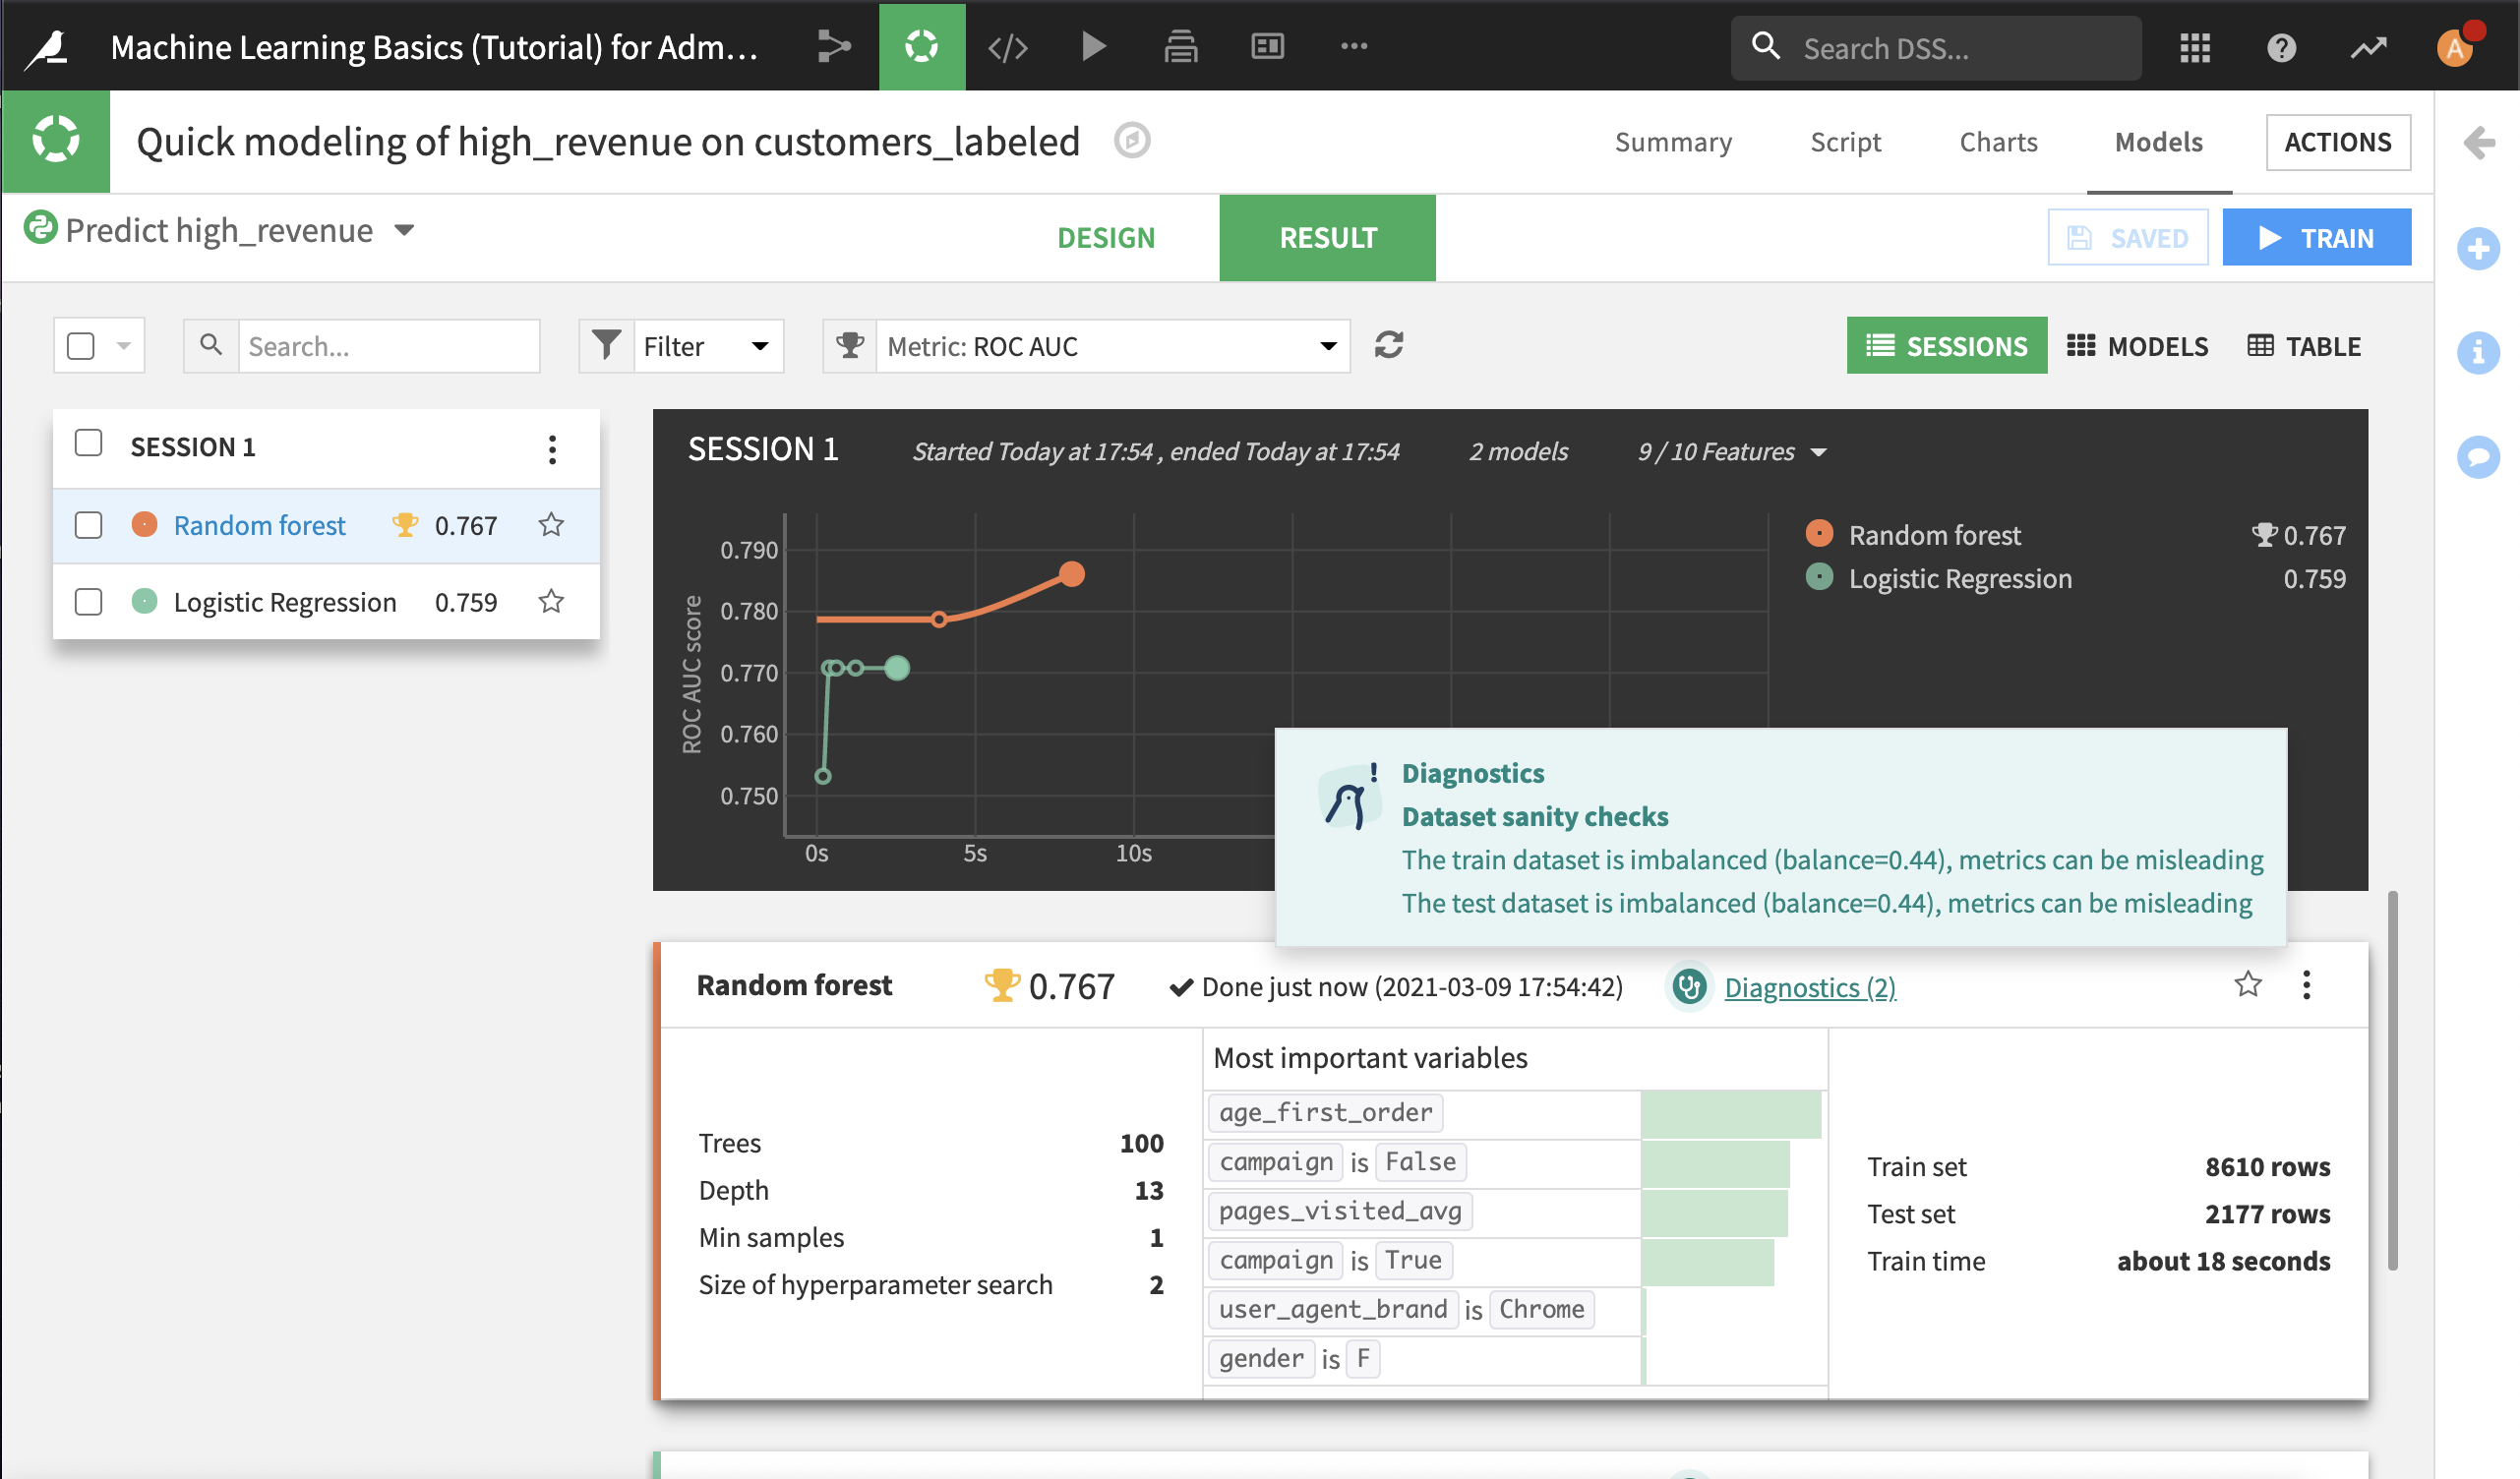
Click Train. While the model is training, you will see diagnostics displayed in real time on the Result tab.
During training, you can review any diagnostic warnings and decide whether to continue or abort the training session. The specific checks performed will depend on the algorithm, as well as the type of modeling task. After training is complete, a summary of the diagnostics is available.
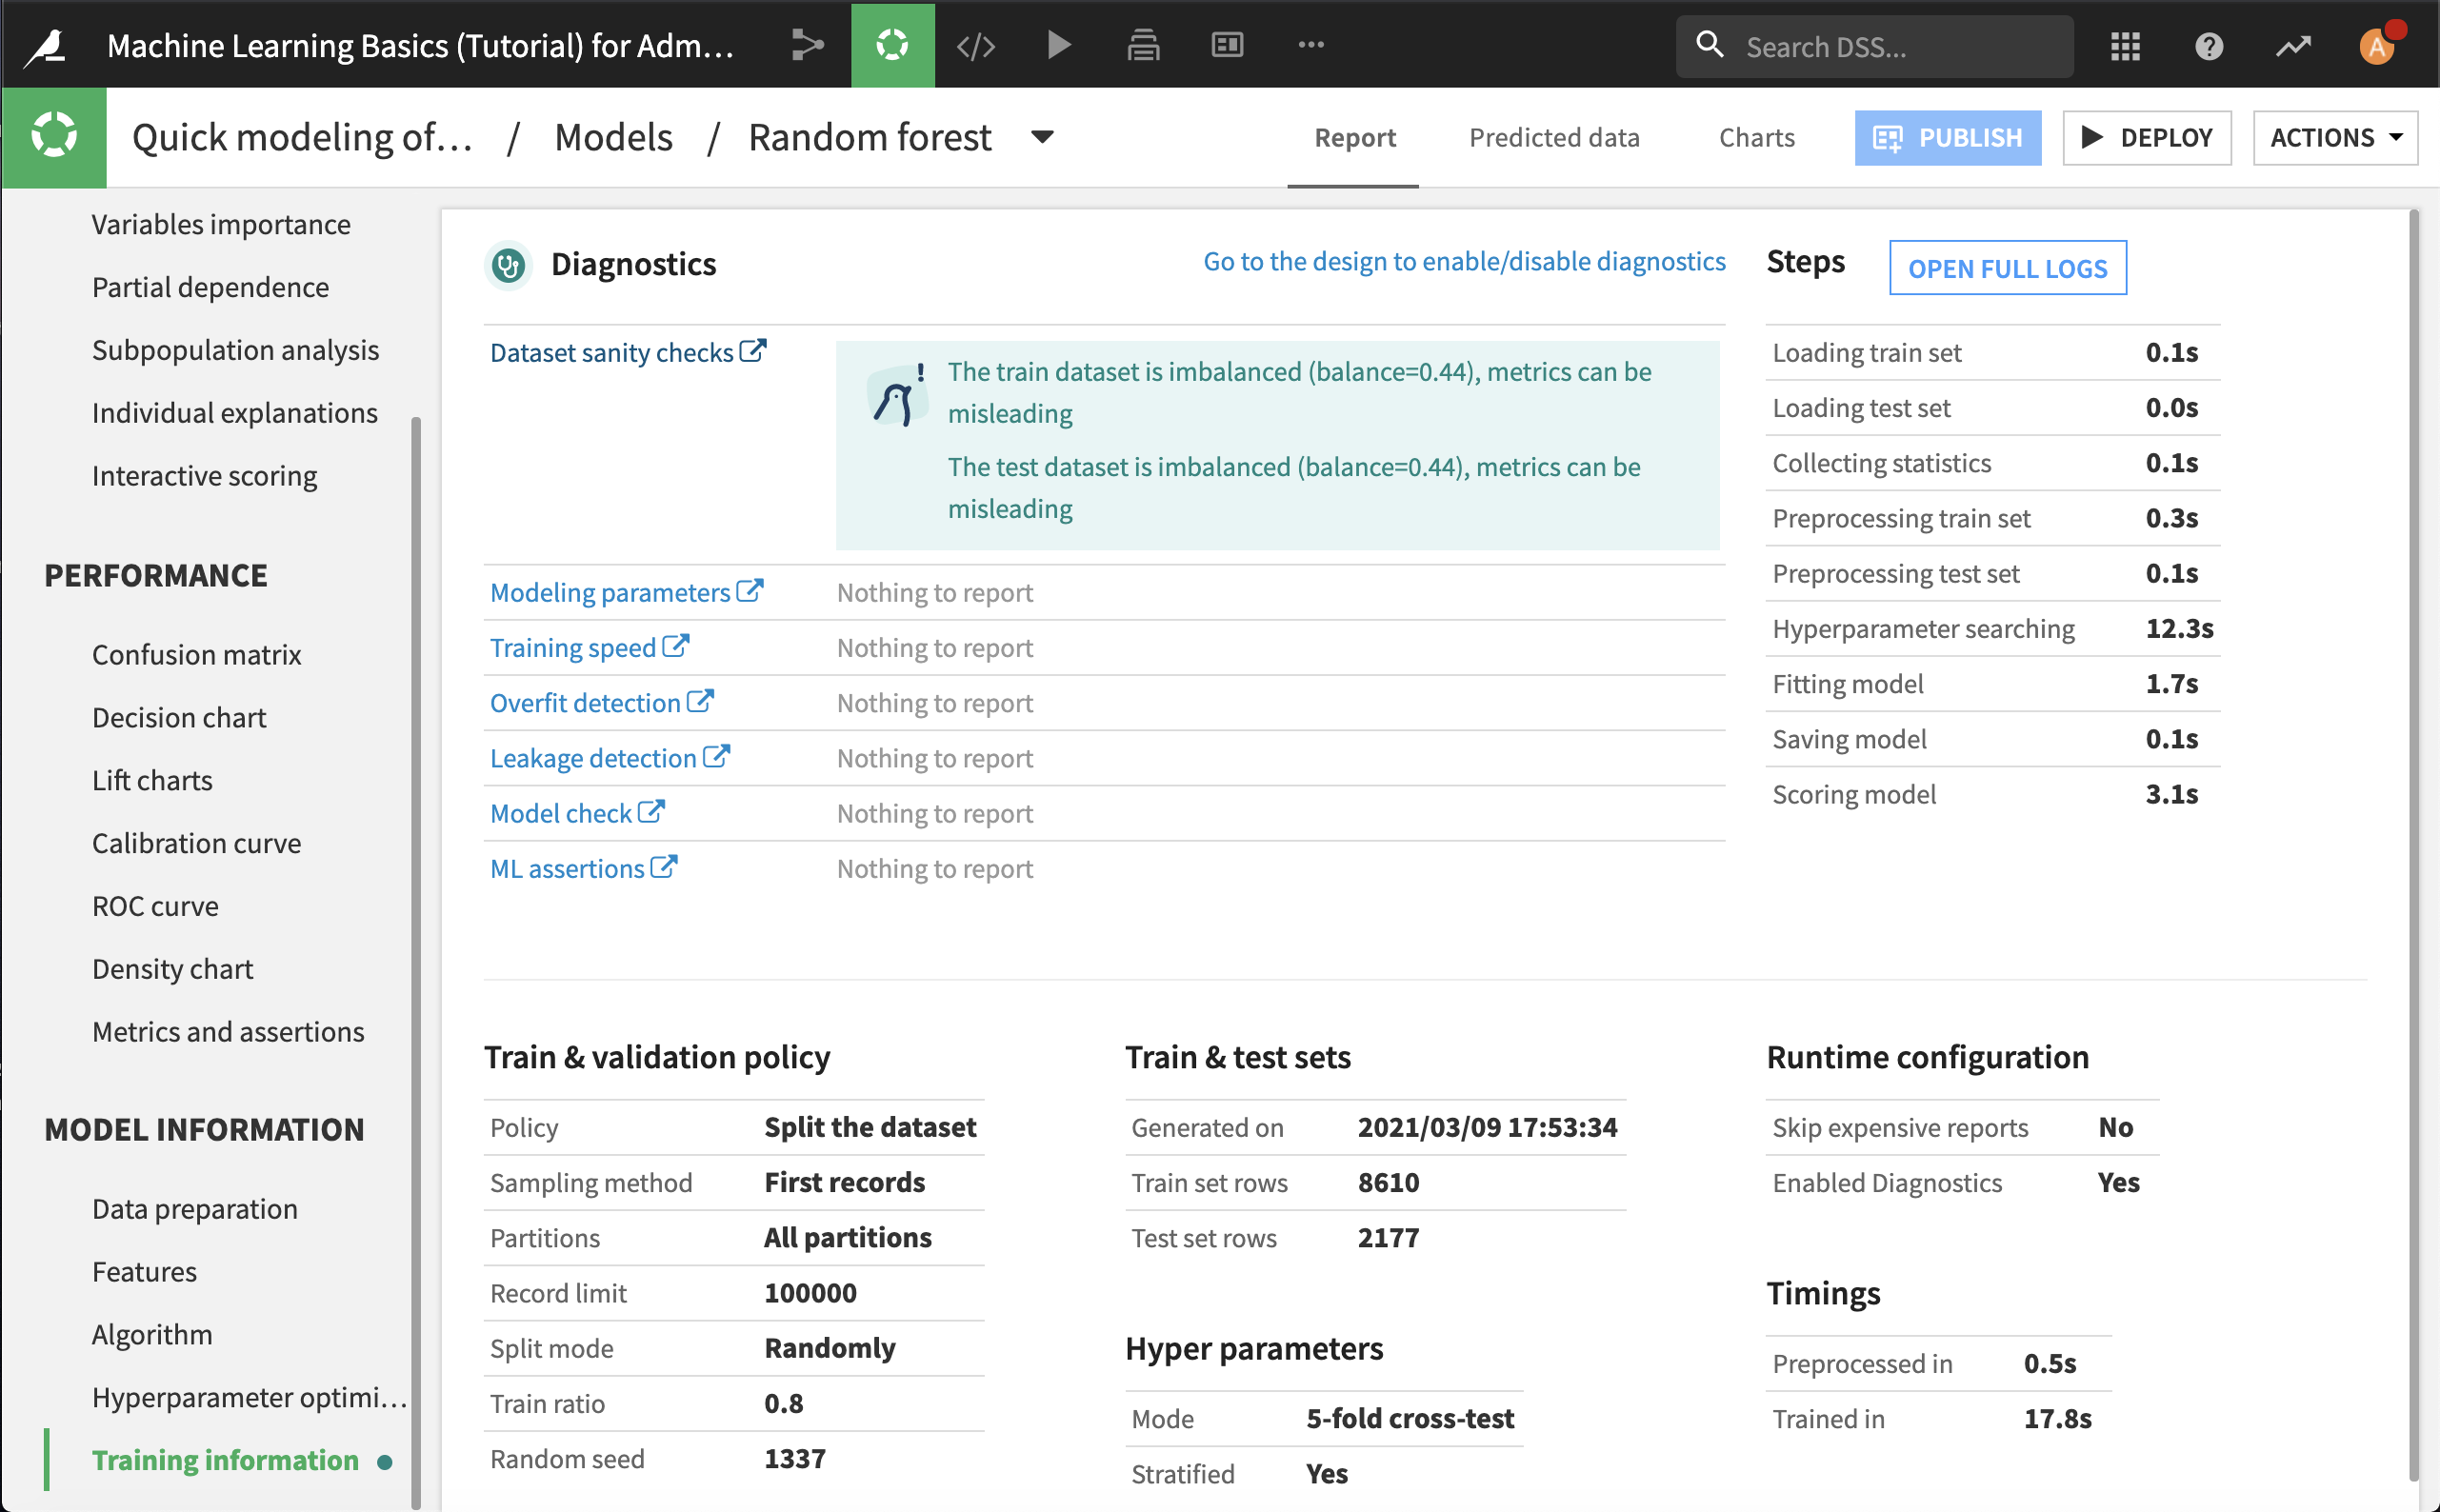
Click Diagnostics. This opens the model to the Training Information section.
The diagnostics warn that the training and test sets are imbalanced. Clicking on the link to the associated documentation, we see that this can cause our classification model to perform poorly when attempting to predict the underrepresented value.
In this dataset, it is the proportion of high revenue customers that is relatively small. Since these are the customers we want most to attract and retain, it’s important that we identified this issue and can take action to address it.
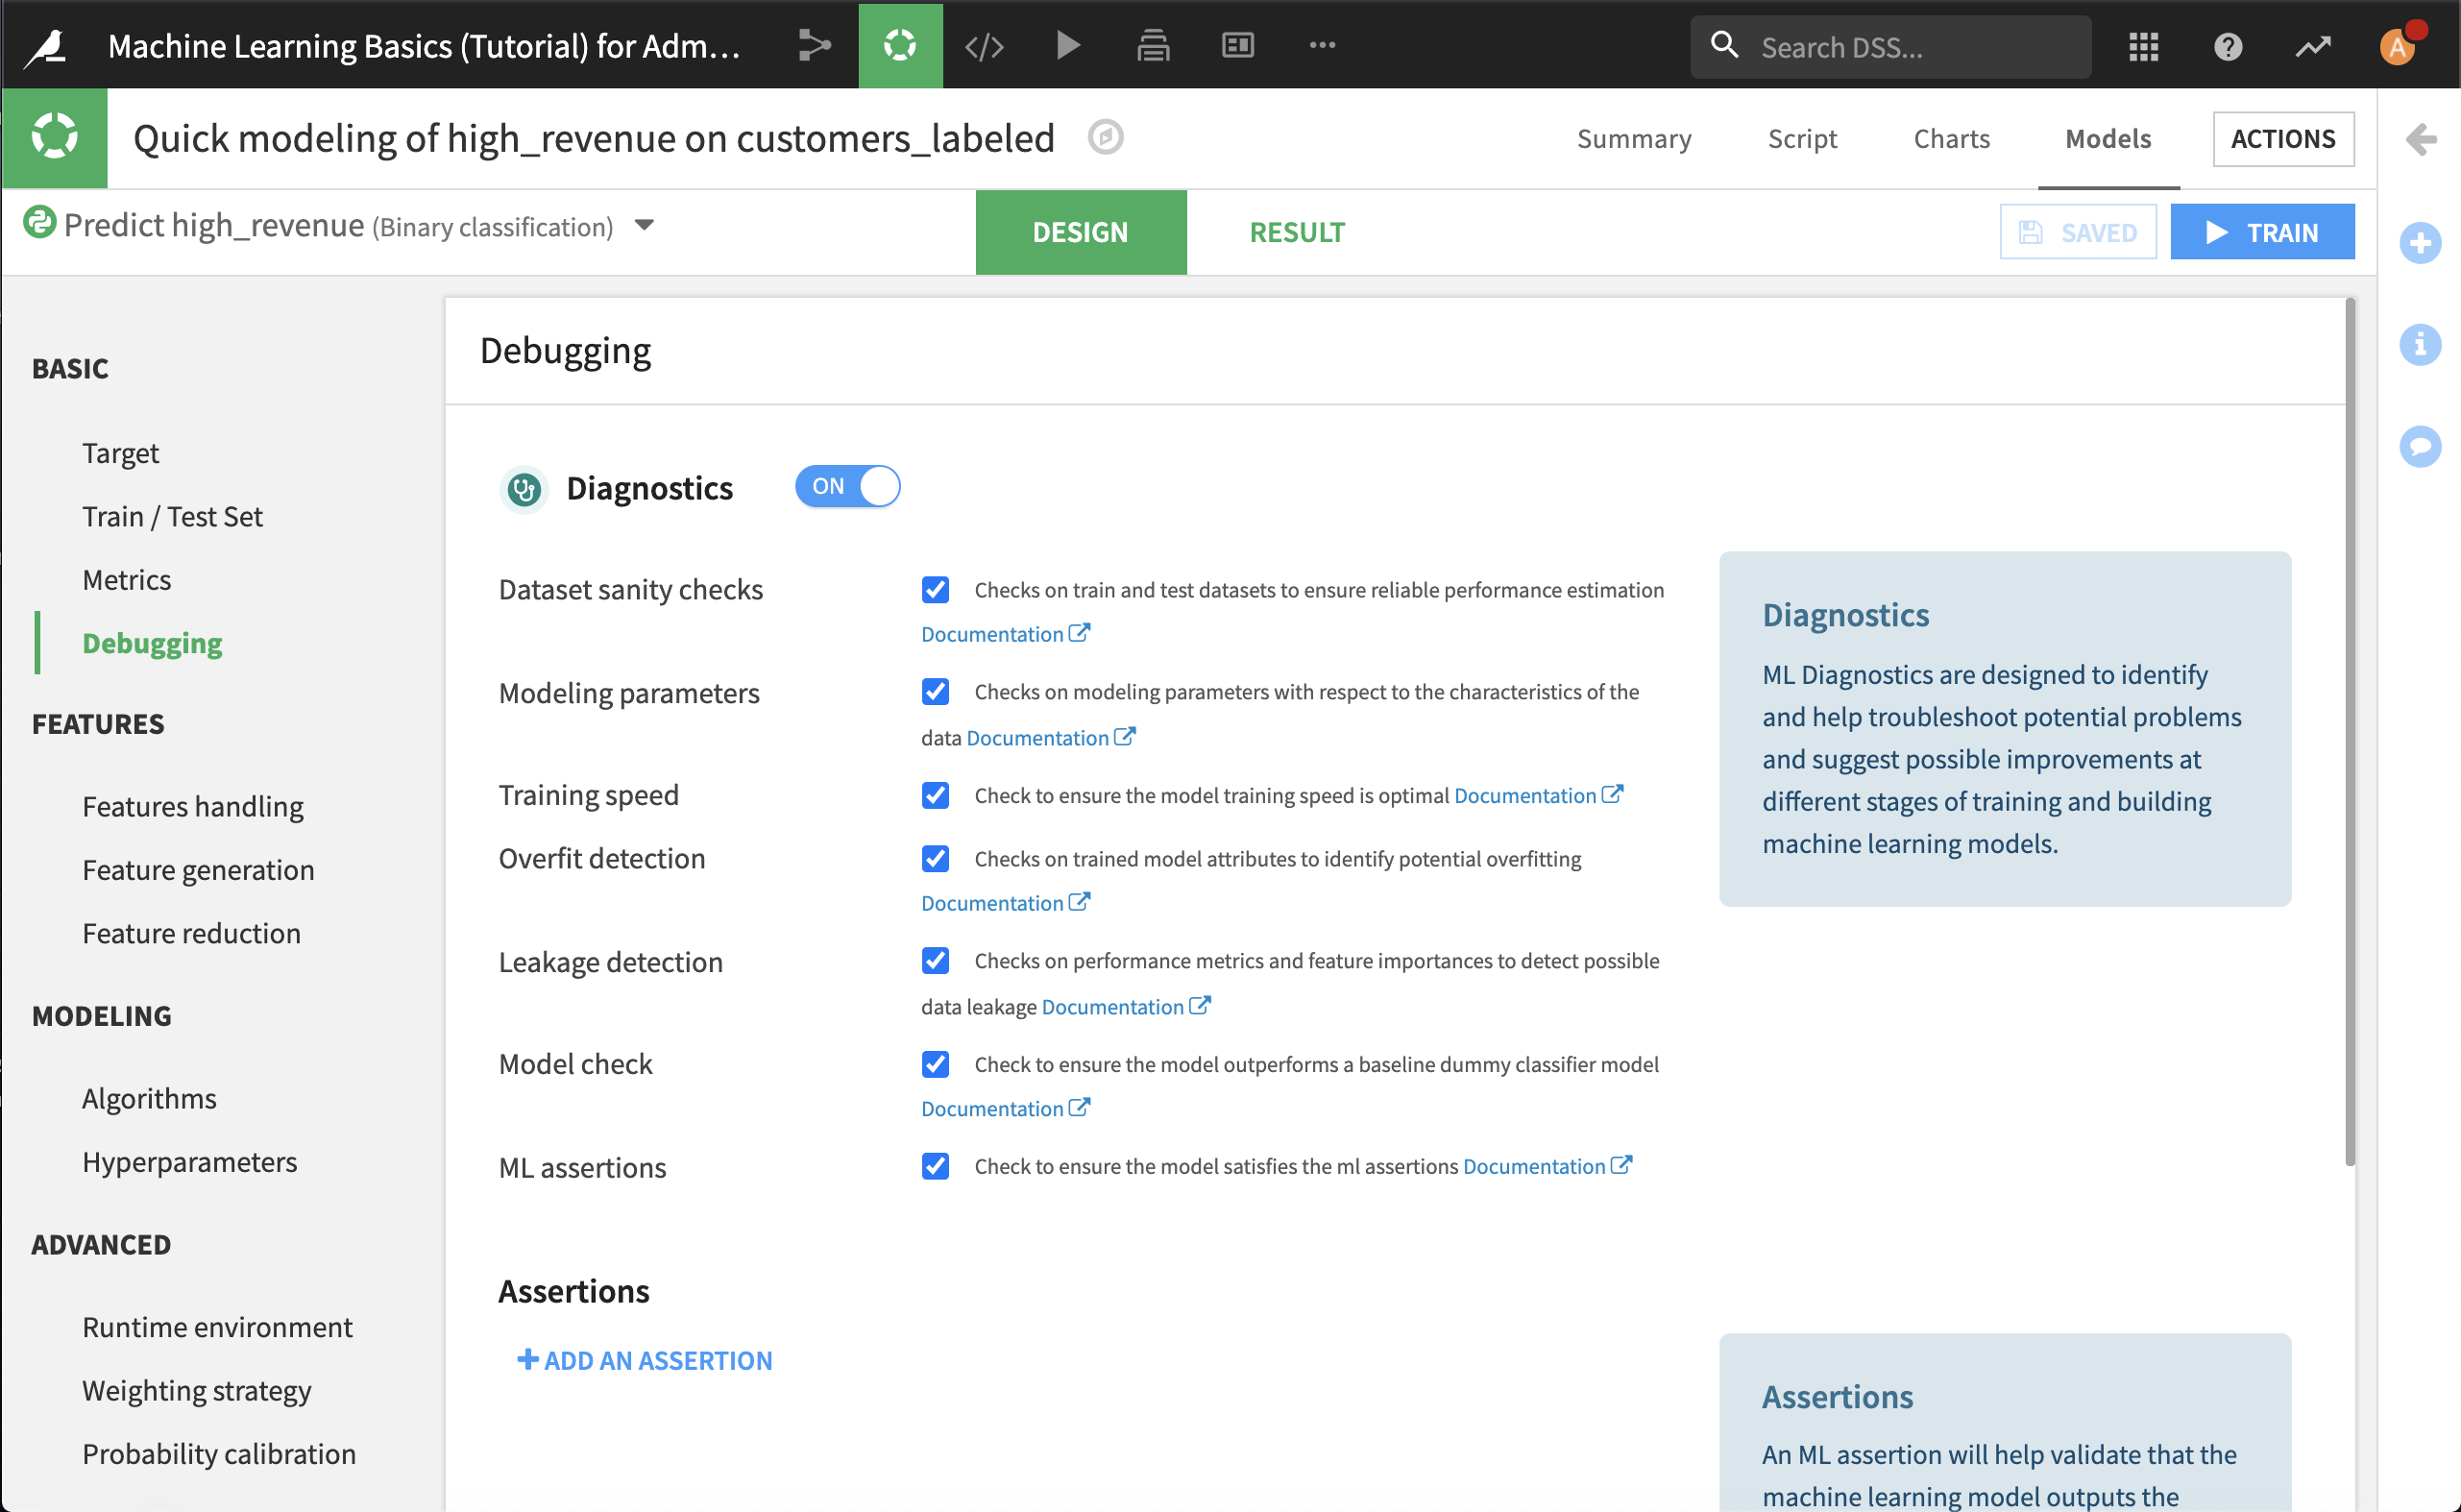
Setting Diagnostics
These checks are automatically activated by default, but you have the option to turn them off in the Design tab.
Click on the link to Go to the design to enable/disable diagnostics.