Analyze a Dataset
In this section, you will learn how to analyze datasets in Dataiku DSS.
From the Flow, double-click the transactions_joined_prepared dataset icon in order to open it.
Understand the Sampling Configuration
On opening the dataset, you’ll land in the Explore tab. It looks similar to a spreadsheet. Dataiku DSS displays a sample of the dataset. Sampling helps to give you immediate visual feedback, no matter the size of the dataset.
Note
By default, if no other sampling configuration has been defined, the Explore tab shows the first 10,000 rows of the dataset, but many other configurations are possible. Working with a sample makes it easy to work interactively (filtering, sorting, etc.) on even large datasets.
To view the sampling of this dataset:
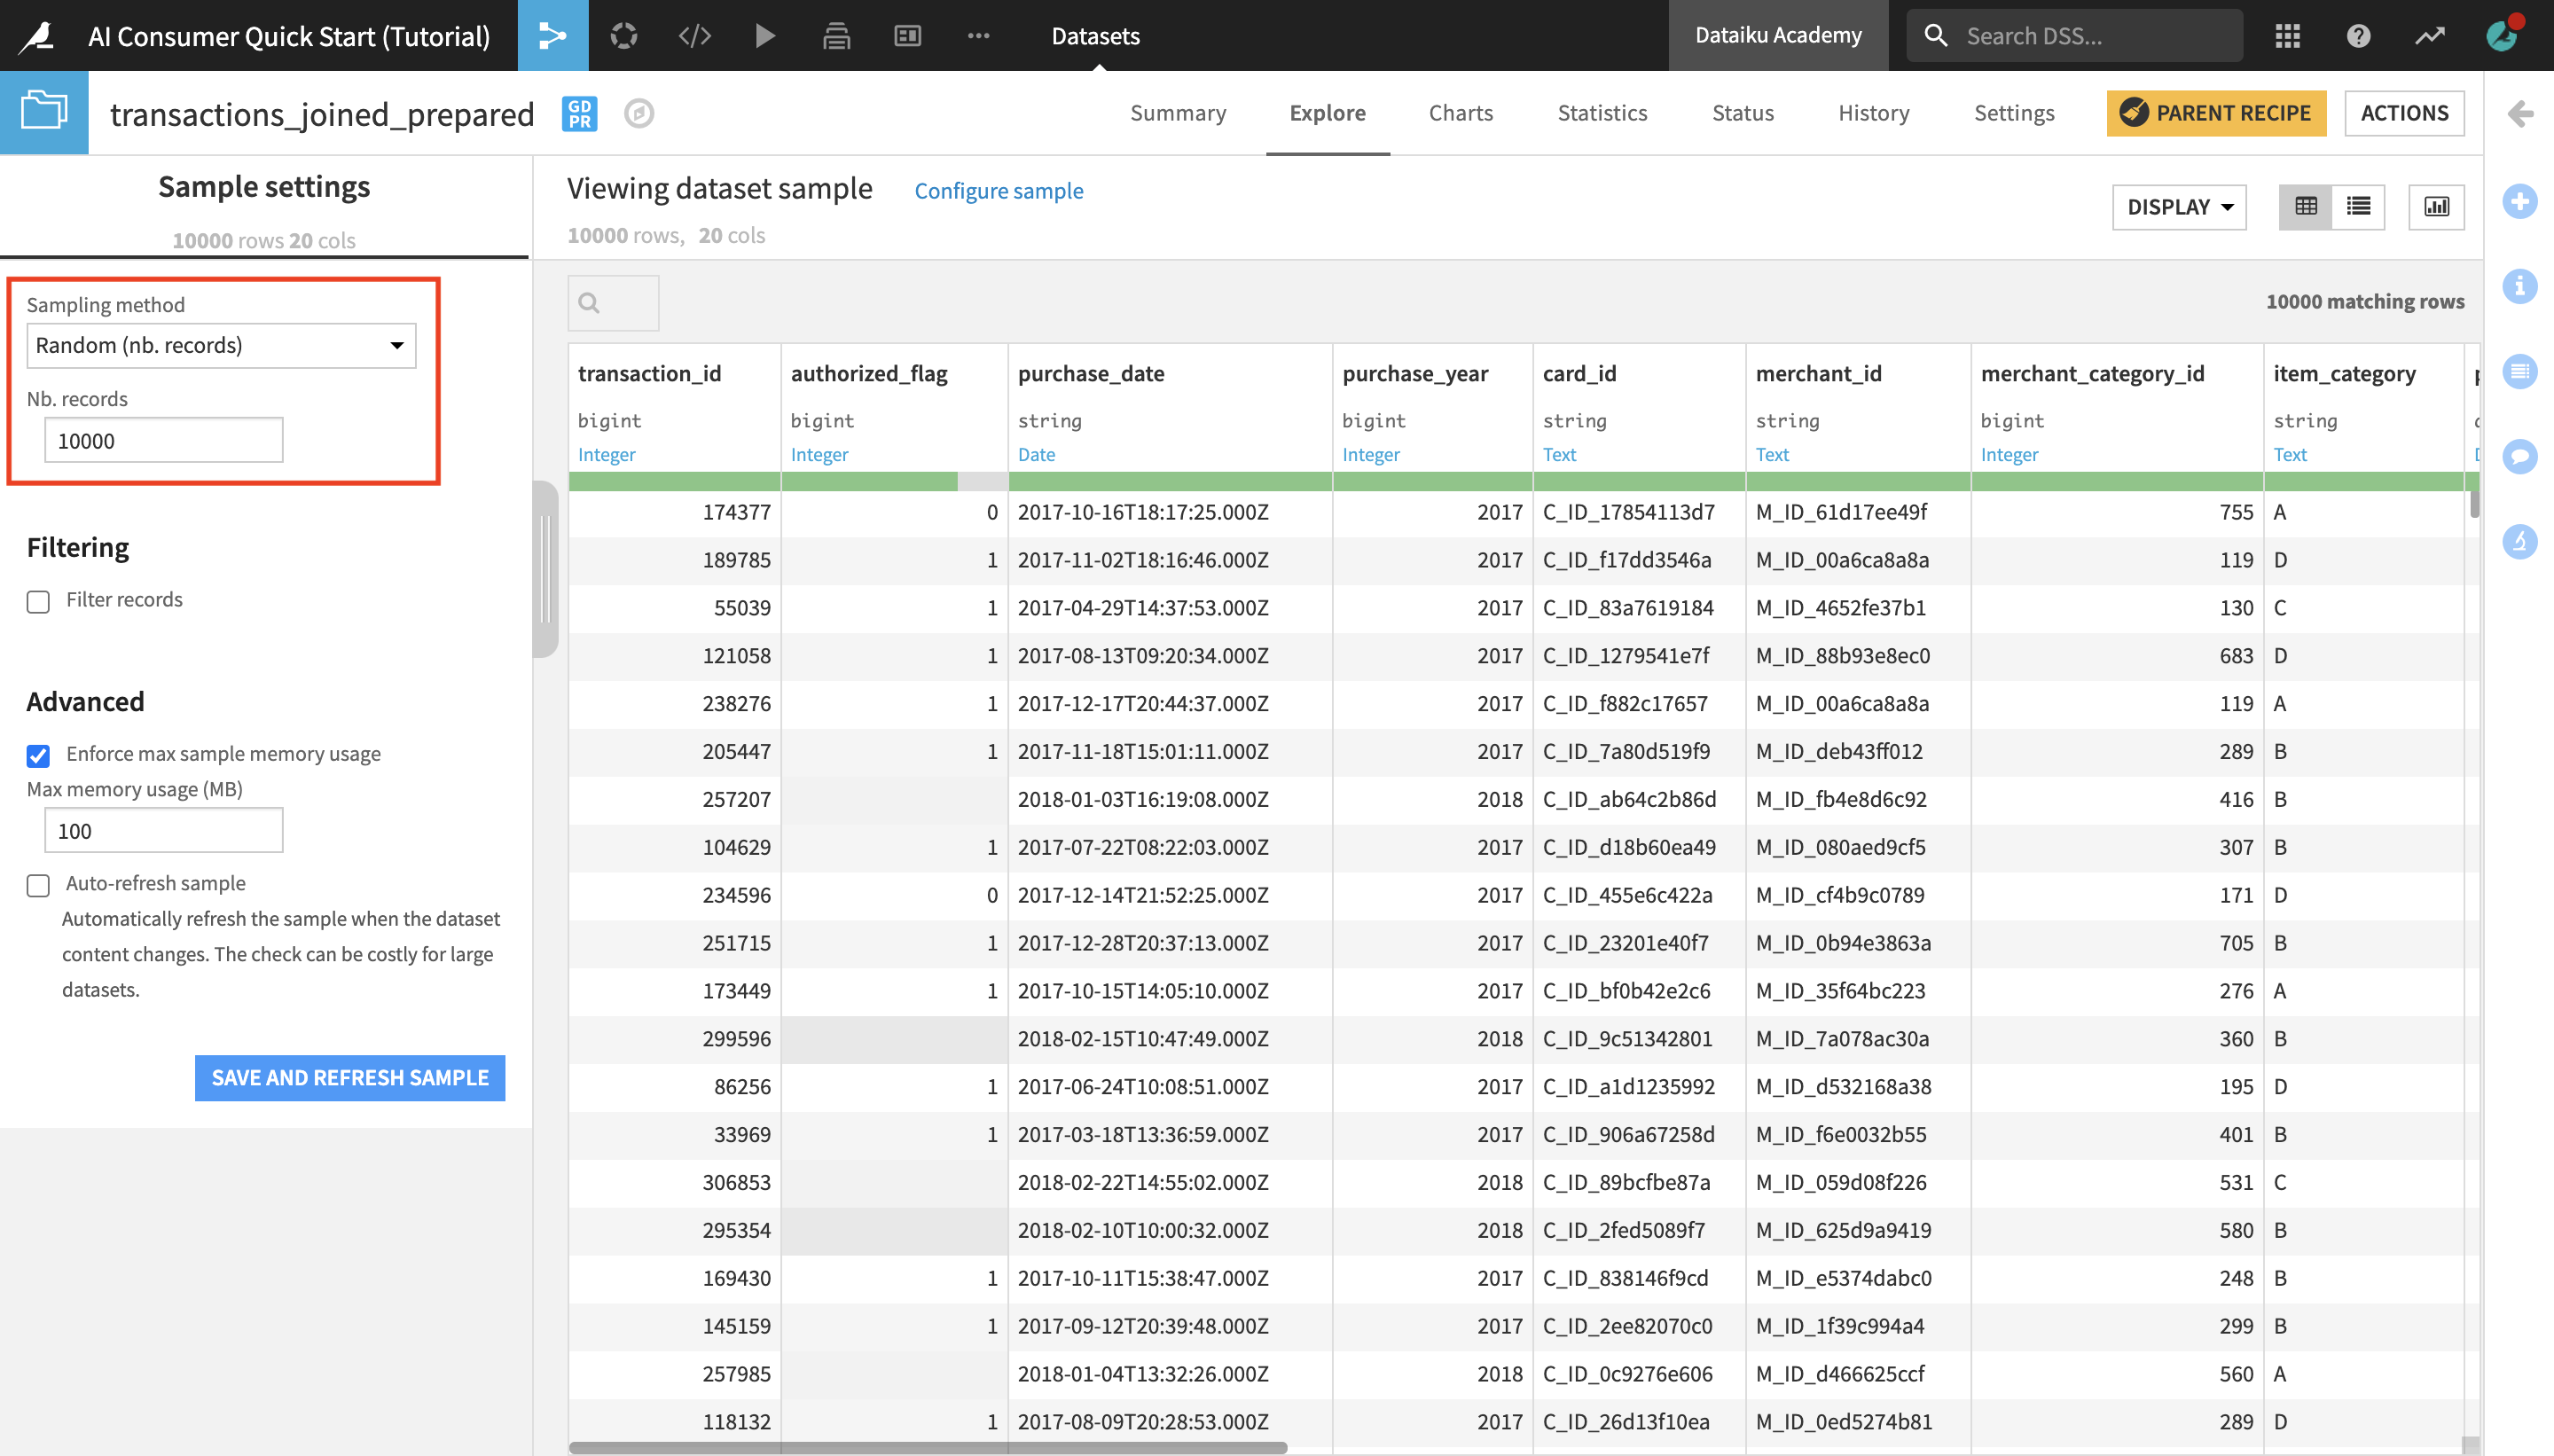
Near the top left of the screen, click on Configure sample.
Notice that the dataset has been configured to display a sample of 10,000 randomly selected rows.
Observe the Schema and Data Type
Let’s now look closer at the header of the table. At the top of each column is the column name, its storage type, and its meaning.
Note
Datasets in Dataiku DSS have a schema, which consists of the list of columns, with their names and storage types.
The storage type indicates how the dataset backend should store the column data, such as “string”, “boolean”, or “date”.
In addition to the schema, Dataiku DSS also displays the “meanings” of columns. The meaning is a rich semantic type automatically detected from the sample contents of the columns, such as Date, URL, IP address, gender, etc.
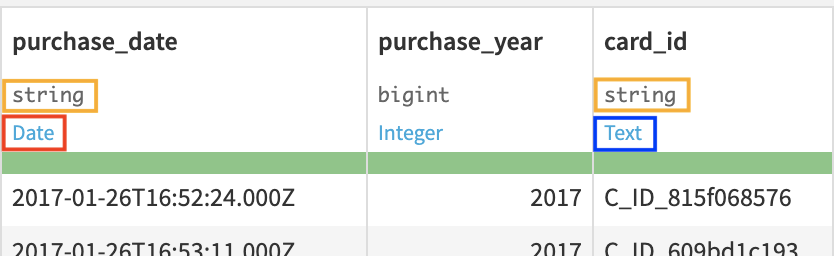
Notice that the storage type of both the purchase_date and the card_id columns is a string, but their meanings are different. Based on the current sample, Dataiku DSS detects the meaning of the purchase_date column as Date and that of card_id as Text.
Analyze Columns
Let’s now analyze the purchase_amount column.
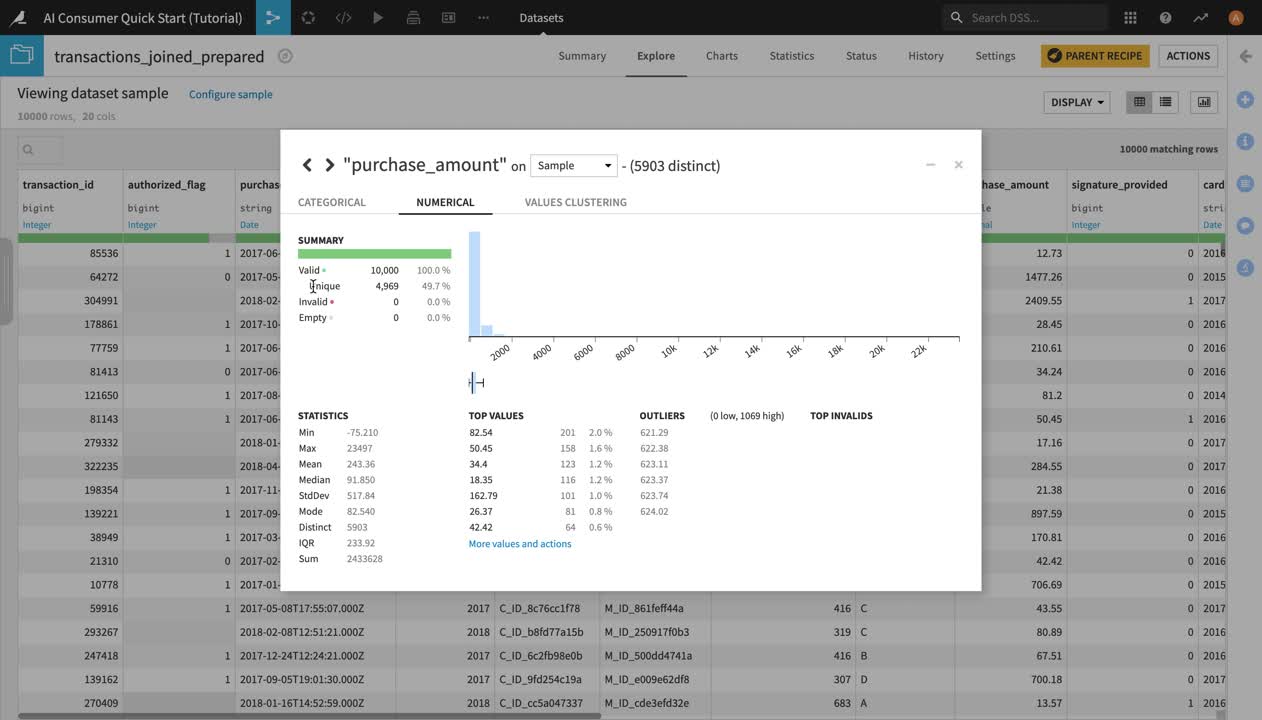
Click the dropdown arrow next to purchase_amount and select Analyze.
The Analyze window will pop open. Notice it’s using the previously configured sample of the data.
Note
You could choose to compute the metrics shown in the Analyze window on the whole dataset, by selecting “Whole Data” instead of “Sample” in the dropdown menu, but for the purpose of the tutorial, we’ll stick to the configured sample.
Users of the Dataiku DSS Explorer license should also bear in mind that they would not be able to change the sample of a dataset with this license.
In the Summary section of the Analyze window, you can see the number of valid, invalid, empty, and unique values in this column.
In the Statistics section, you can see the minimum, maximum, and average values of purchase_amount, as well as other key metrics.
Click ”X” to close the Analyze window.
View Metrics
Another way to display key measurements on your data is by looking at the Status tab in the dataset, which contains metrics and checks.
Note
Metrics are metadata used to take measurements on datasets, managed folders, and saved models. They allow us to monitor the evolution of a Dataiku DSS item. In a dataset, we could use them to compute, for example, the number of columns, the number of rows (or records), the number of missing values of a column, or the average of a numerical value column, among other things.
Metrics are often used in combination with checks to verify their evolution. Checks are used to set conditions for the validity of a metric.
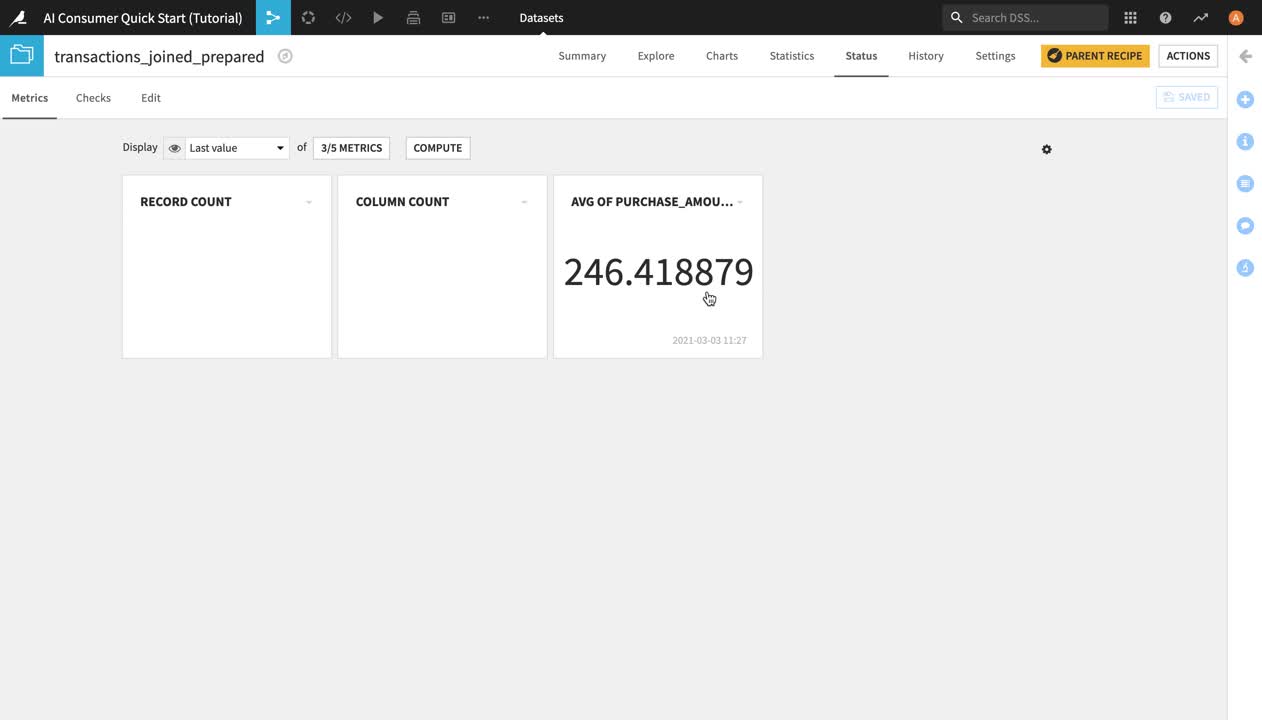
You are now in the Metrics view page. By default, the view mode is set to “Last value” and it displays tiles with the last computed value of the metrics. Presently, only two metrics appear in the form of tiles – the column count and the record (or row) count. Their tiles are blank because they haven’t been previously computed.
You can change the Metrics view mode by clicking on Last value and selecting another view option from the dropdown menu. You can also click the METRICS button to the right in order to select which metrics to display – by default, only a handful of the available metrics are displayed.
Click the METRICS button. A window will pop up where you can select which metrics to display.
Select Avg of purchase_amount and click Save. The “Avg of purchase_amount” metric, which had been previously created and computed by another person working on this project, now appears as a tile.
Warning
If you’re working with an Explorer license on Dataiku DSS, you will not be able to compute metrics yourself, but you can use them for reference when exploring projects created by your colleagues.