Explore and Join Data
Now we have all of the raw data needed for this project. Let’s explore what’s inside these datasets.
From the Flow, double click on the crm_last_year dataset to open it.
Configure a Sample
On opening a dataset, you’ll find the Explore tab. It looks similar to a spreadsheet, but with a few key differences. For starters, you are viewing only a sample of the dataset.
Note
By default, the Explore tab shows the first 10,000 rows of the dataset, but many other configurations are possible. Working with a sample makes it easy to work interactively (filtering, sorting, etc.) on even very large datasets.
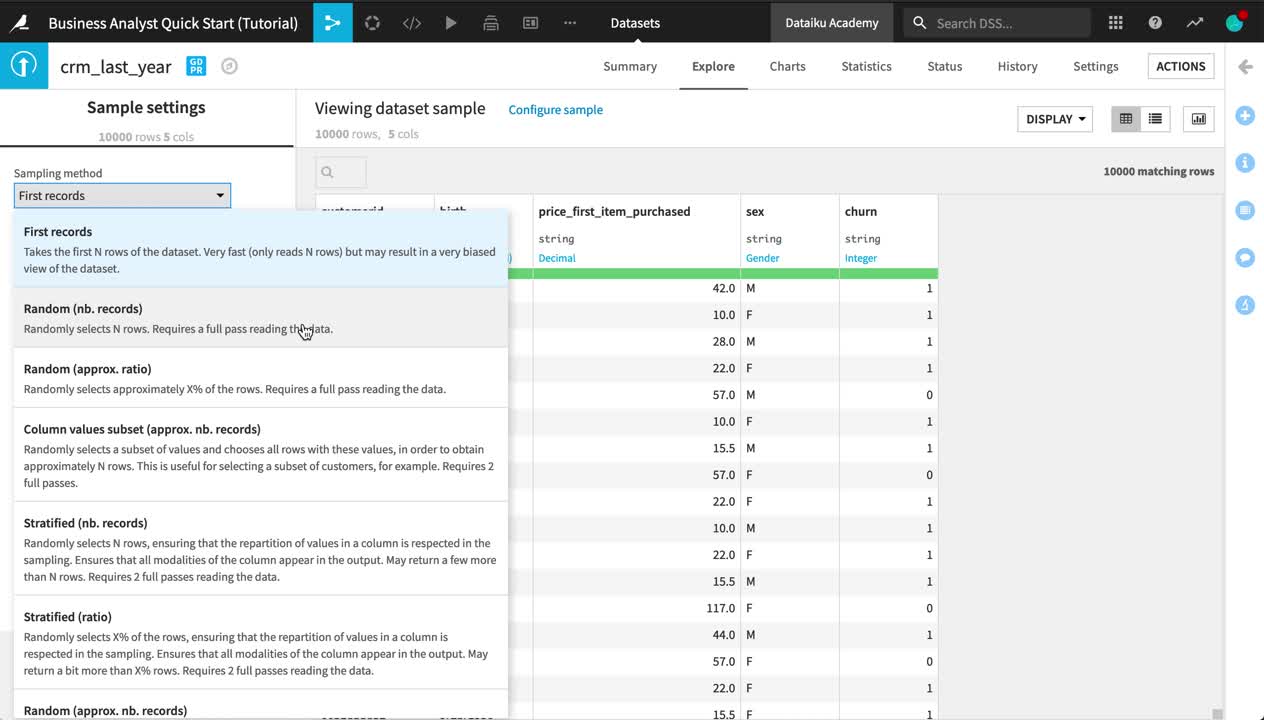
Near the top left of the screen, click on Configure sample.
Change the Sampling method from “First records” to Random (nb. records).
Click Save and Refresh Sample.
On the right sidebar, click to open the Details panel (marked with an “i”).
Under Status, click Compute. Refresh the count of records.
Tip
Although the sample includes only 10,000 records, the actual dataset is larger. Dataiku DSS itself imposes no limit on how large a dataset can be.
Observe the Schema
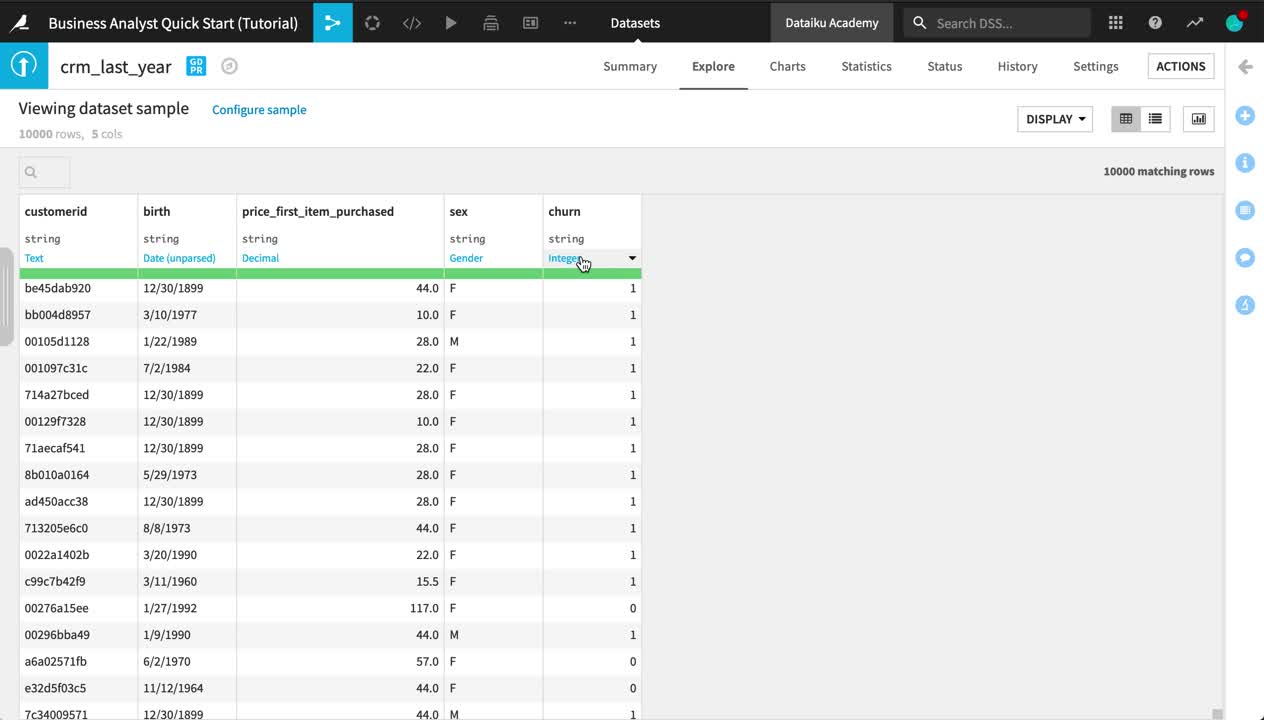
Look closer at the header of the table. At the top of each column is the column name, its storage type, and its meaning.
Note
Datasets in Dataiku DSS have a schema. The schema of a dataset is the list of columns, with their names and types.
A column in Dataiku DSS has two kinds of “types”:
The storage type indicates how the dataset backend should store the column data, such as “string”, “boolean”, or “date”.
The meaning is a rich semantic type automatically detected from the sample contents of the columns, such as URL, IP address, or sex.
Note how, at this point, the storage type of all columns is a string, but Dataiku DSS has inferred the meanings to be “Text”, “Date (unparsed)”, “Decimal”, “Gender”, and “Integer”.
Click the column heading of the customerid column, and then select Analyze from the menu.
Use the arrows at the top left of the dialog to scroll through each column.
Tip
Note how the Analyze tool displays different insights for categorical and numerical variables.
Join the Data
Thus far, your Flow only contains datasets. To take action on datasets, you need to apply recipes.
The web and CRM (customer relationship management) data both contain a column of customer IDs. Let’s join these two datasets together using a visual recipe.
Note
Recipes in Dataiku DSS contain the transformation steps, or processing logic, that act upon datasets. In the Flow, they are represented by circles connecting the input and output datasets.
Visual recipes (yellow circles) accomplish the most common data transformation operations, such as cleaning, grouping, and filtering, through a point-and-click interface.
You are also free to define your own processing logic in a code recipe (orange circle), using a language such as Python, R, or SQL.
A plugin recipe allows coders to wrap custom code behind a visual interface, thereby extending the native capabilities of Dataiku DSS.
Select the web_last_year dataset from the Flow.
Choose Join with from the “Visual recipes” section of the Actions sidebar near the top right of the screen.
Choose crm_last_year as the second input dataset.
Name the output dataset
training_datainstead of the default name.Leave the default options for “Store into” and “Format”.
If you are using Dataiku Online, these options will be “dataiku-managed-storage” and “Parquet”, as opposed to “filesystem_managed” and “CSV” if you are using a local instance.
Create the recipe.
Once the recipe is initiated, you can adjust the settings.
On the Join step, click on Left Join to observe the selected join type and conditions.
If using Dataiku Online, click Add a Condition, and then the plus icon. The Join condition should be a left join of the customer_id column of the left dataset and the customerid column of the right dataset.
If using the free edition or any other local instance, this should already be selected by default.
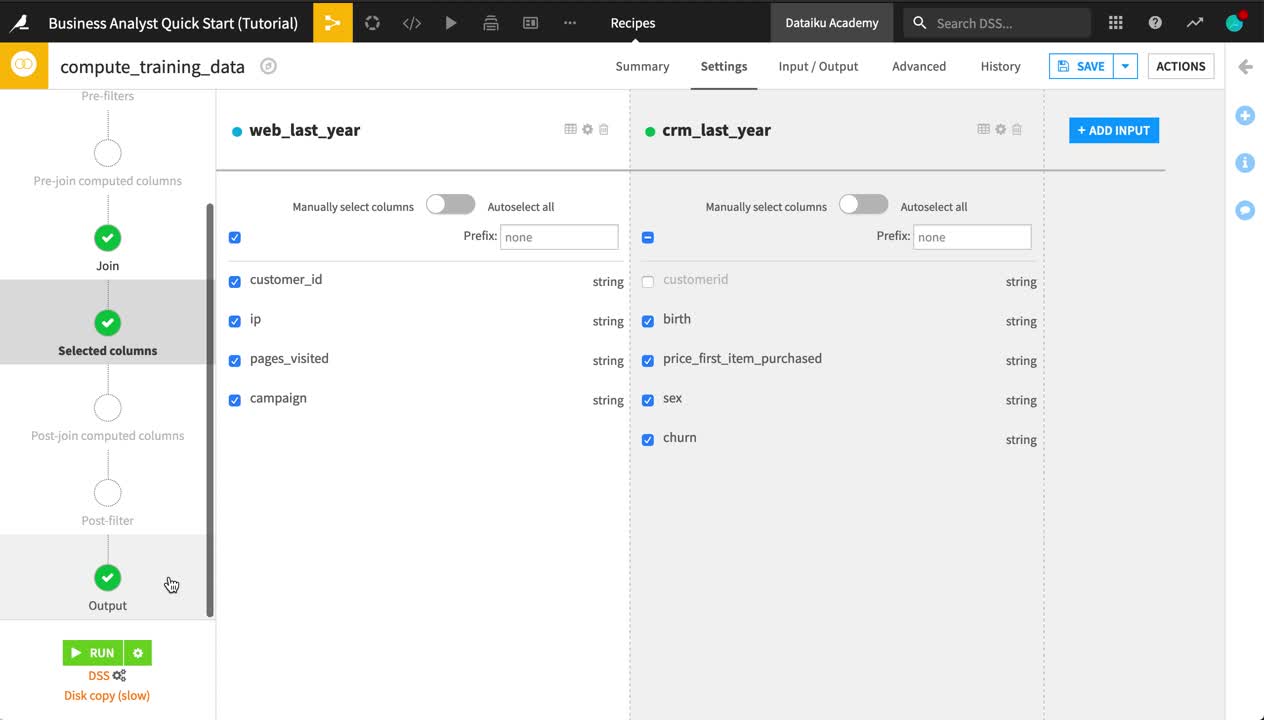
On the Selected columns step, uncheck the customerid column from the crm_last_year dataset.
On the Output step, note the output column names.
Before running it, Save the recipe.
Click Update Schema, and return to the Flow.
Tip
See how the Join recipe and output dataset are now represented in the Flow. The output dataset is drawn in an outline because it has not yet been built. You have only defined the instructions as to how it should be created.
Run a Recipe
Now the recipe is ready to be run. However, you can choose to run the recipe with different execution engines, depending on the infrastructure available to your instance and the type of recipe at hand.
Note
By default, Dataiku DSS will select the available execution engine that it detects to be the most optimal. For this tutorial, that is the DSS engine.
If for example though, the input and output datasets were stored in a SQL database, and the recipe was a SQL-compatible operation, then the in-database engine would be chosen. This is not just for SQL code recipes. Many visual recipes and processors in the Prepare recipe can be translated to SQL queries.
In other situations, such as when working with HDFS or S3 datasets, the Spark engine would be available if it is installed.
From the Flow, double click to open the Join recipe.
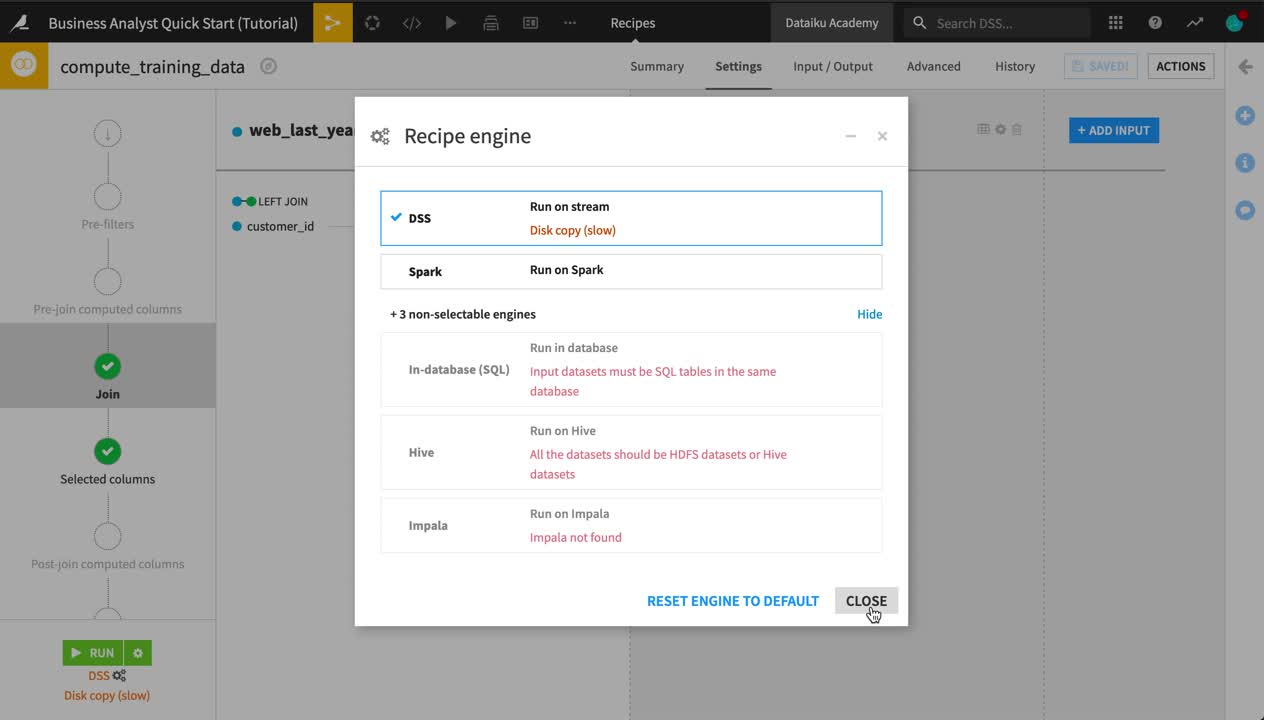
In the Join recipe, click the gear icon at the bottom left of the screen to view the available (and not available) engines. Keep the DSS engine.
Click Run.
When the recipe is finished running, click to open the output dataset.
Tip
Note the icon on the output dataset to the Join recipe. If you are working on Dataiku Online, you will see an S3 icon, as that is where Dataiku is storing the output. If you are working on a local instance, however, you will see the icon for a managed filesystem dataset.
Investigate Missing Data
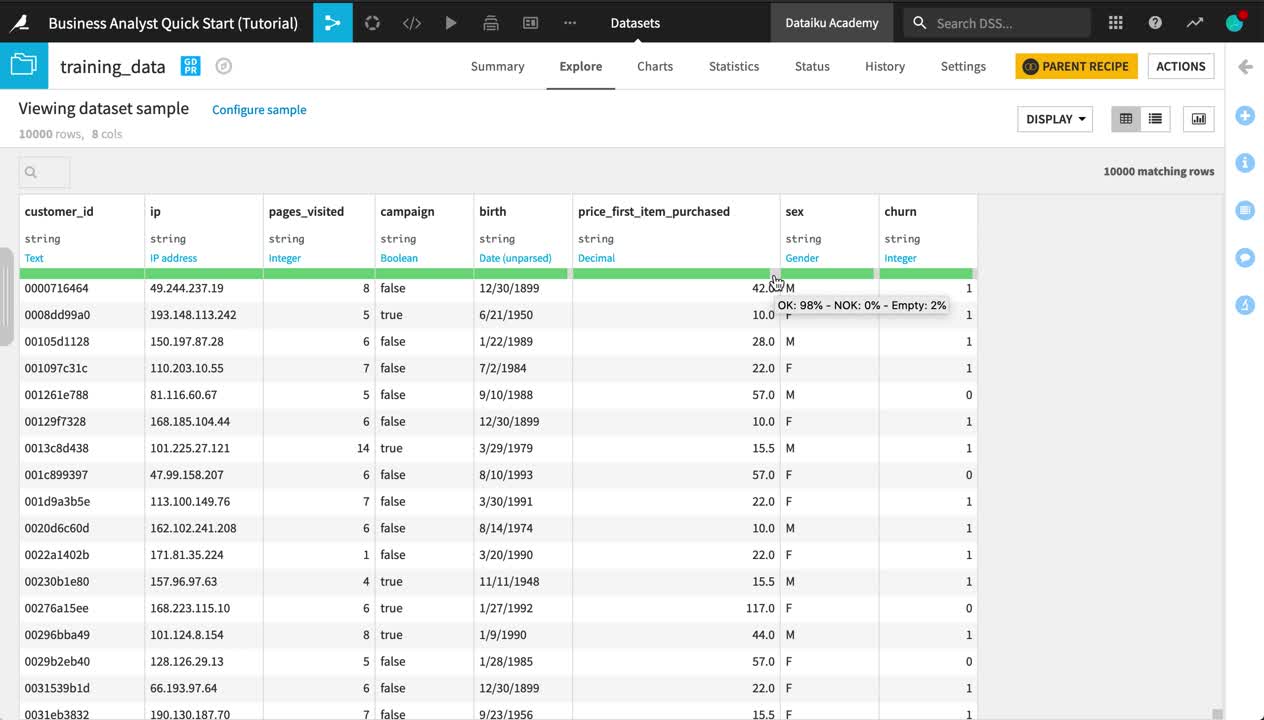
In datasets like crm_last_year and web_last_year, you’ll notice a completely green bar beneath the schema of each column. However, in training_data, this same bar has a small gray portion for columns birth, price_first_item_purchased, sex, and churn.
Note
For each column, this bar indicates the extent to which the current sample is not empty and matches the inferred meaning.
Green represents non-empty “OK” values that match the column’s inferred meaning.
Red indicates non-empty values that do not match the column’s inferred meaning.
Gray represents empty values.
Open training_data to confirm the empty values in columns like churn.
Click the column heading of the churn column, and then select Analyze from the menu.
Change “Sample” to “Whole data”, and click Save and Compute on this column to determine how many values are empty for this column.
Adjust a Recipe
The empty values in the output dataset result from rows in web_last_year not having a matching customer ID in crm_last_year. In this case, let’s just remove these rows.
From the training_data dataset, click Parent Recipe near the top right of the screen to return to the settings of the Join recipe.
On the Join step, click on Left Join.
Navigate to Join Type, and choose an Inner join to drop rows that do not have a match in both datasets.
All of the other settings remain the same so click Run to execute the recipe with the new join type.
Open the output dataset once more, and confirm that there are no longer any empty values in columns like churn.

Tip
The system of dependencies in the Flow between input datasets, recipes, and output datasets makes it possible to adjust or re-run recipes as needed without fear of altering the input data. As you will see later, it also provides the groundwork for a variety of different build strategies.