Getting Started
Dataiku DSS is a collaborative, end-to-end data science and machine learning platform that unites data analysts, data scientists, data engineers, architects, and business users in a common space to bring faster business insights.
In this quick start tutorial, you will be introduced to many of the essential capabilities of Dataiku DSS by walking through a simple use case: predicting customer churn. Working towards that goal, you will:
connect to data sources,
prepare training data,
build machine learning models,
use one to generate predictions on new, unseen records, and
communicate results in a dashboard.
Note
This hands-on tutorial is geared towards a Business Analyst entirely new to Dataiku DSS. It focuses on using the point-and-click interface. If you are more interested in what Dataiku DSS offers for coders, you might prefer to check out the quick start tutorials for a Data Scientist or a Data Engineer.
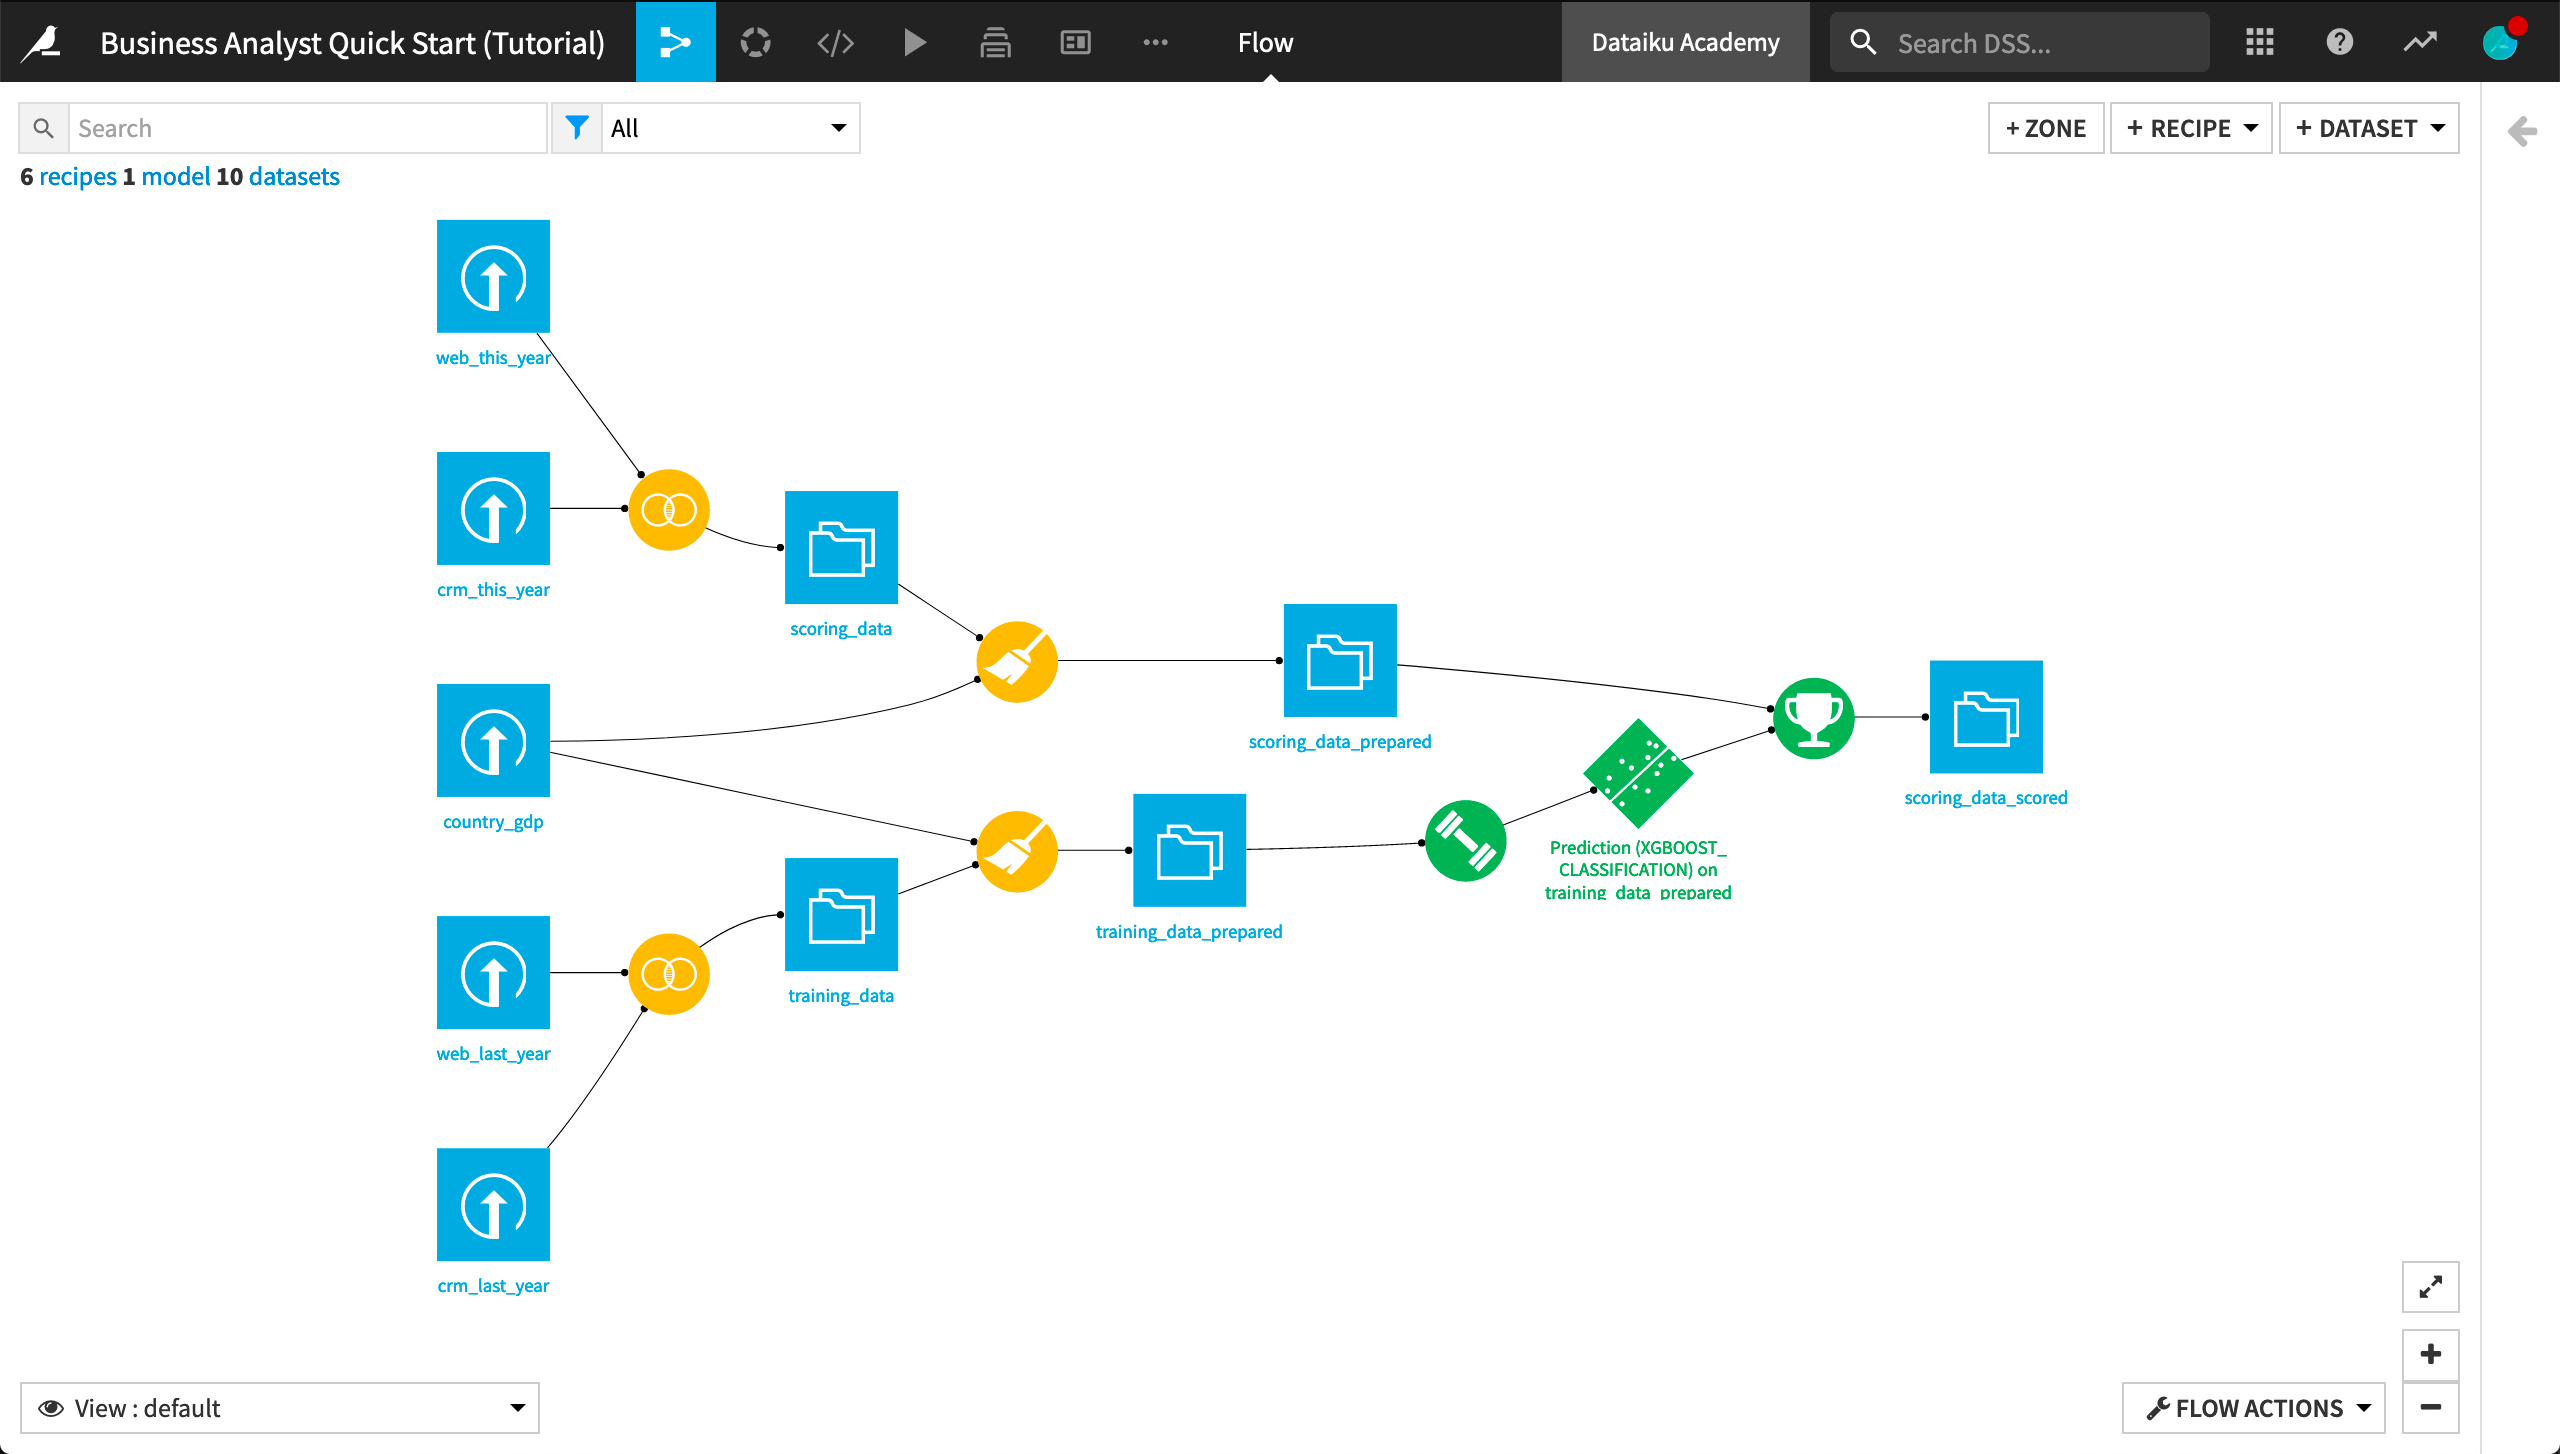
When you’re finished, you will have built the workflow below and understand all of its components!
Prerequisites
To follow along with the steps in this tutorial, you will need access to a Dataiku DSS instance (version 9.0 or above). If you do not already have access, you can get started in one of two ways:
install the free edition locally, or
start a 14-Day Free Online Trial.
You’ll also need to download this country_gdp.csv file to be uploaded during the tutorial.
Tip
Take a moment to arrange these instructions and your Dataiku DSS instance in the most productive way for your and your workstation–for example, using separate tabs or windows.
For each section below, written instructions are recorded in bullet points, but you can also find a screencast at the end of each section that records all of the actions described. Use these short videos as your guide!
You can also find a read-only completed version of the final project in the public gallery.
Create a Project
Let’s get started! After creating an account and logging in, the first page you’ll see is the Dataiku DSS homepage. From this page, you’ll be able to browse projects, recent items, dashboards, and applications shared with you.
Note
A Dataiku DSS project is a holder for all work on a particular activity.
You can create a new project in a few different ways. You can start a blank project or import a zip file. You might also have projects already shared with you based on the user groups to which you belong.
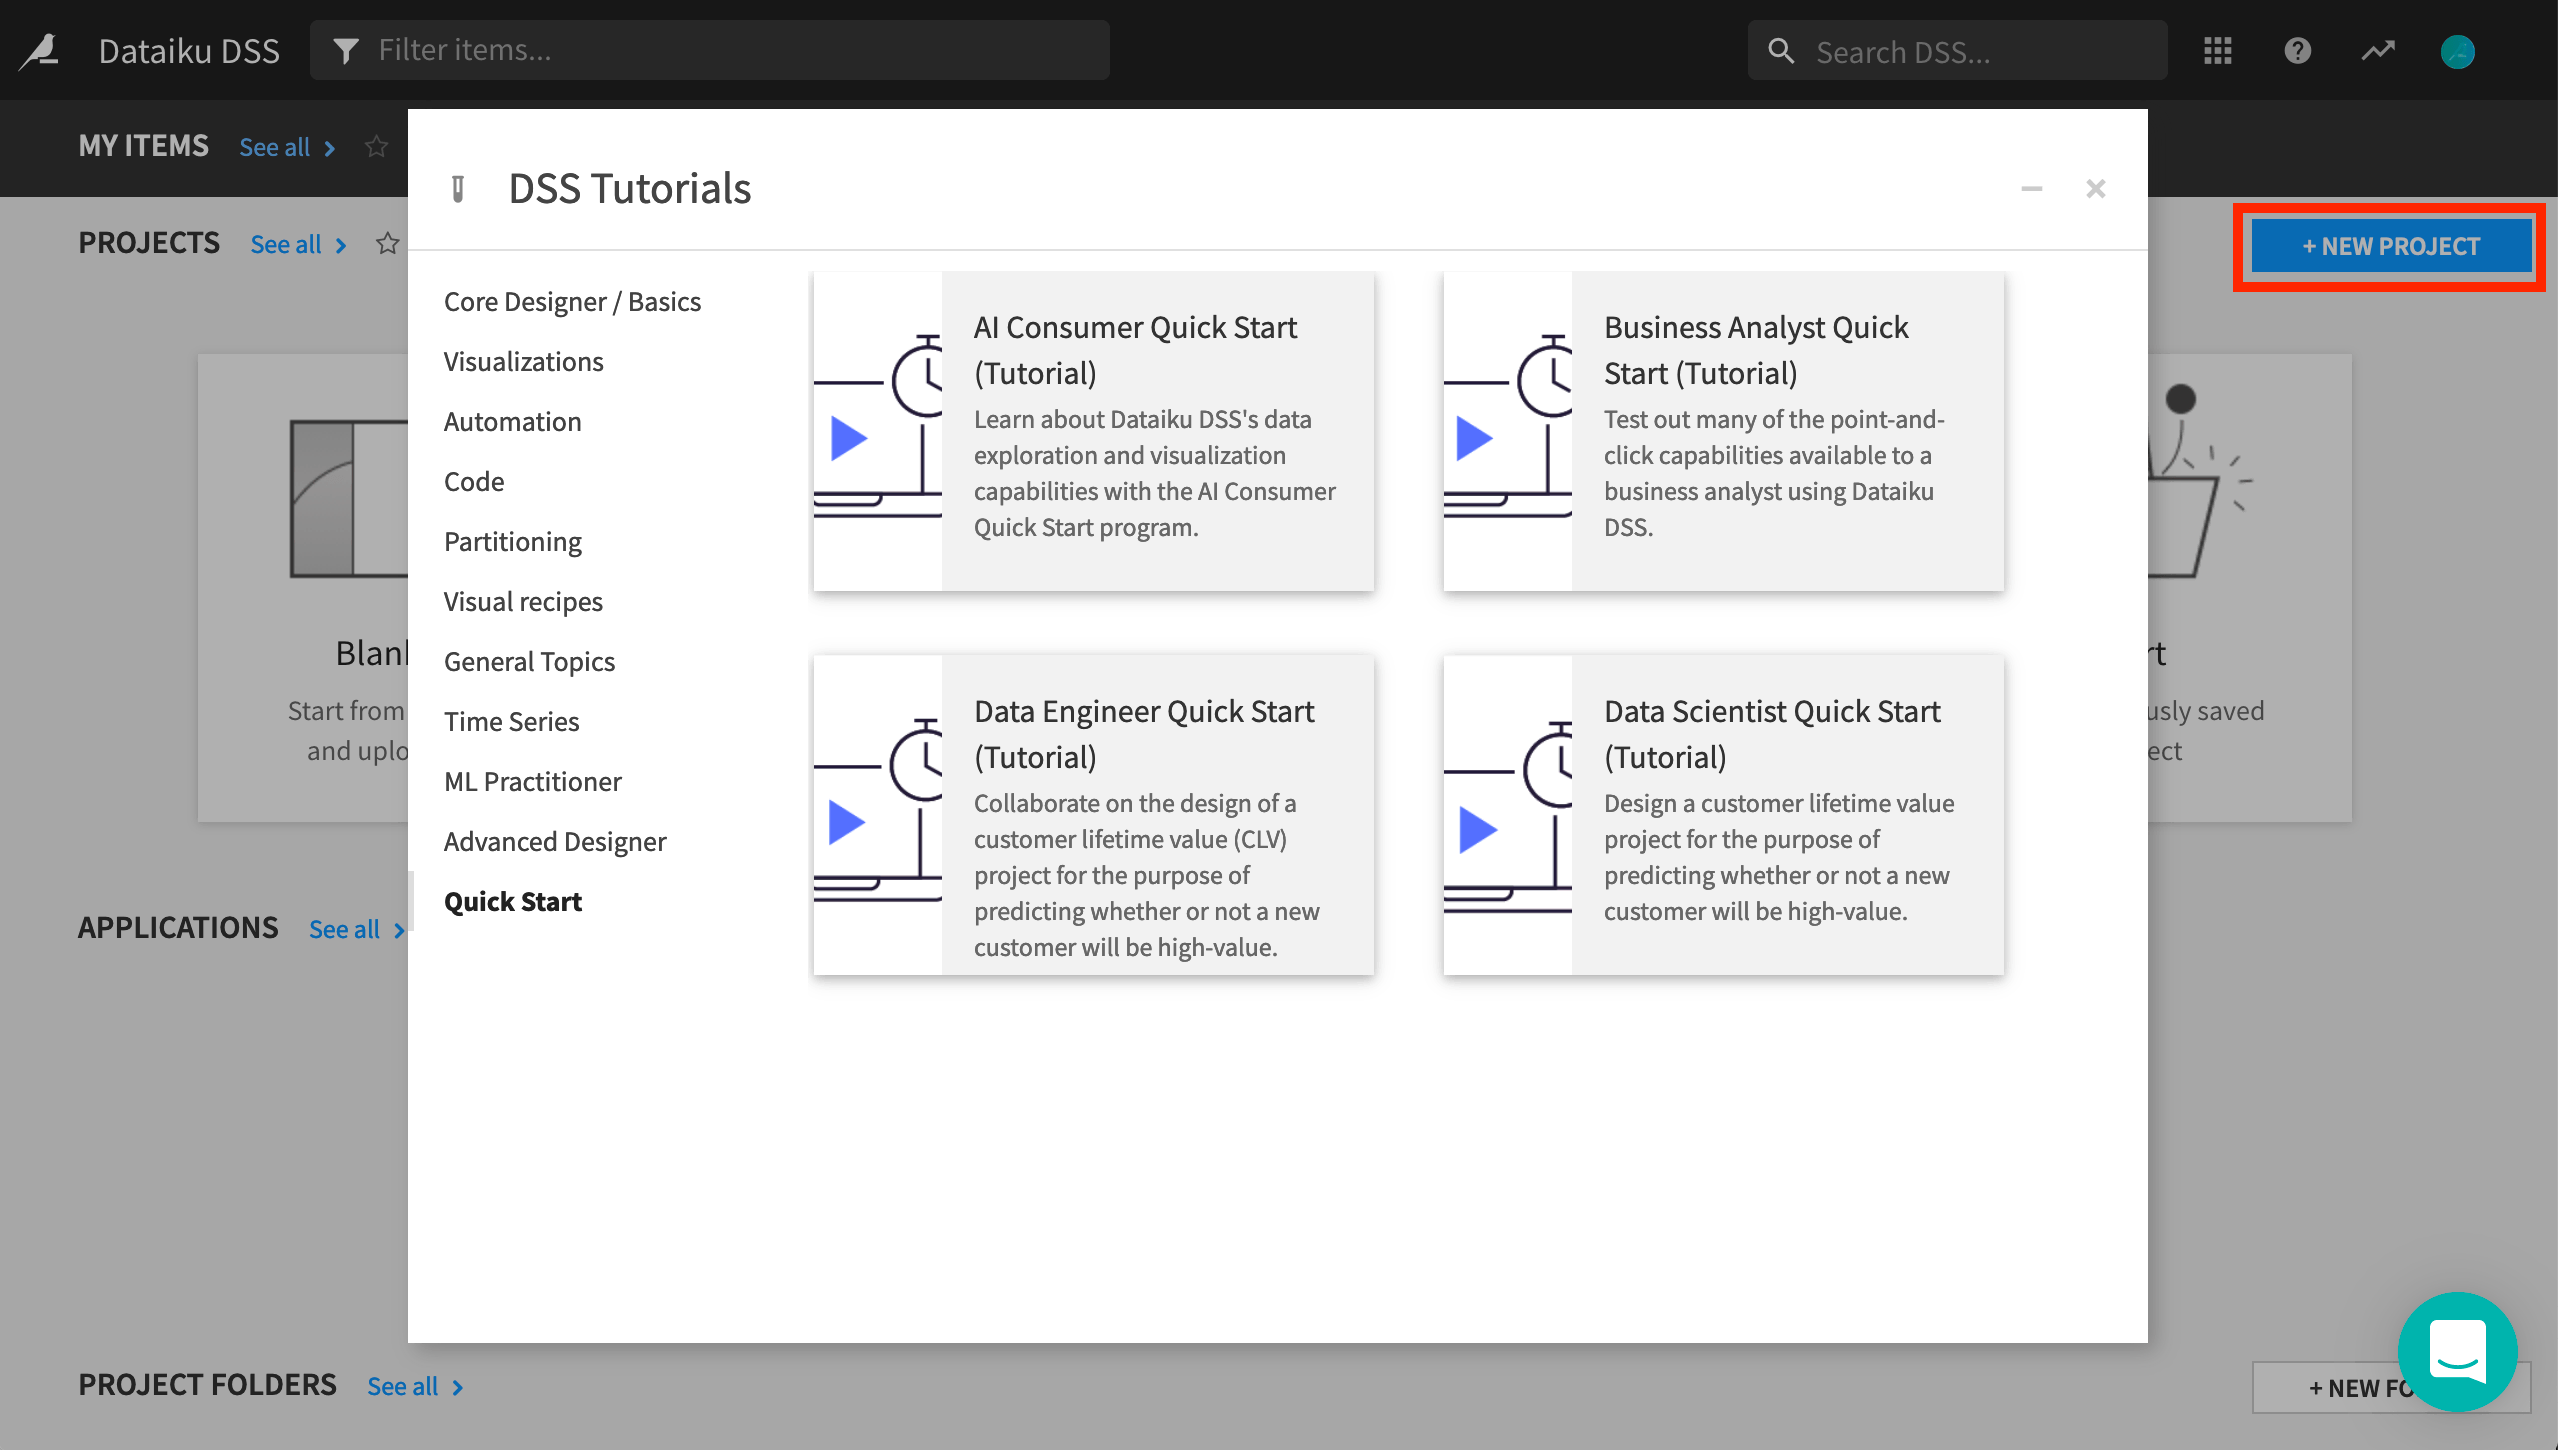
From the Dataiku DSS homepage, click on +New Project.
Choose DSS Tutorials > Quick Start > Business Analyst.
Click OK when the tutorial has been successfully created.
Connect to Data
After creating a project, you’ll find the project homepage. It is a convenient high-level overview of the project’s status and recent activity.
Let’s add a new dataset to the Flow, in addition to the existing four present in the initial starting project.
Note
The Flow is the visual representation of how data, recipes (steps for data transformation), and models work together to move data through an analytics pipeline.
A blue square in the Flow represents a dataset. The icon on the square represents the type of dataset, such as an uploaded file, or its underlying storage connection, such as a SQL database or cloud storage.
From the project homepage, click Go to Flow.
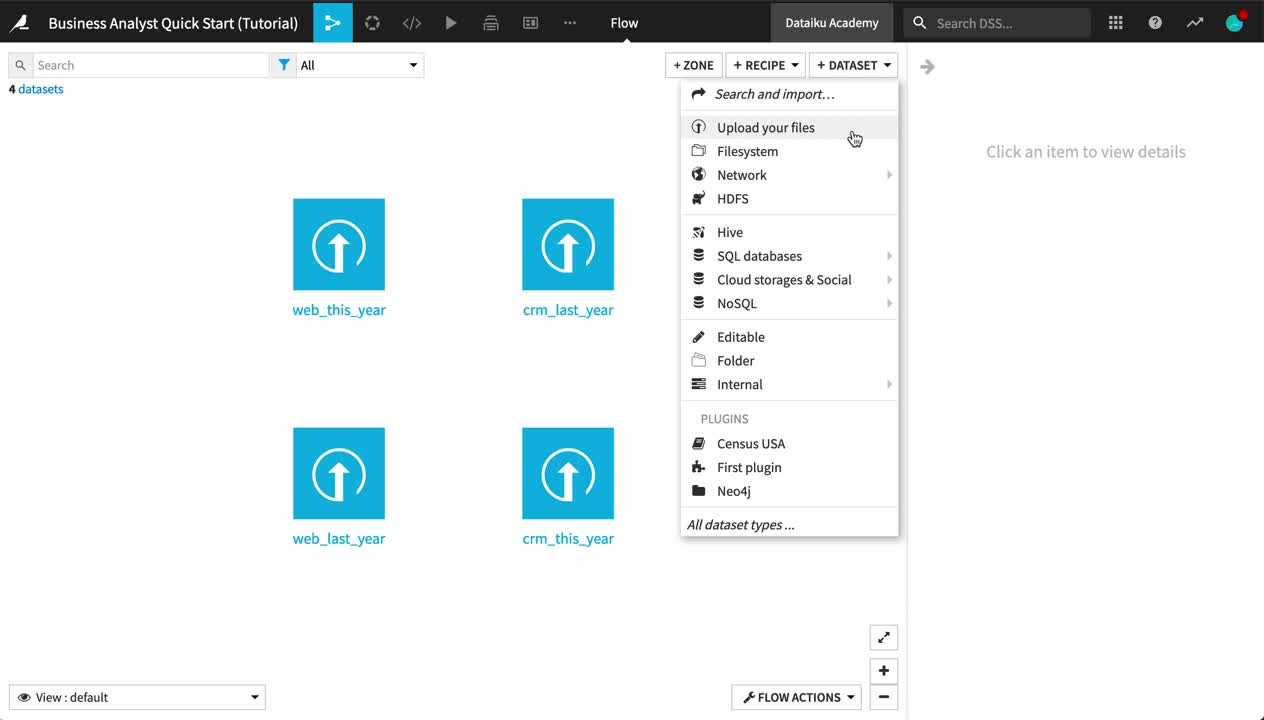
Click +Dataset in the top right corner of the Flow.
Click Upload your files.
Add the country_gdp.csv file by dragging and dropping or using the button to choose a file.
If using Dataiku Online, click Next, and observe a preview of the settings used to read the file.
If using the free edition or any other local instance, click Preview at the bottom left of the page to do the same.
Click the green Create button to create the dataset within Dataiku.
Navigate back to the Flow from the left-most menu in the top navigation bar (or use the keyboard shortcut
G+F).
Tip
No matter what kind of dataset the blue square represents, the methods and interface in Dataiku DSS for exploring, visualizing, and analyzing it are the same.