Clean the Data
Data cleansing is a crucial step in the data preparation process. Dataiku DSS enables the data engineer to take control of the data quality discovery and resolution process by providing tools for cleaning datasets and engineering new features.
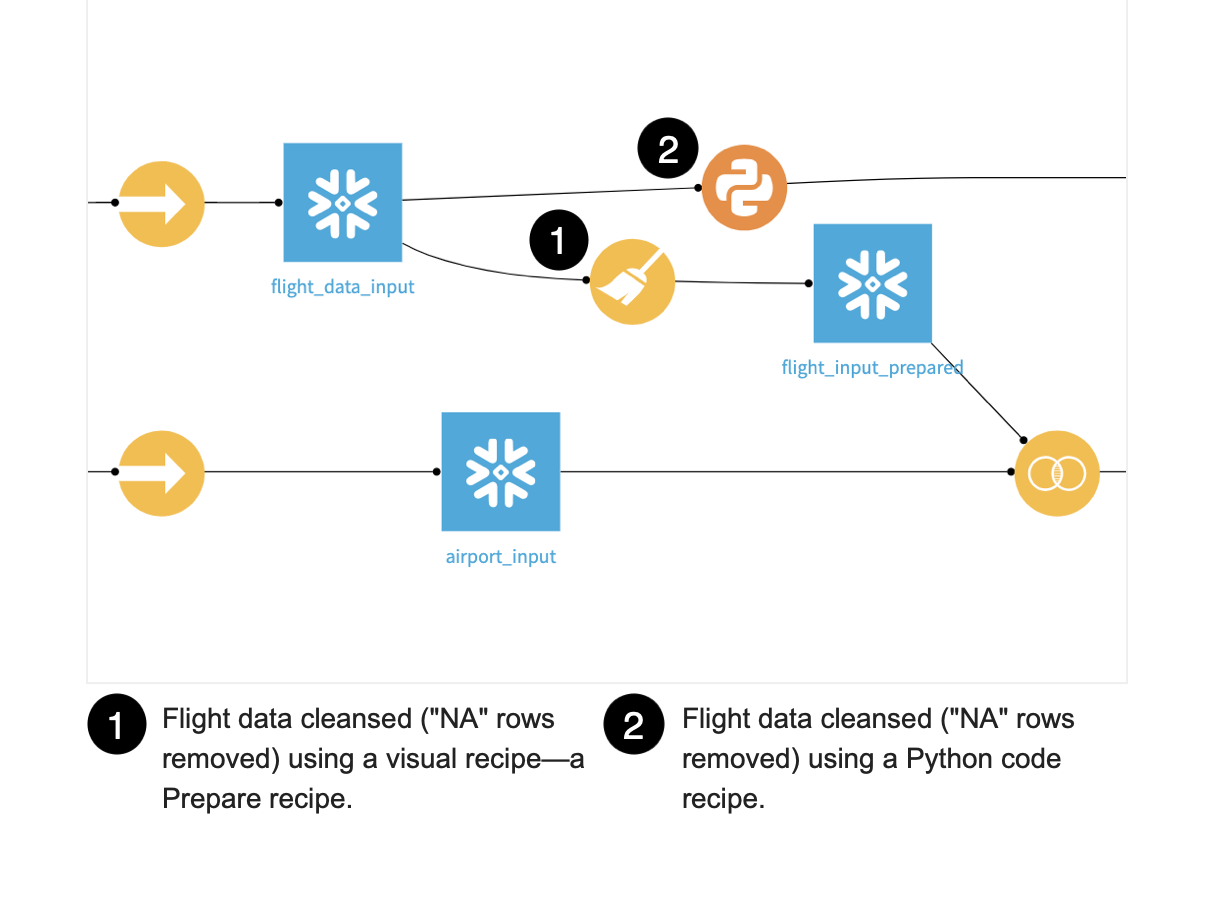
To demonstrate how this works, we’ll look for data quality issues with our flight data. For a comparison, we’ll discover how we can cleanse the data using two methods–a visual recipe and a code recipe.
Check for Data Quality Issues in the Flight Data
Sometimes you just want a quick way to analyze data quality and get instant statistics. The data quality bar lets you do this. To visually explore the quality of the data:
Open the flight_data_input dataset.
Visually analyze the column ArrDelay:
Locate the column, ArrDelay.
Press “c” on your keyboard to bring up the column search.
Type
ArrDelay.
Hover over the data quality bar under the column.
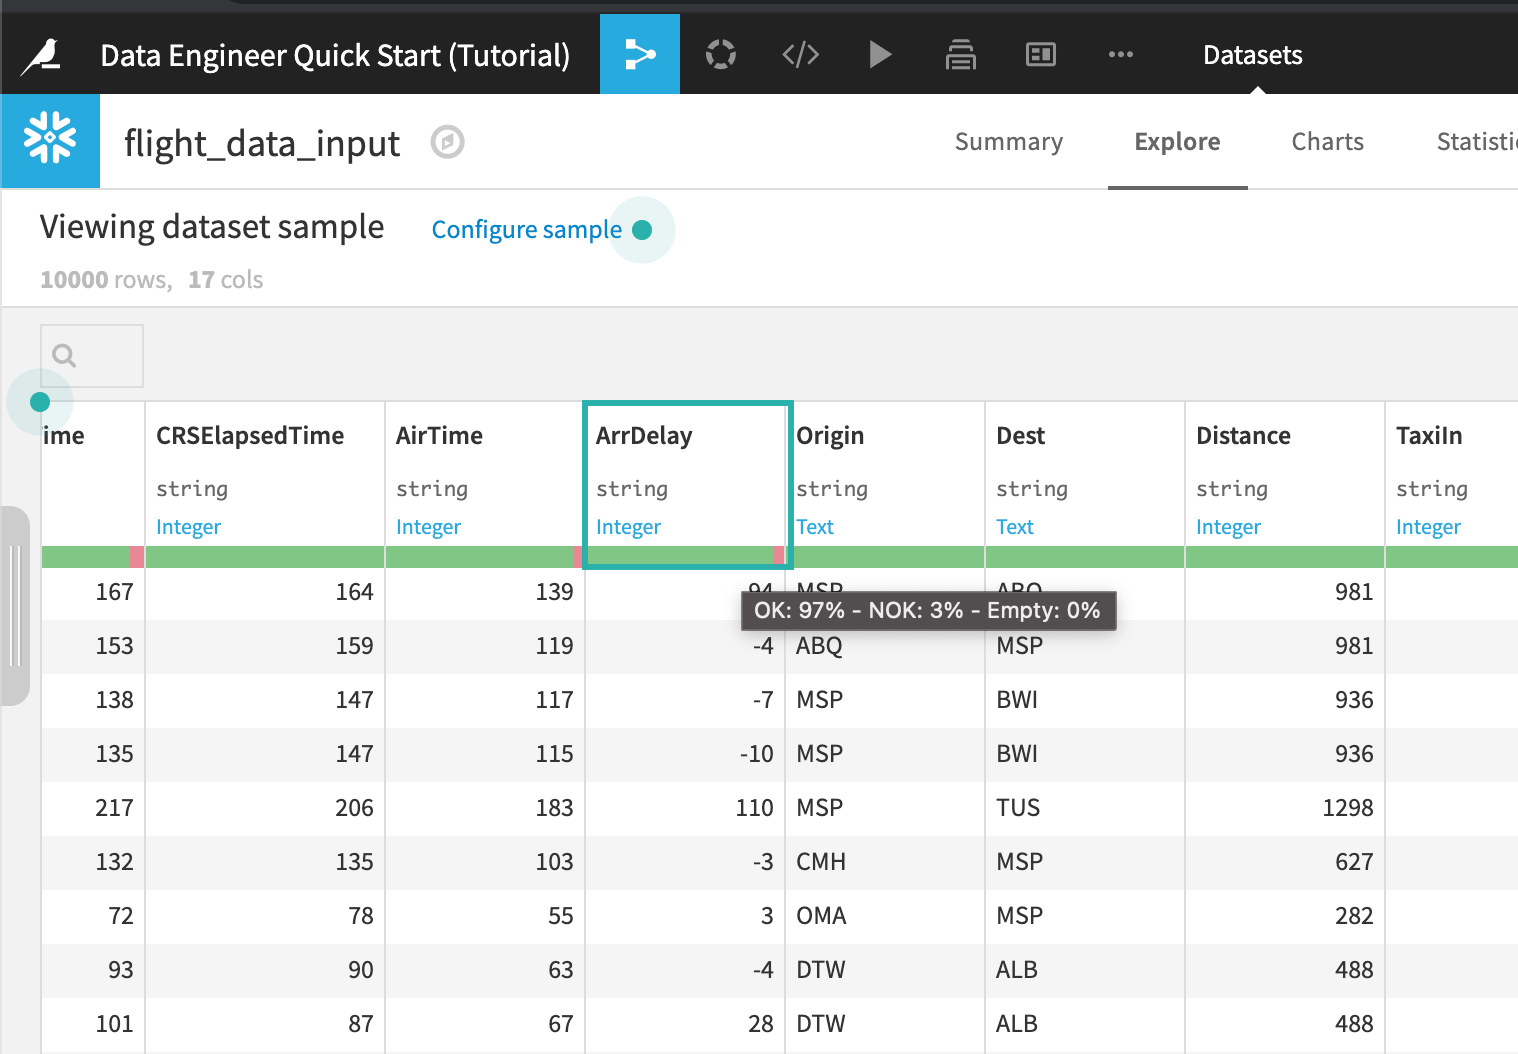
By default, the Explore views shows a data quality bar, which shows which rows are valid for their meaning.
Note
When exploring and preparing data in DSS, you always get immediate visual feedback, no matter how big the dataset that you are manipulating. To achieve this, DSS works on a sample of your dataset.
View the percentage of invalid rows:
Click the column header of the column ArrDelay.
Choose the Filter.
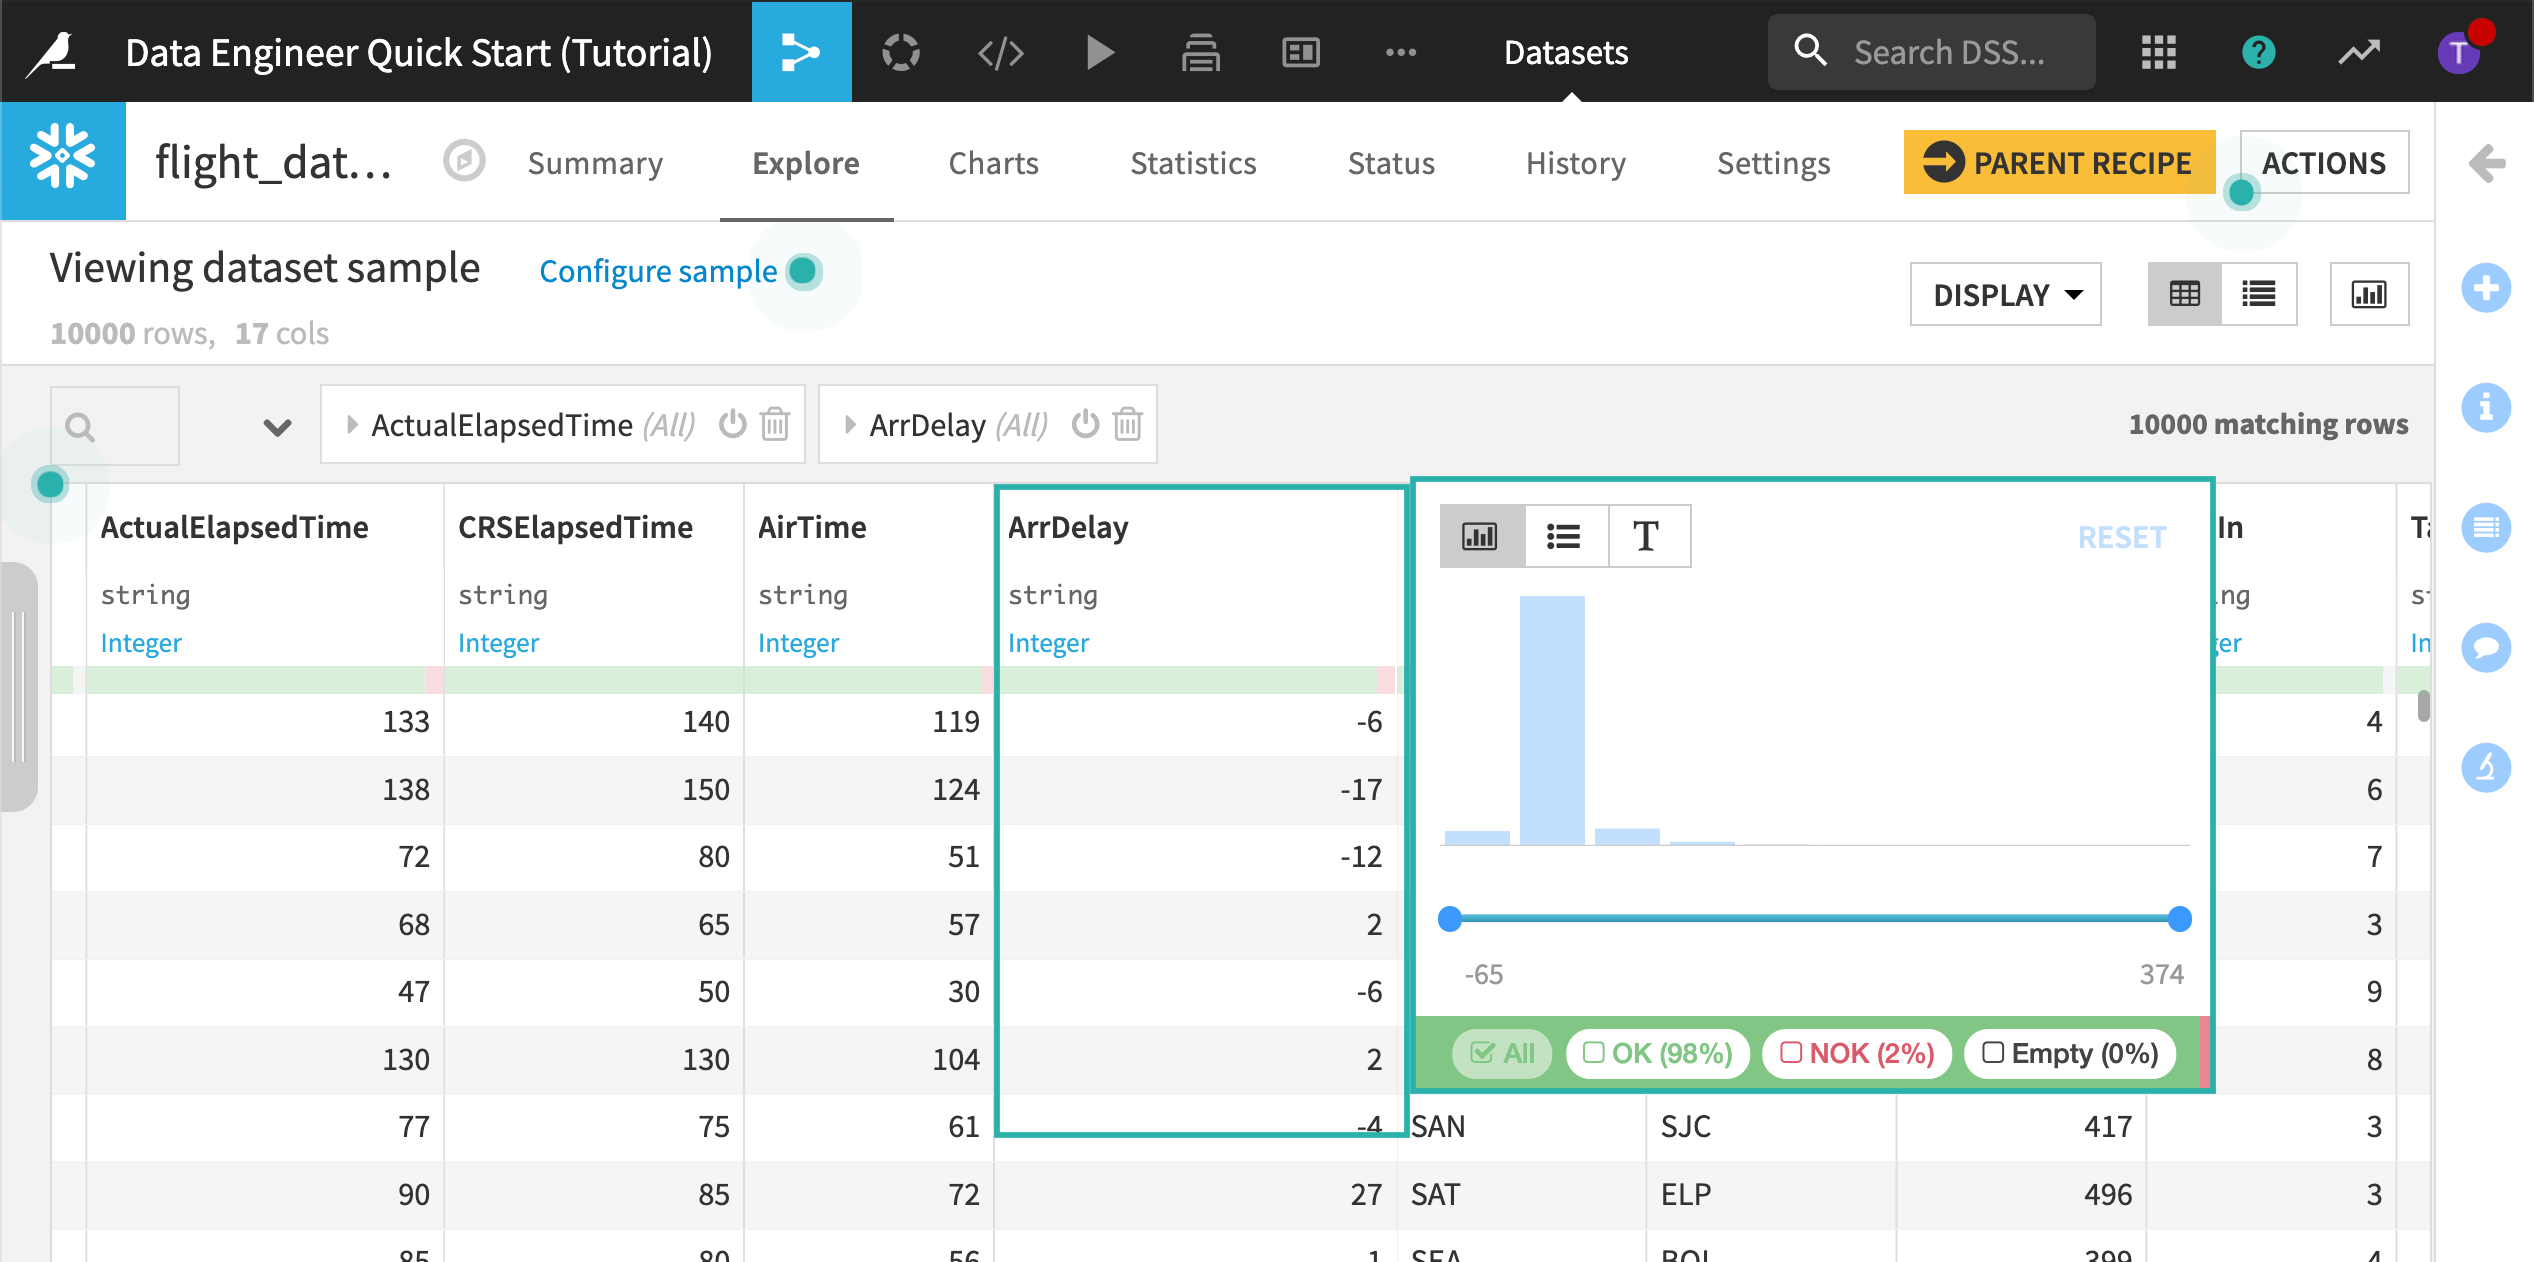
The filter view lets us know that approximately 3% of the rows in the current sample do not match the inferred meaning. Each invalid row has a value that is equal to “NA” and cannot be used to train the model. For the purposes of this tutorial, we’ll remove the “NA” records.
Close the filter view without making any changes.
Note
There are more than 90 visual recipes where you can prepare, explore, enrich, and analyze your data visually.
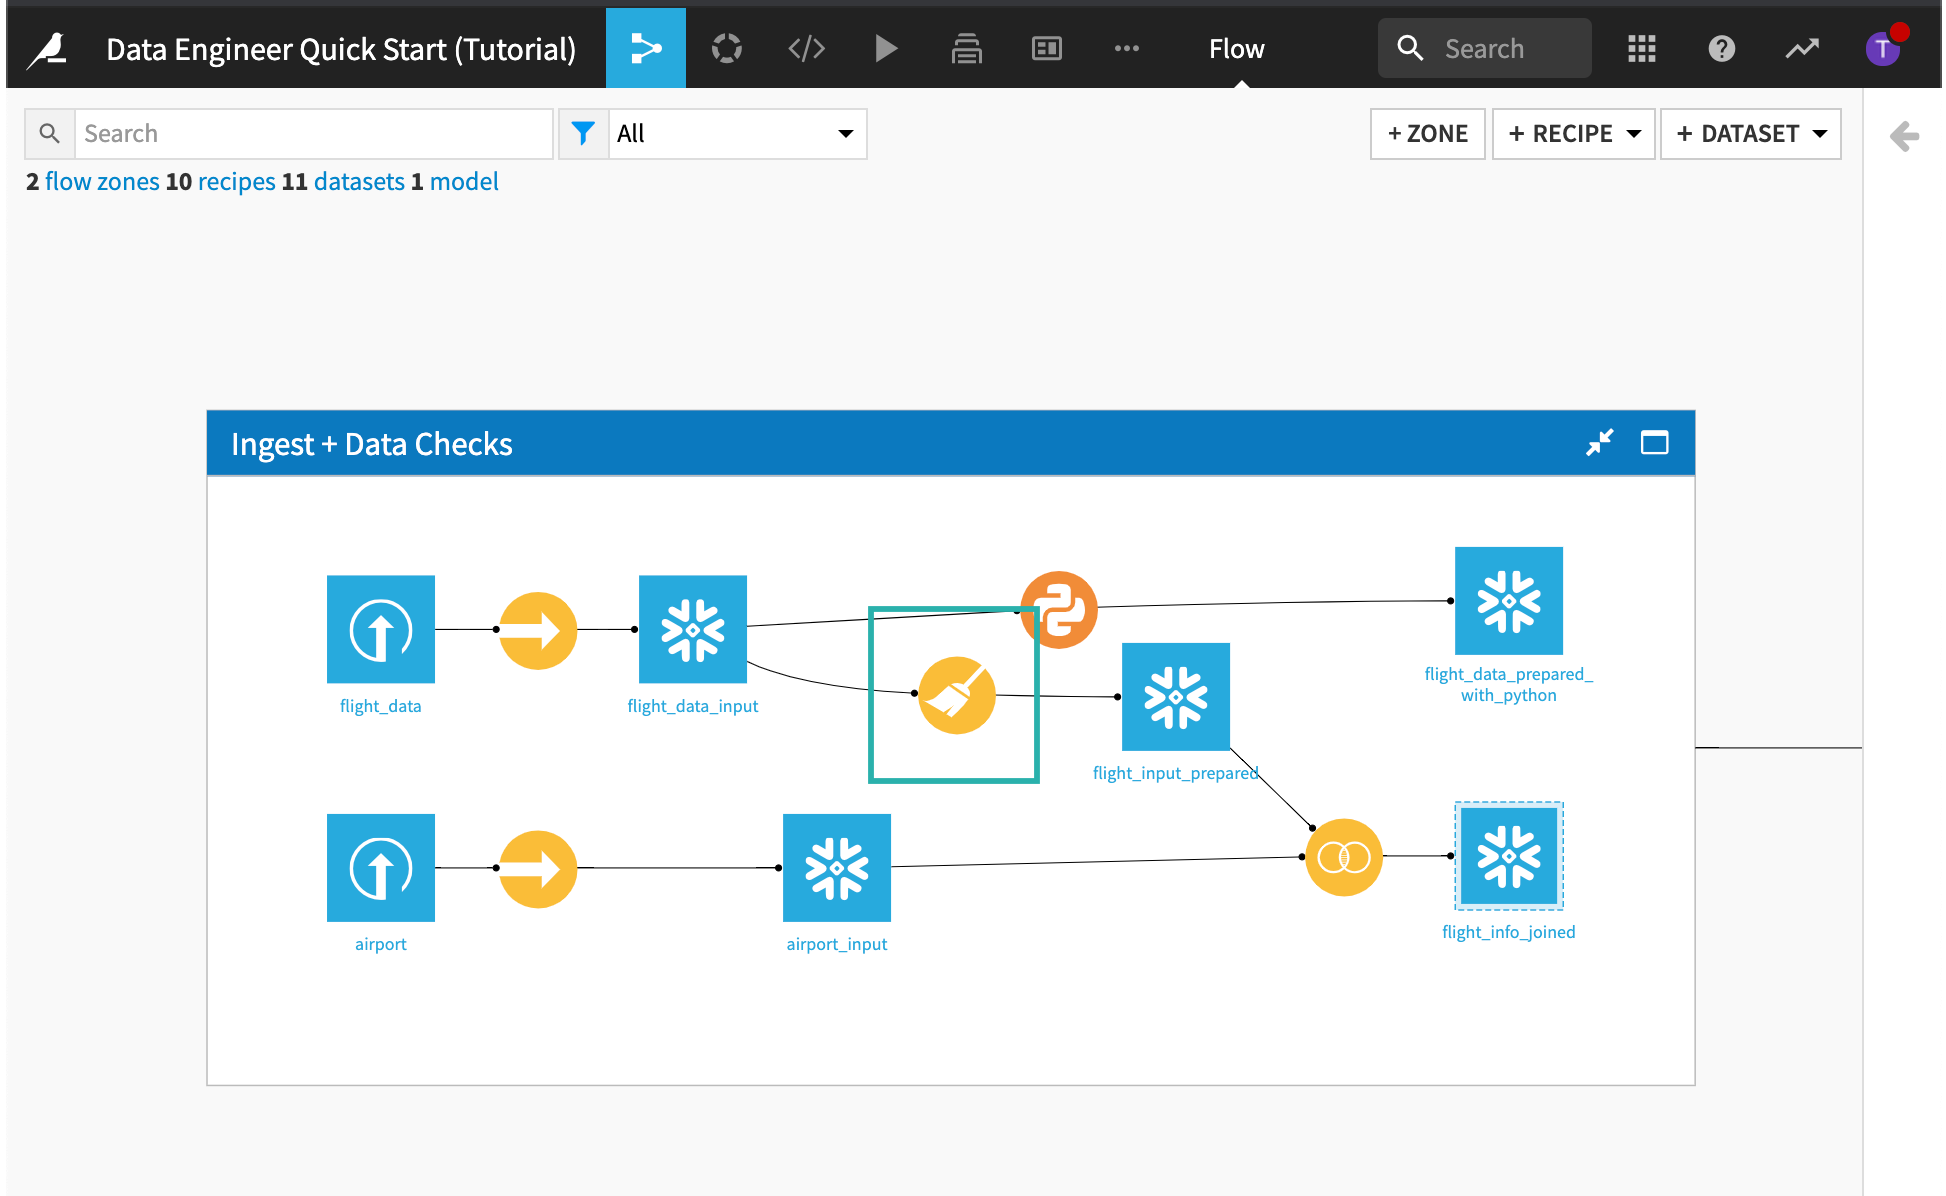
Cleanse the Flight Data Using a Visual Recipe
We can visually remove the invalid records using a visual recipe, called a Prepare recipe. The Prepare recipe’s processors library lets us visually perform our data cleansing and transformation steps.
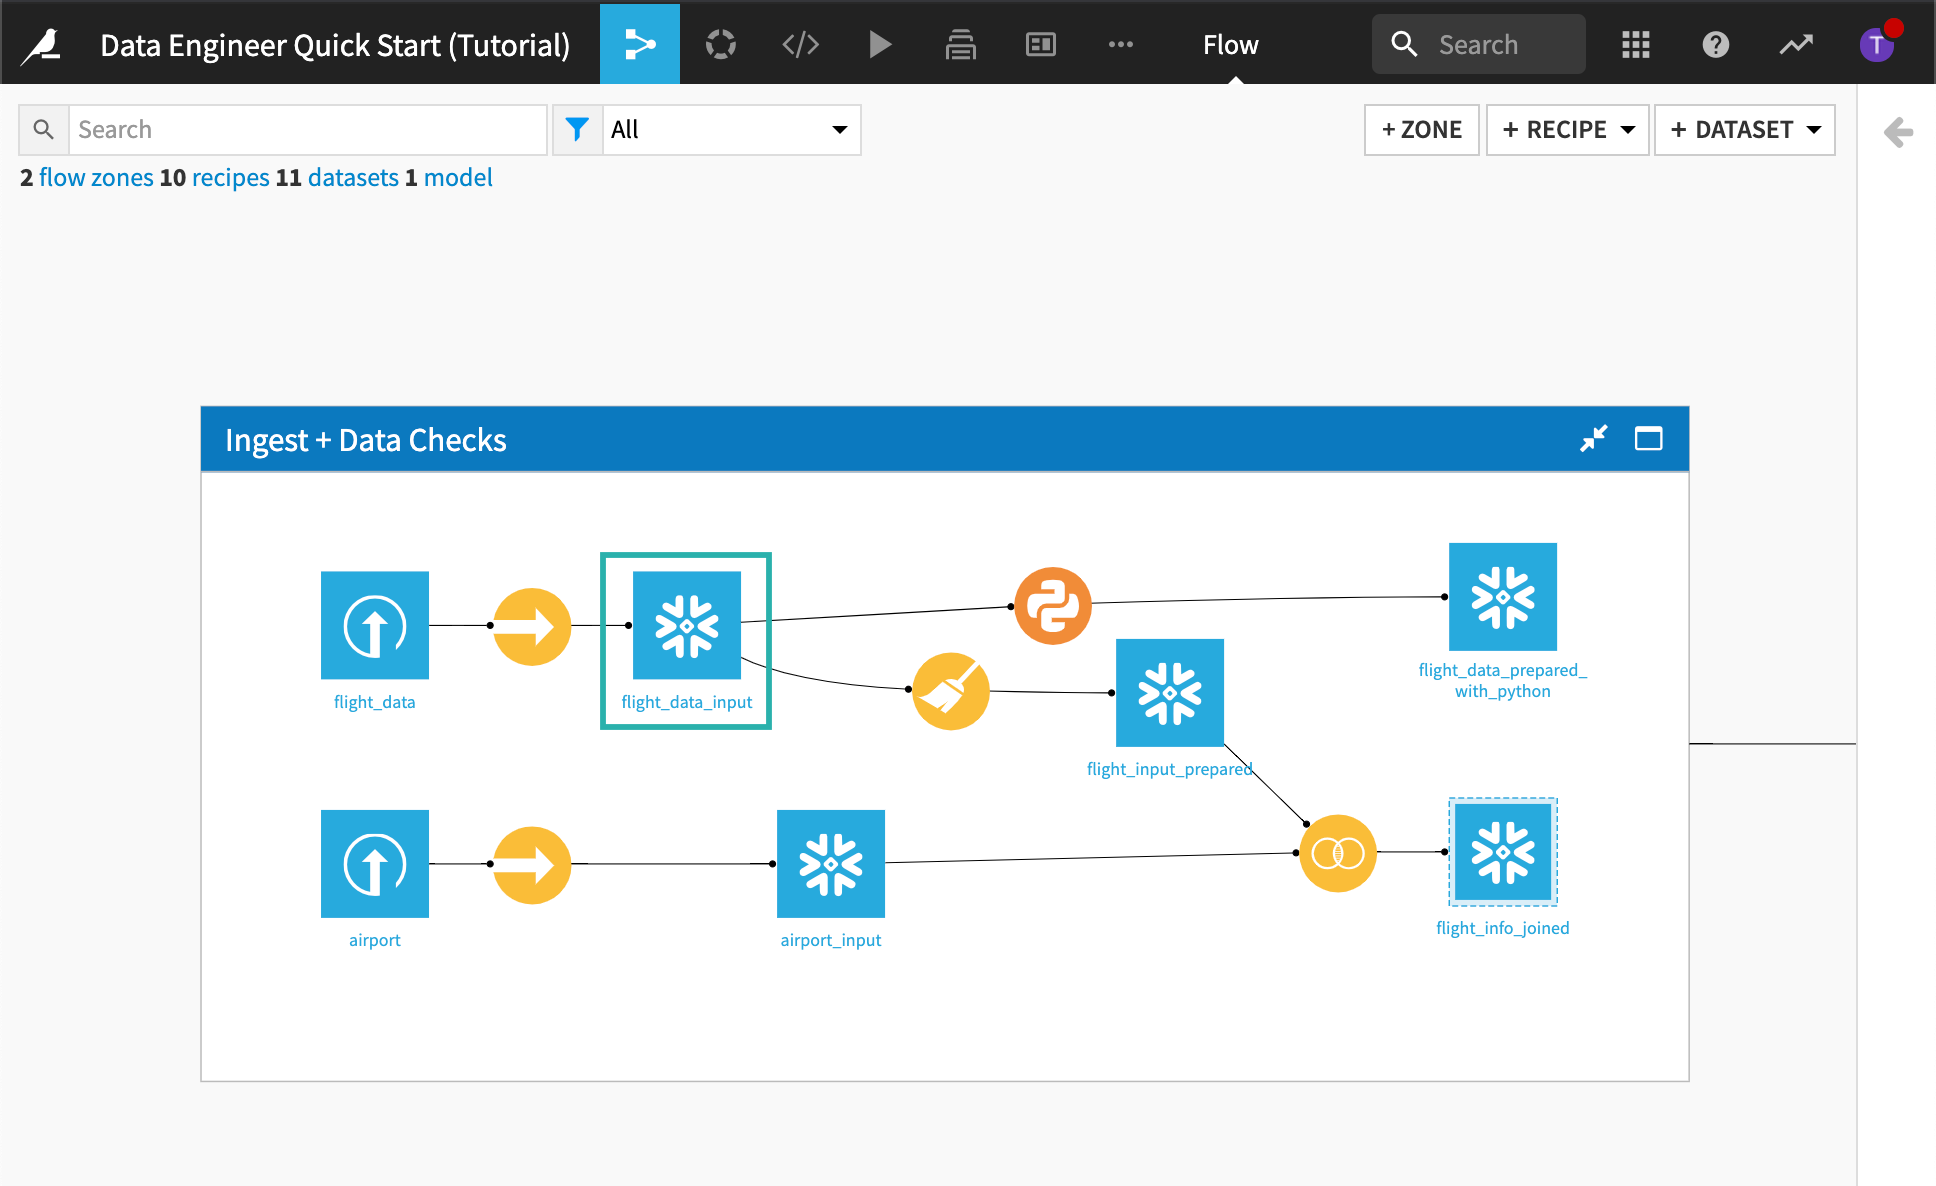
Return to the Flow.
Open the Prepare recipe that was used to create flight_input_prepared.
Remove “NA” Rows
The first step removes all rows where ArrDelay is equal to “NA”.
Click the first step in the script to expand it.
This step was created by clicking the column’s header, selecting the Analyze function, and then applying the Remove rows action from the Mass Actions menu.
Replace Values in a Column
Click the second step in the script to expand it.
This step replaces the value “24:0” with “00:00” in the departure date and arrival date columns.
Process Dates
Click the “Date Processing” group in the script to expand it and view its steps.
This group of steps parses the departure date, extracts date components from the newly parsed departure date, and finally, removes the unneeded columns.
Return to the Flow without saving any changes you might have made to the visual recipe.
Cleanse the Flight Data Using a Code Recipe
Anything you do visually in Dataiku DSS can also be done in coding languages including R, Python, and SQL. Using a code recipe, we can perform the same data cleansing step as in the visual recipe. To do this we will use Python, but we could use any of the code recipes in DSS.
From the Flow, open the Python recipe that was used to create flight_data_prepared_with_python.
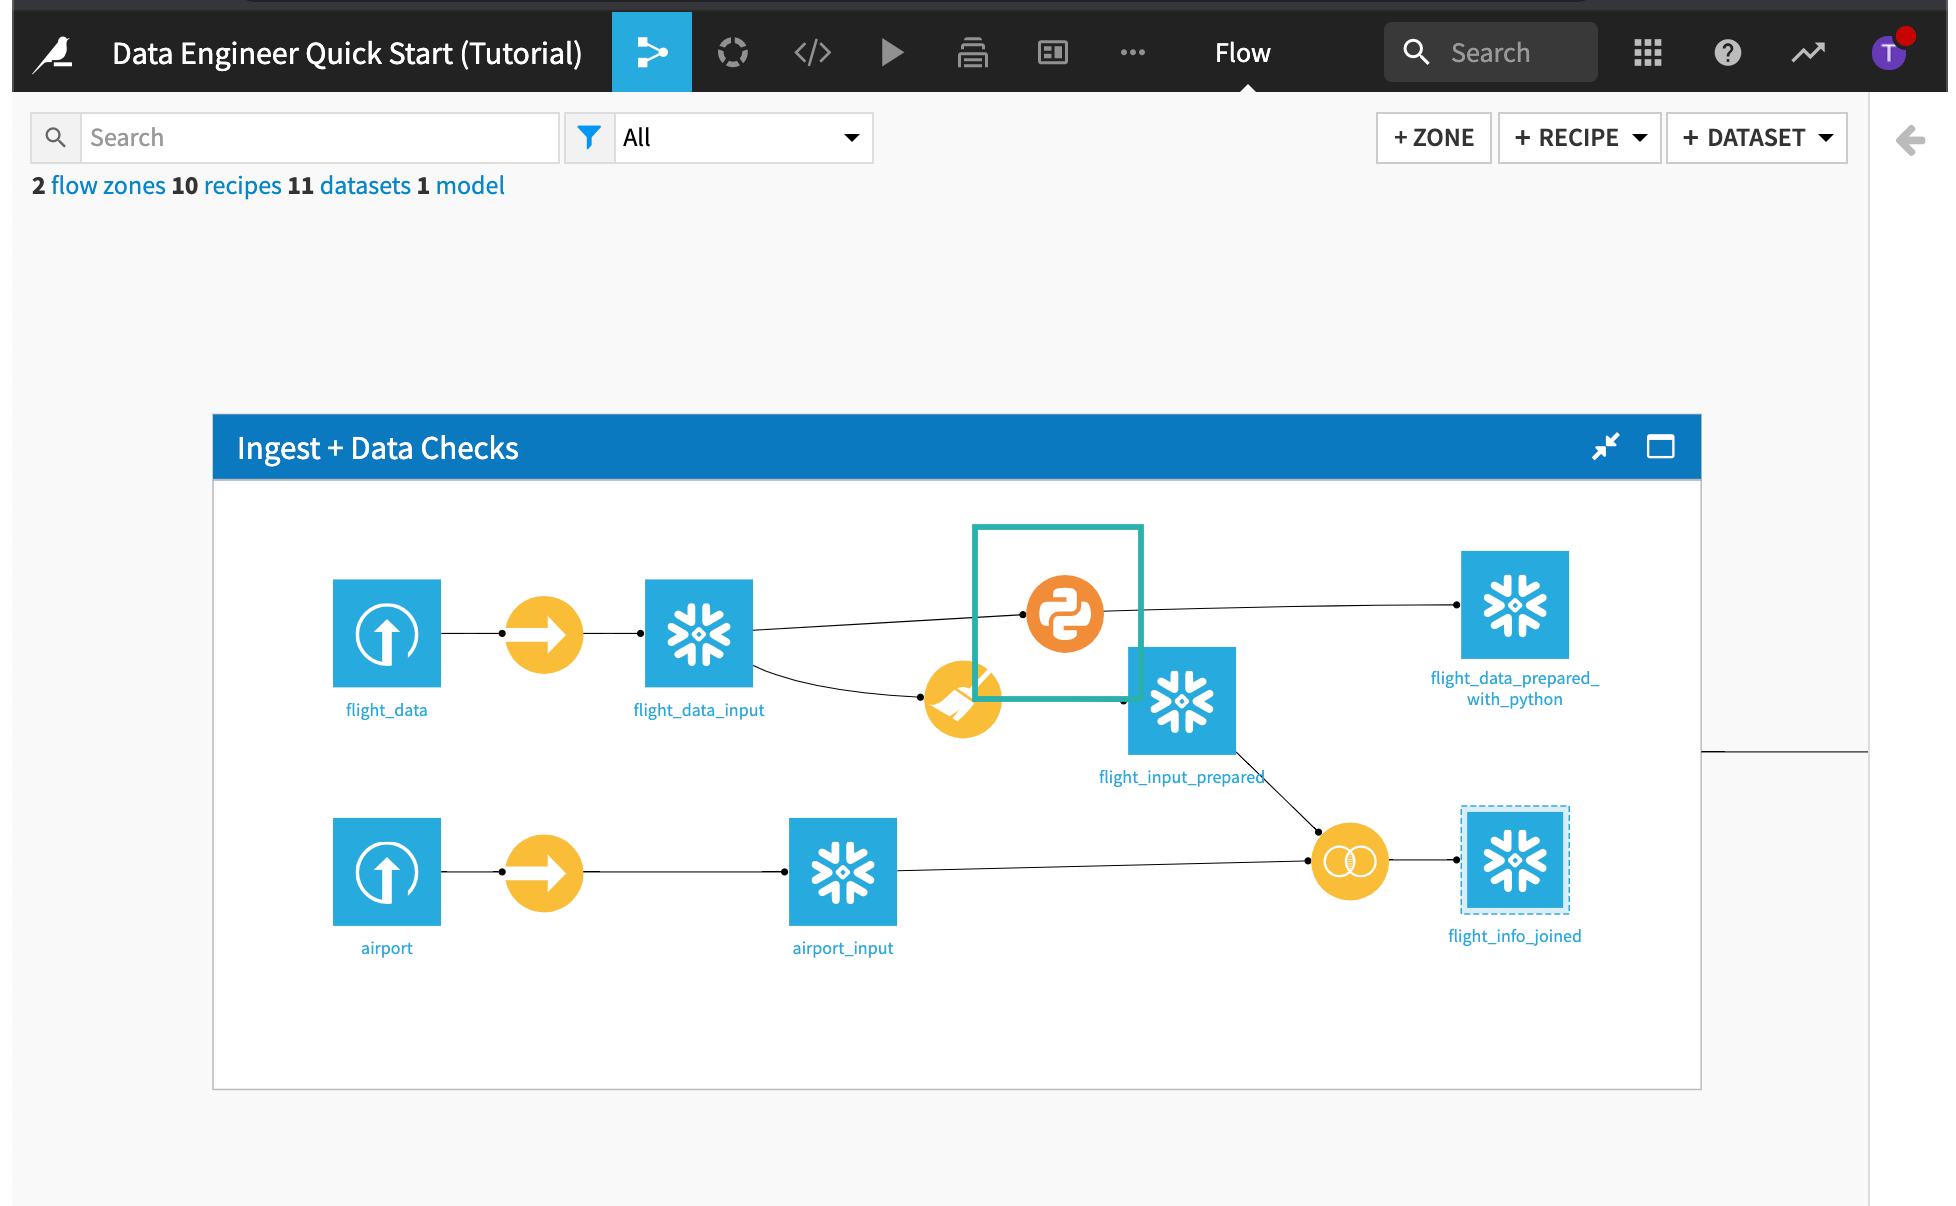
This code recipe performs the same steps as the visual recipe.
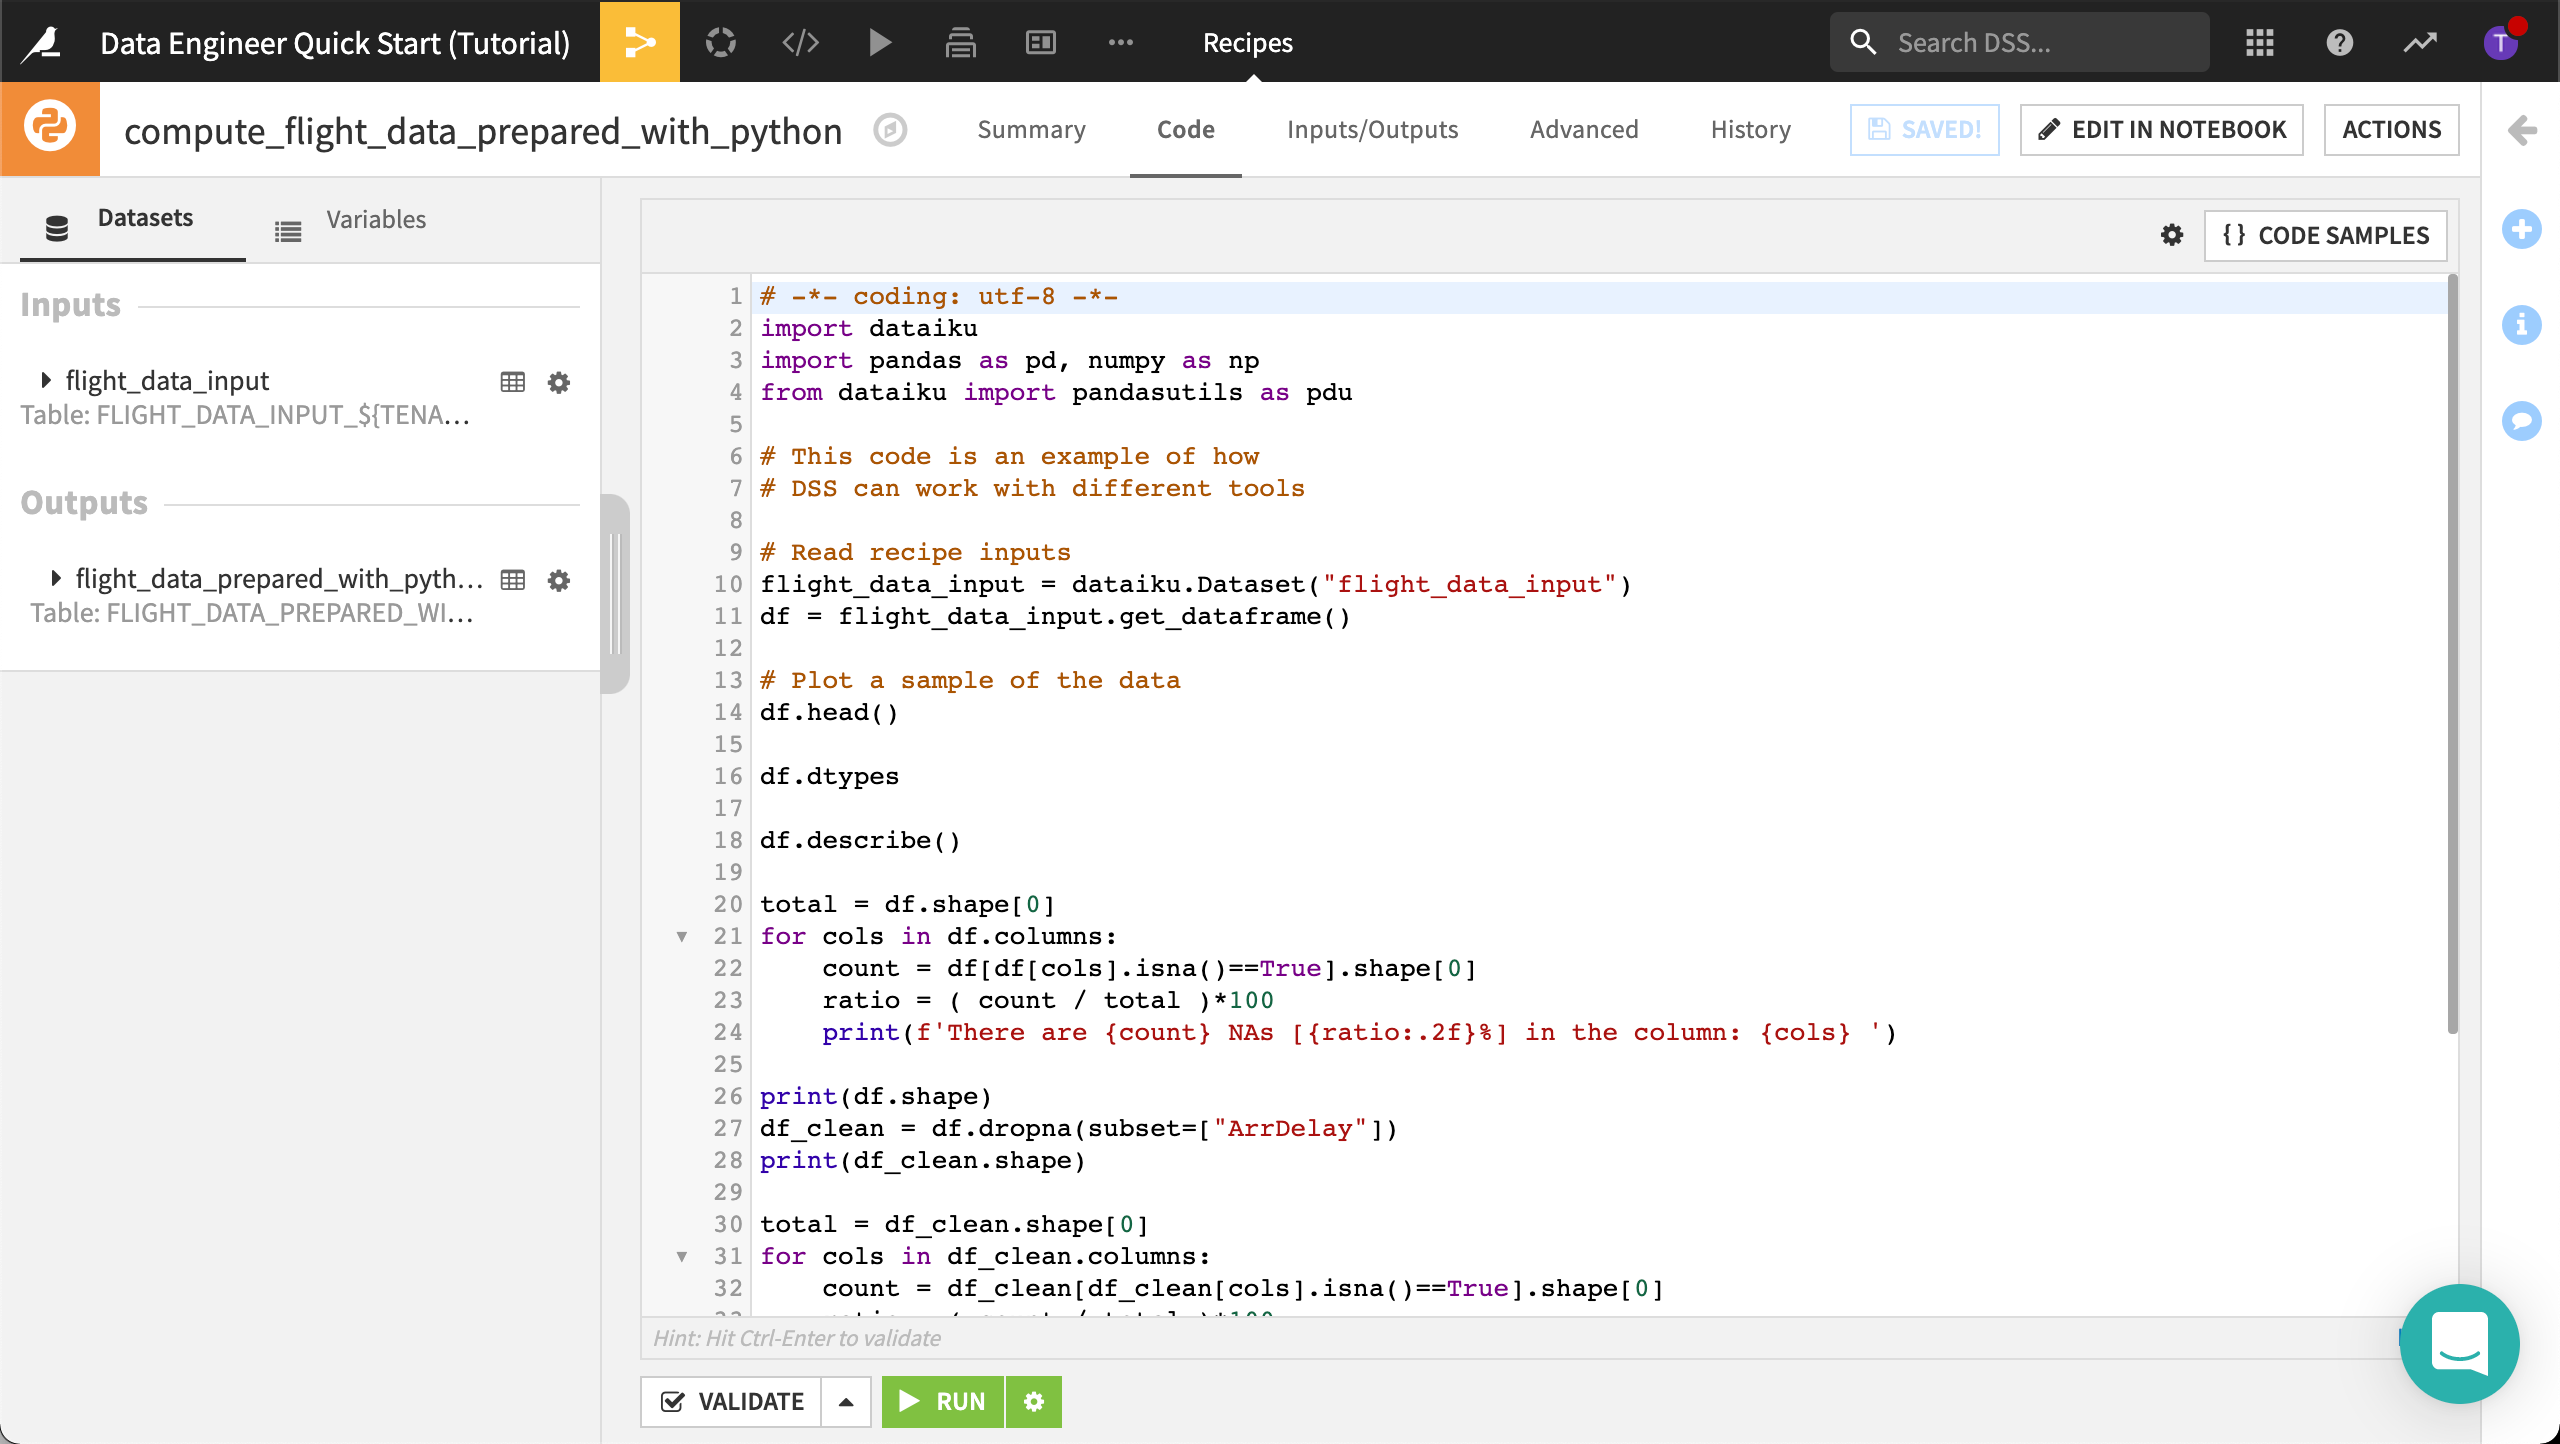
You could edit this code in a notebook and continue interactively analyzing the dataset. To find out more, visit Using Jupyter Notebooks in DSS.