Configure Dataset Consistency Checks
Having to constantly compare dataset metric values with expected values can quickly become a tedious task. You can use Dataiku DSS to speed up tasks like scenario-based programmable triggers, data consistency checks, and recursive dataset building.
By setting up dataset metrics and checks, we can ask Dataiku DSS to automatically assess the datasets in the Flow–giving us the ability to compare metric values with expected values or ranges. This helps ensure that the automated Flow runs with expected results. We can also check that the Flow runs within expected timeframes.
When data pipeline items, such as datasets, fail checks, Dataiku DSS returns an error, prompting investigation, which promotes quick resolution.
In this section, we’ll establish metrics and checks on datasets both visually and with code (for comparison purposes).
Note
Key concept: Metrics and Checks
The metrics system provides a way to compute various measurements on objects in the Flow, such as the number of records in a dataset or the time to train a model.
The checks system allows you to set up conditions for monitoring metrics. For example, you can define a check that verifies that the number of records in a dataset never falls to zero. If the check condition is not valid anymore, the check will fail, and the scenario will fail too, triggering alerts.
You can also define advanced checks like “verify that the average basket size does not deviate by more than 10% compared to last week” By combining scenarios, metrics, and checks, you can automate the updating, monitoring and quality control of your Flow.
Our upstream datasets, flight_data_input and flight_input_prepared will change whenever we have fresh data. Because of this, we’ll want Dataiku DSS to check for dataset consistency. We can then use the conditions to tell Dataiku DSS what to do when a condition is met. Later, we’ll discover how to automate the checks.
Let’s take a look at the types of metrics that we’ll be checking for.
Go to the Flow.
Open the dataset, flight_data_input.
Navigate to the Status tab.
Click Compute.
These metrics count the number of columns and records.
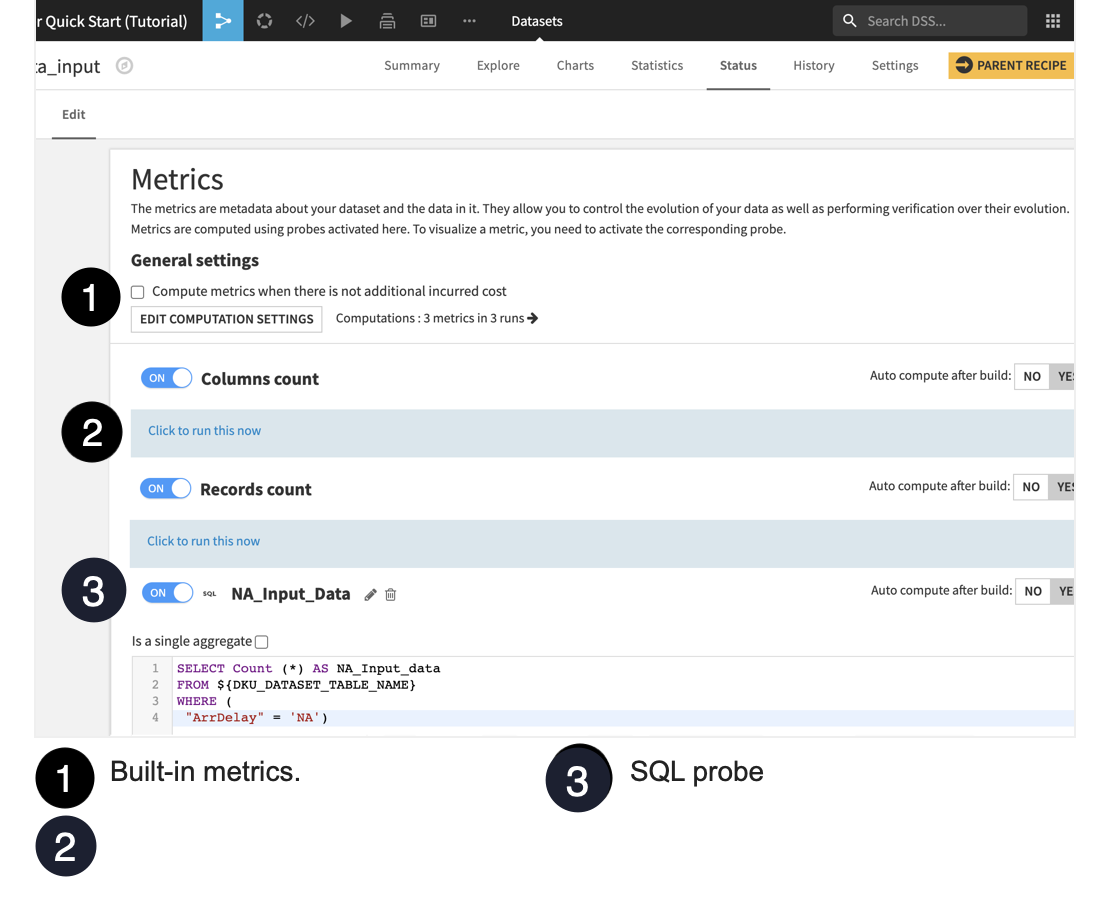
Click the Edit subtab to display the Metrics panel.
Two built-in metrics have been turned on: Columns count and Records count. They are set to auto compute after the dataset is built.
Let’s create a third metric:
Scroll to the bottom of the metrics page and click New SQL Query Probe.
Name it
NA_Input_Data.Turn the SQL query probe “on”.
Click Yes to turn on the toggle to auto compute this metric after the dataset is built.
Type the following query to select the count of records where ArrDelay is “NA”.
SELECT         Count (*) AS NA_Input_data
FROM           ${DKU_DATASET_TABLE_NAME}
WHERE  (
                       "ArrDelay" = 'NA')
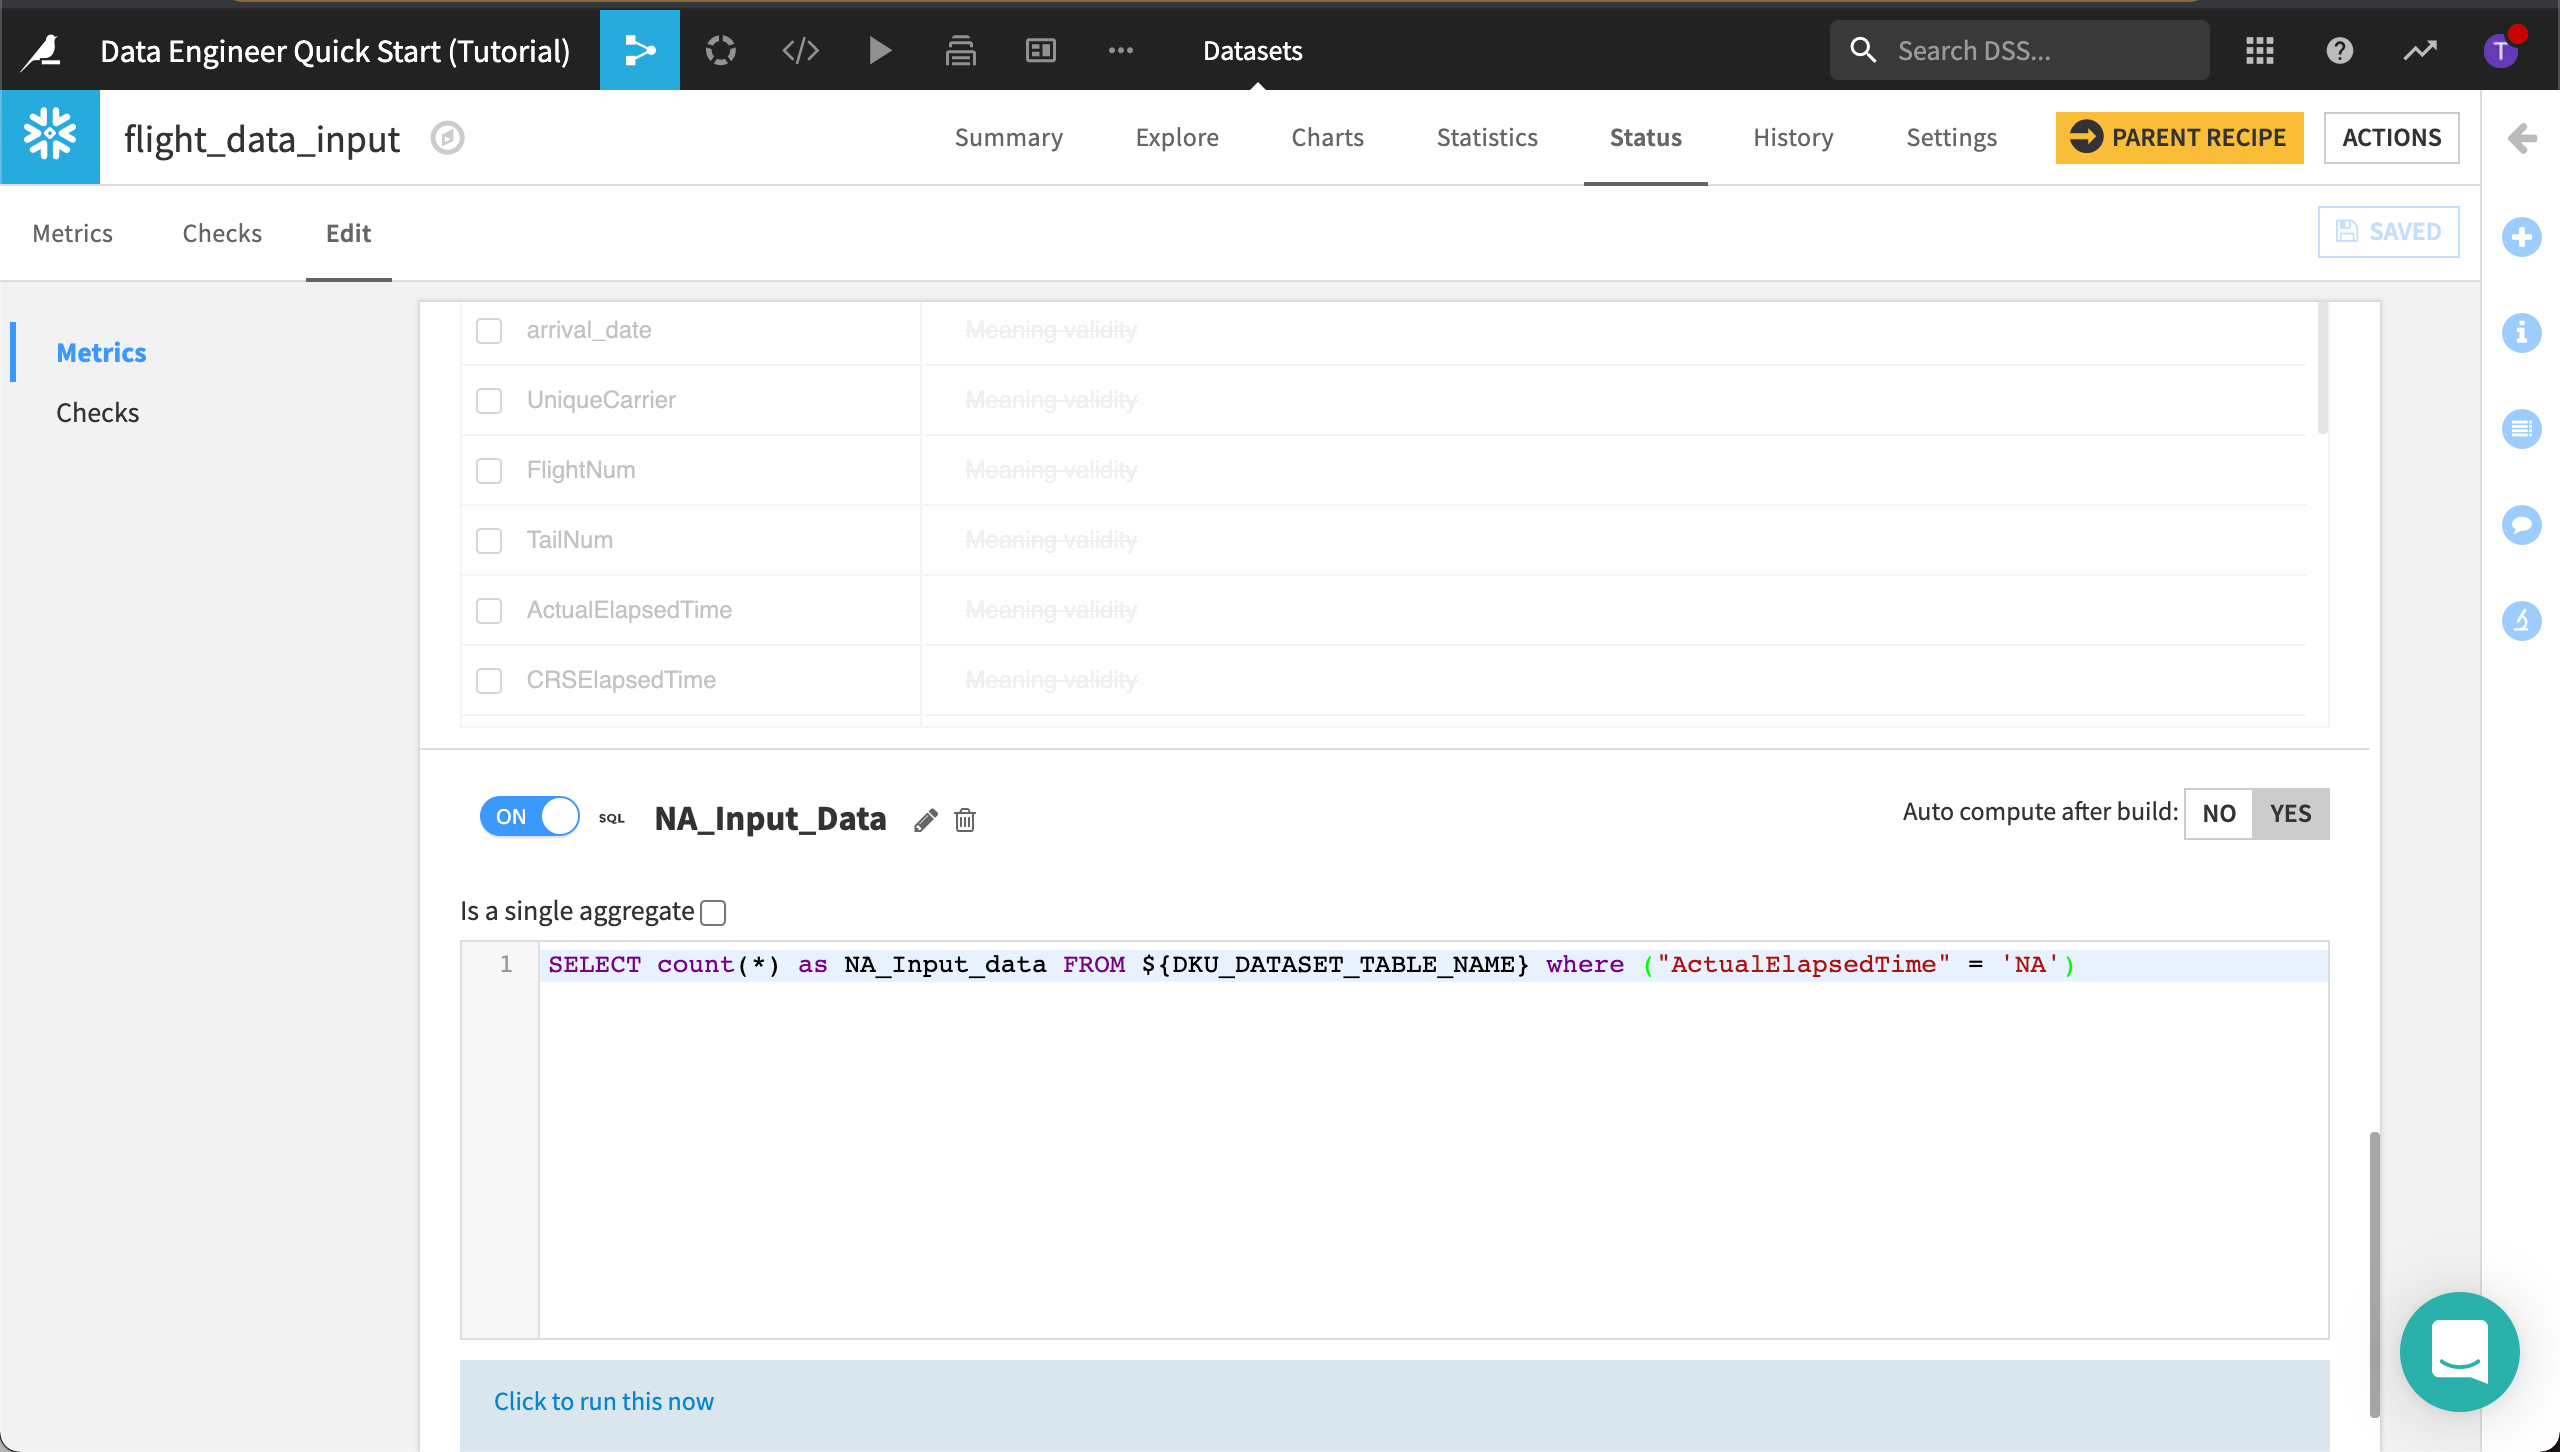
Click Save.
Run the query by clicking Click to run this now > Run.
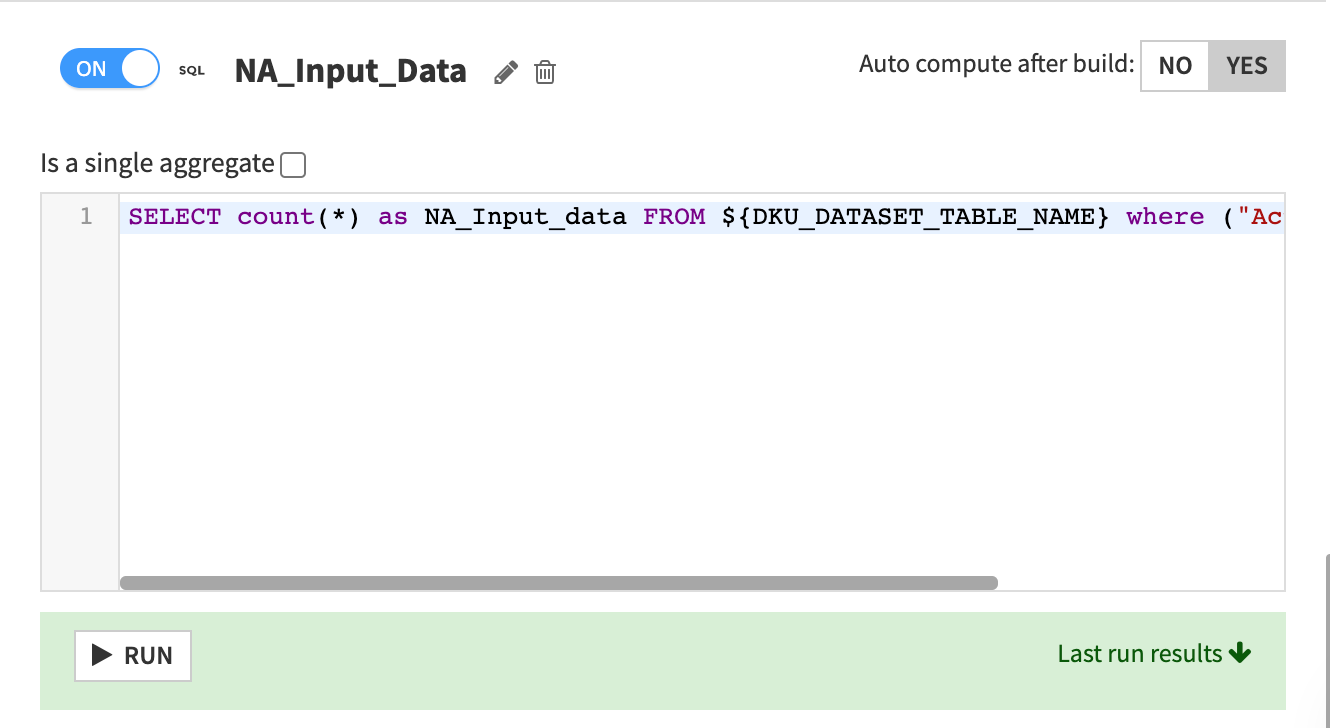
Dataiku DSS displays the Last run results which includes the count of “NA”.
Now we’ll add this new metric to Metrics to display and recompute the metrics.
Navigate to the Metrics subtab again.
Click the Metrics selection to view Metrics display settings.
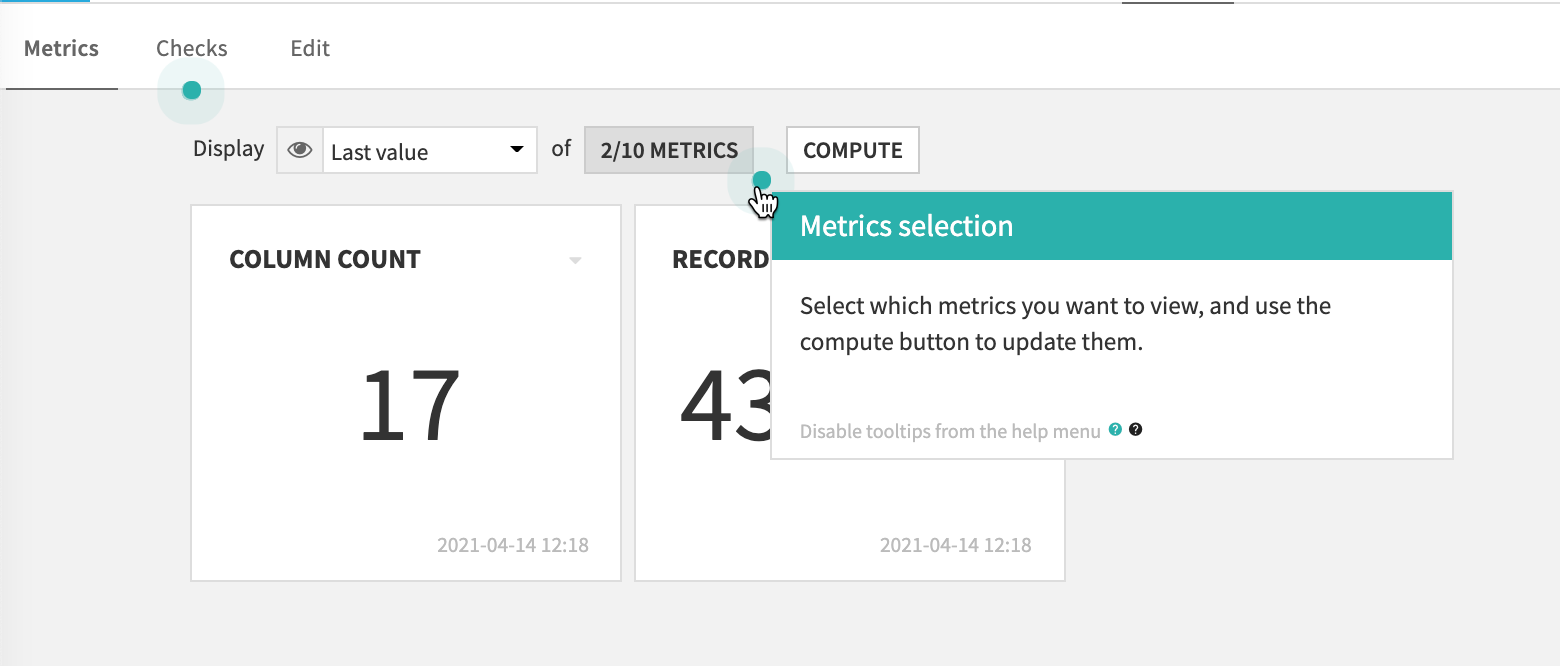
Add NA_INPUT_DATA to Metrics to display.
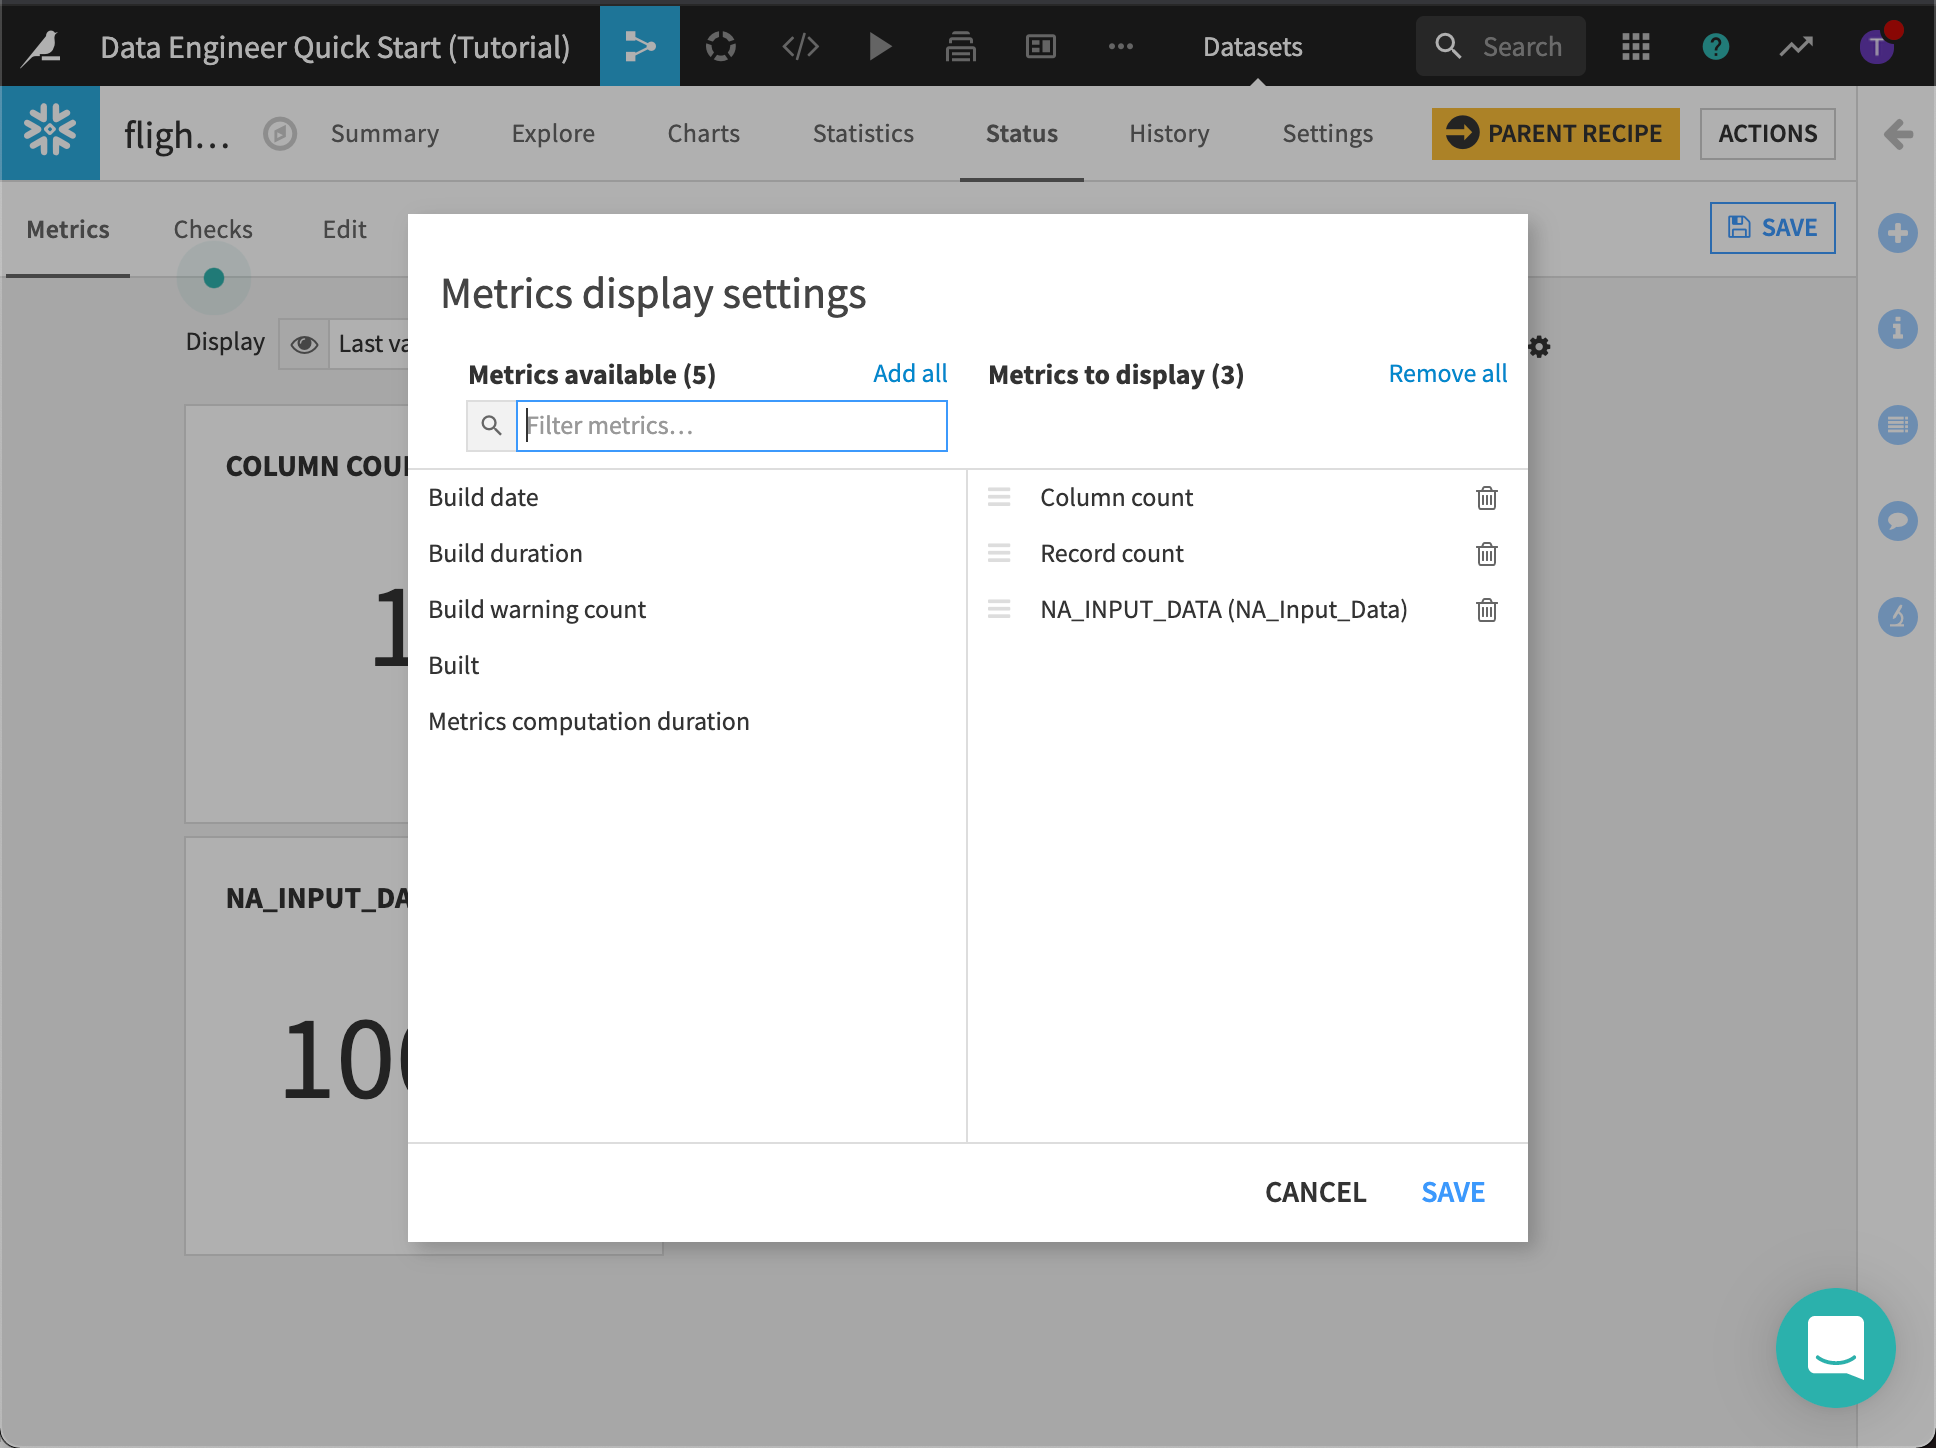
Dataiku DSS displays the three metrics.
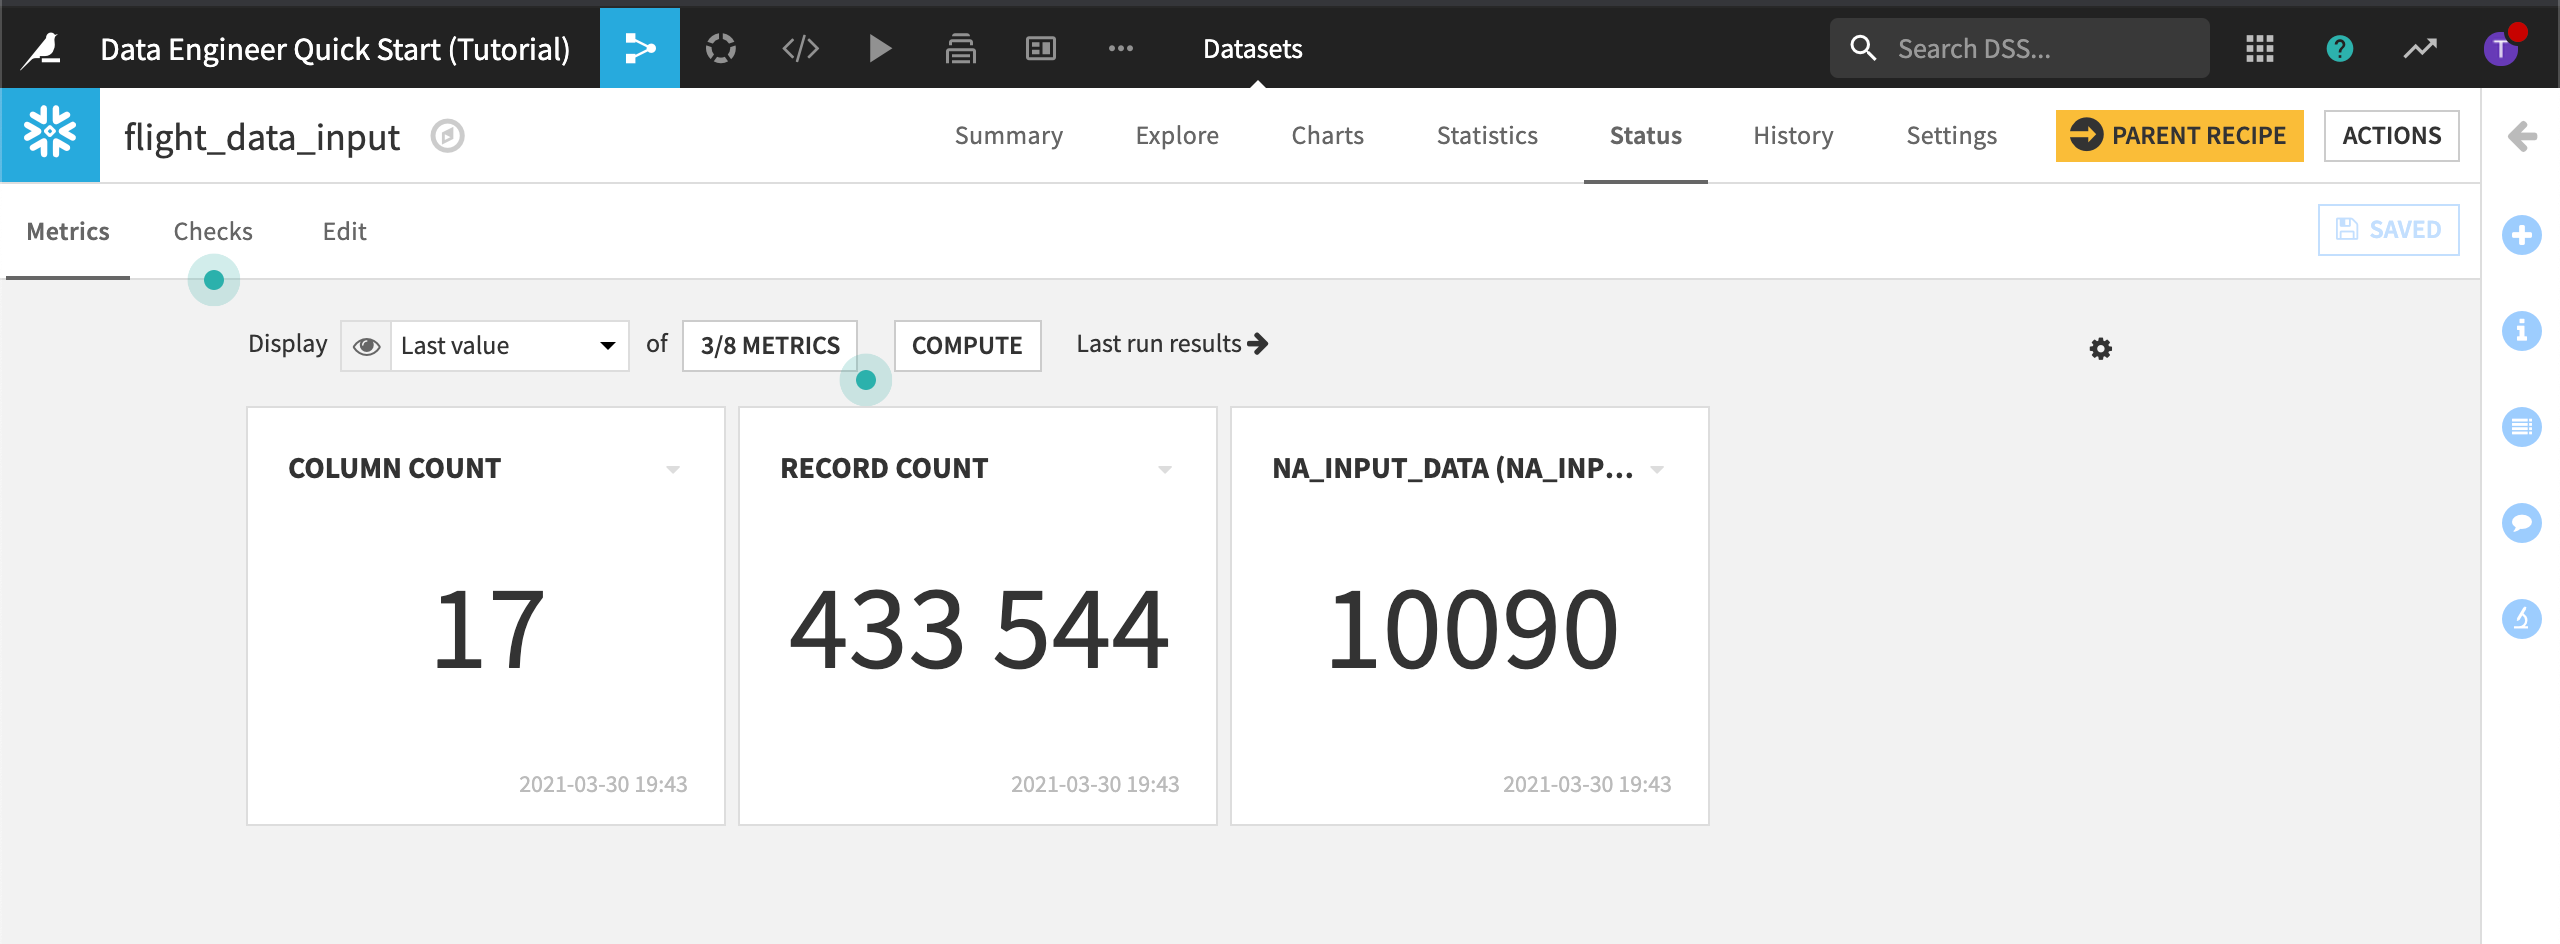
Let’s add a check so we know when this metric falls outside an acceptable range. Let’s say anything below 8,000 “NA” records is acceptable, while anything above approximately 15,000 “NA” records indicates a problem with the dataset.
Open the Edit subtab again.
Click to view the Checks panel.
Add a new check to check when a Metric Value is in a Numeric Range.
Name it
Check_NA.The metric to check is NA_INPUT_DATA (NA_Input_Data).
Set the Soft maximum to
8000and the Maximum to14985.
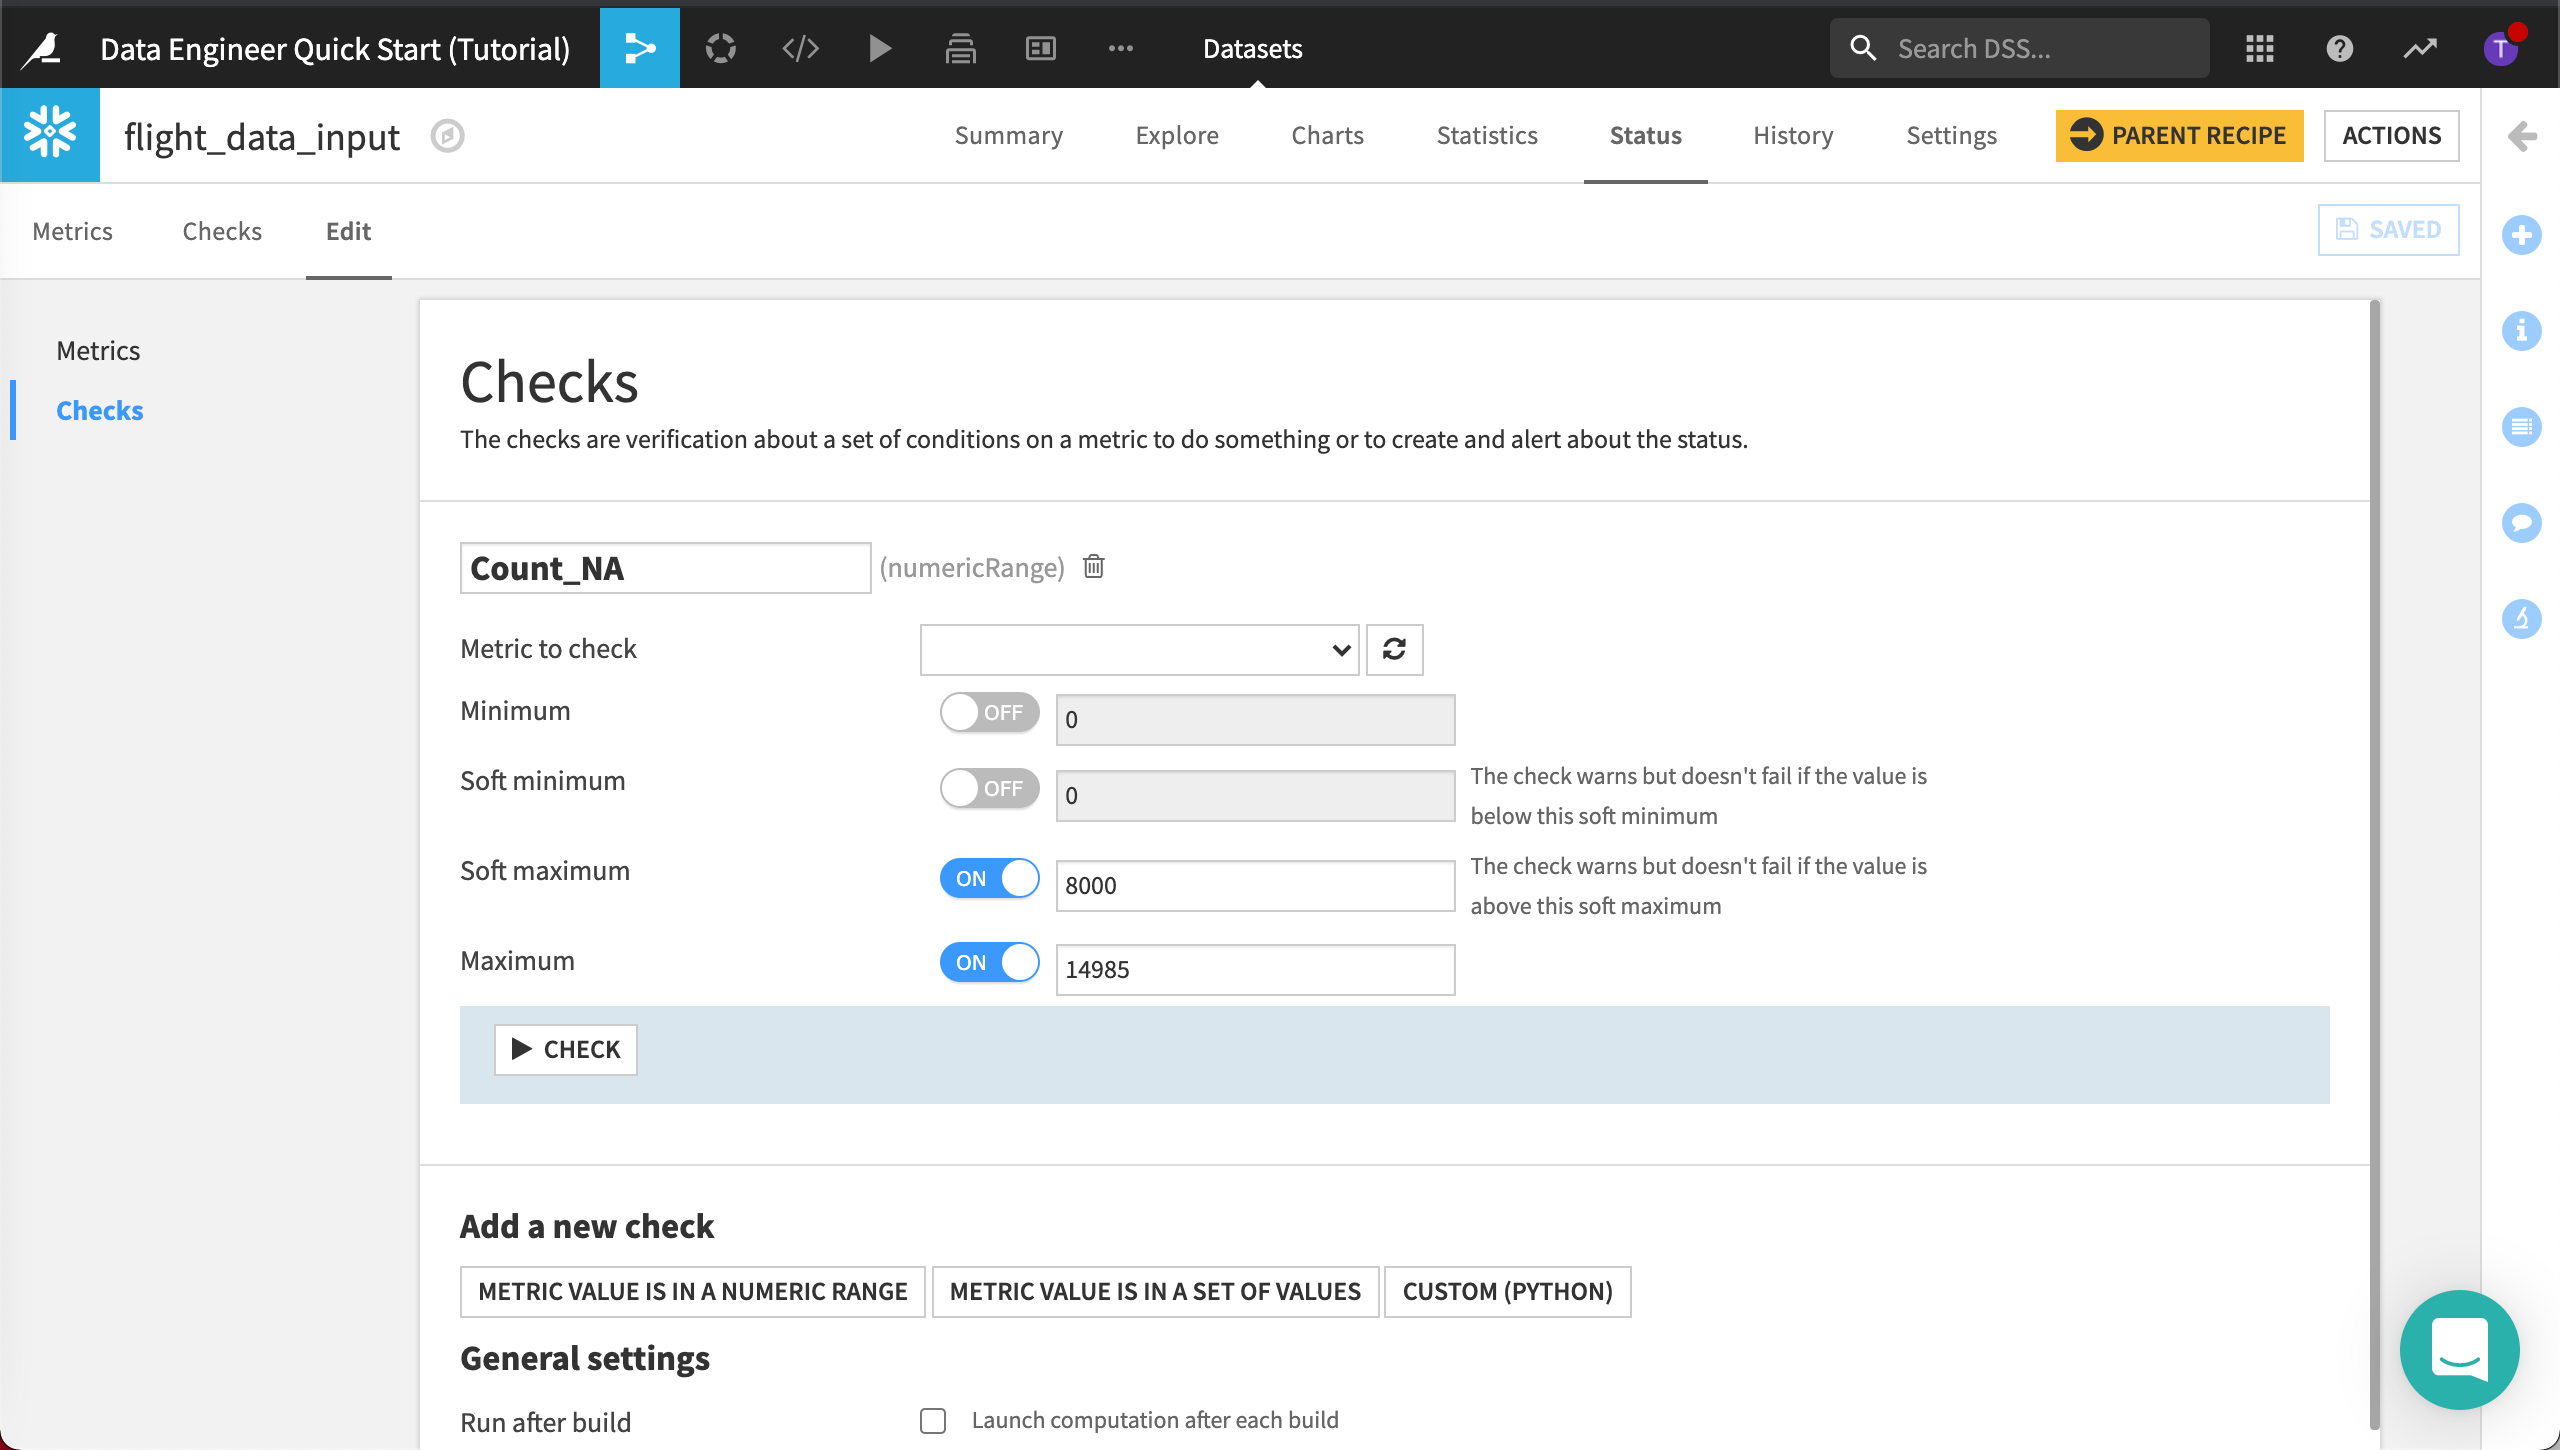
Click Save.
Later, we’ll automate the build of our datasets which will prompt Dataiku DSS to run the metrics and checks. If the number of invalid records is above “14985”, the check will fail.
Before we automate our metrics and checks, let’s discover how to visually build out the data pipeline.