Share Metrics Using a Dashboard
Business stakeholders rely on data to make decisions. In Dataiku DSS, these stakeholders can view the project and associated assets (like dashboards), check the project’s overall status, and view recent activity. Let’s simplify this task for them by publishing relevant insights to the project’s dashboard.
Publish Metrics to the Dashboard
Let’s say that team members will want to know how many invalid records (where the actual flight duration is “NA”) were found in the input dataset and the length of time it takes to build the final dataset in the Flow, flight_data_evaluated.
To provide this information, we’ll need to publish the metrics that were computed for flight_data_input and flight_data_evaluated.
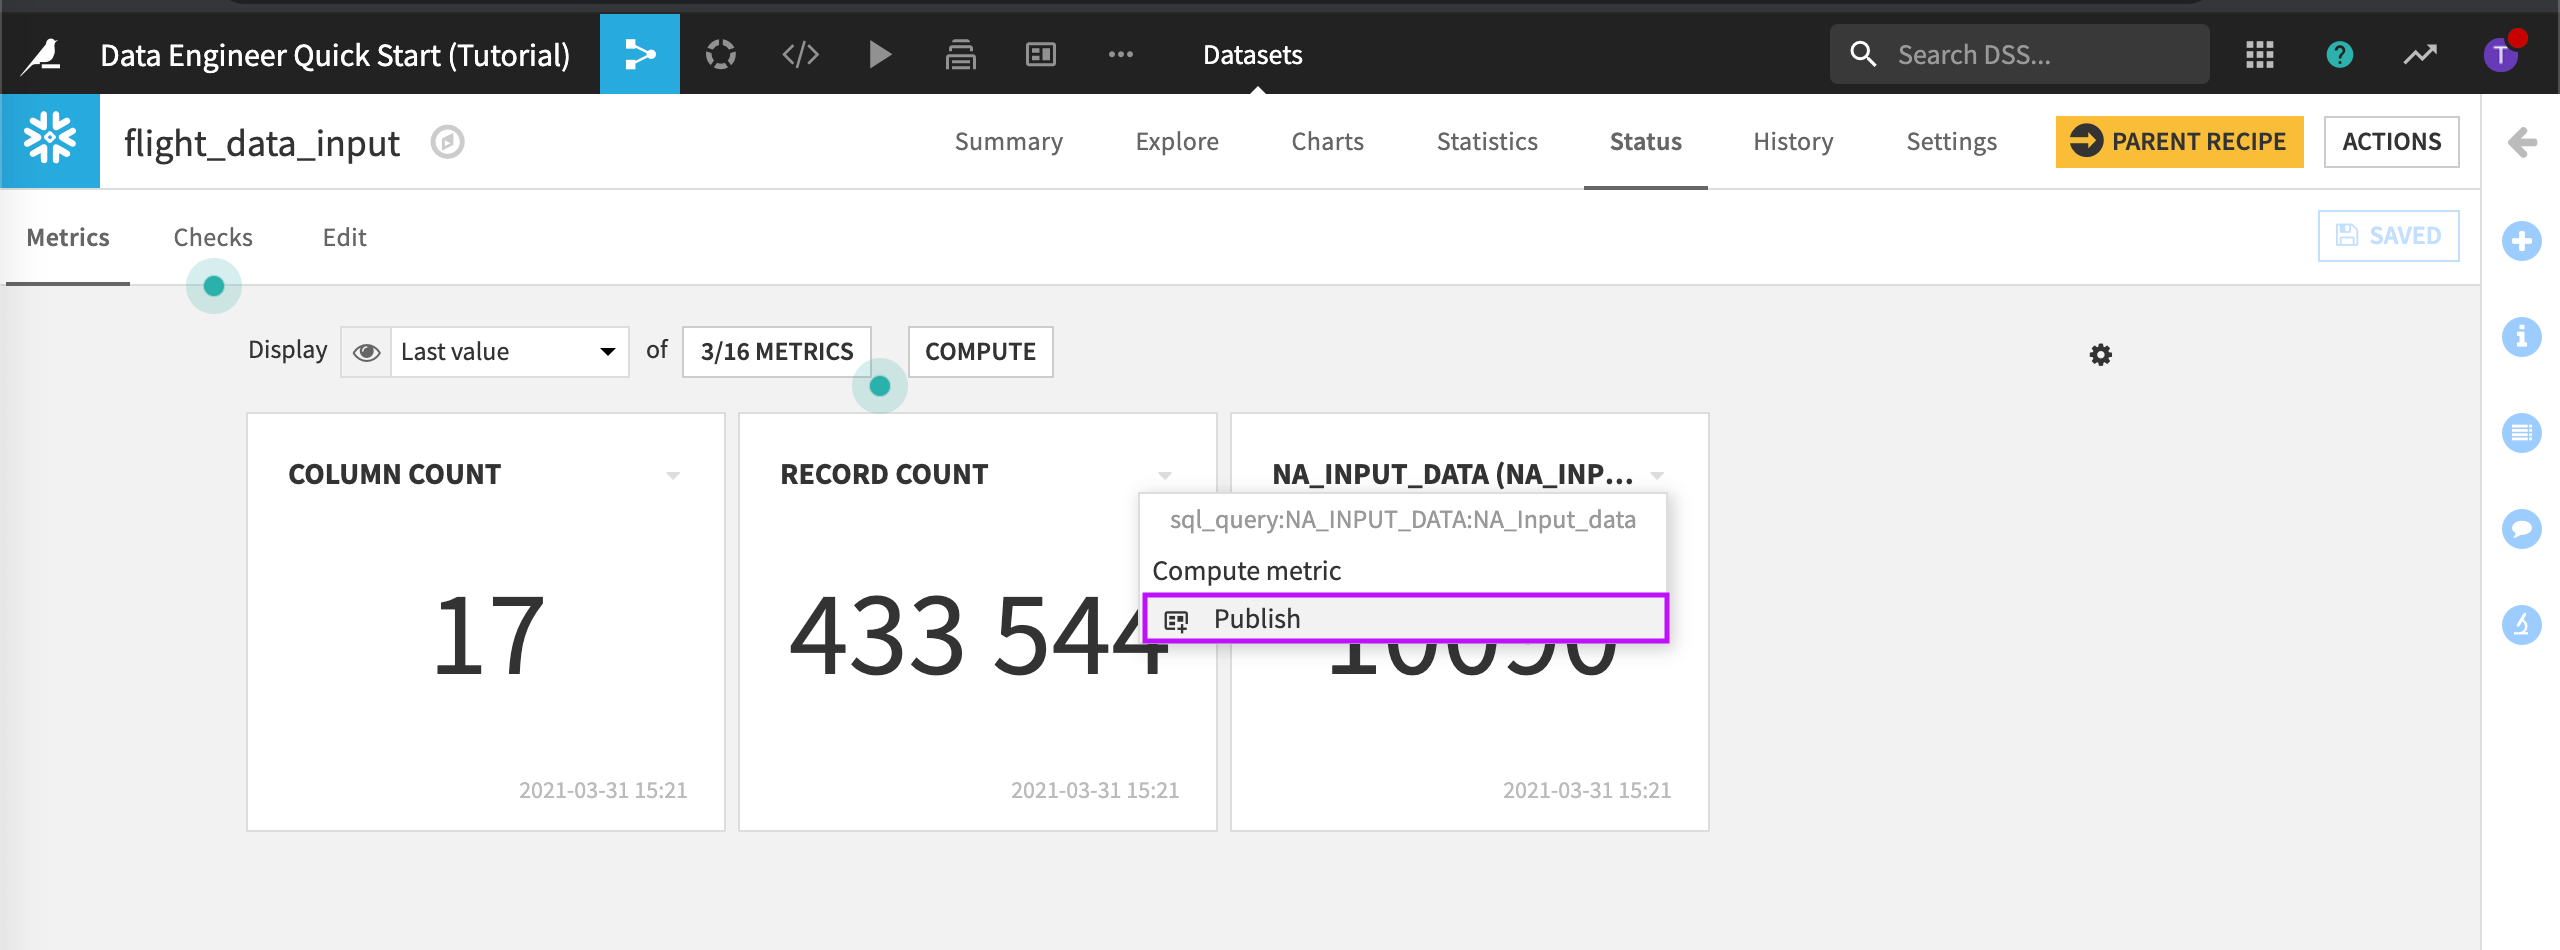
From the Flow, open the dataset, flight_data_input and go to the Status tab.
Click the drop-down arrow next to the “NA Input Data” computed metric.
Choose Publish.

Select the default dashboard and the Project information slide.
Click Create.
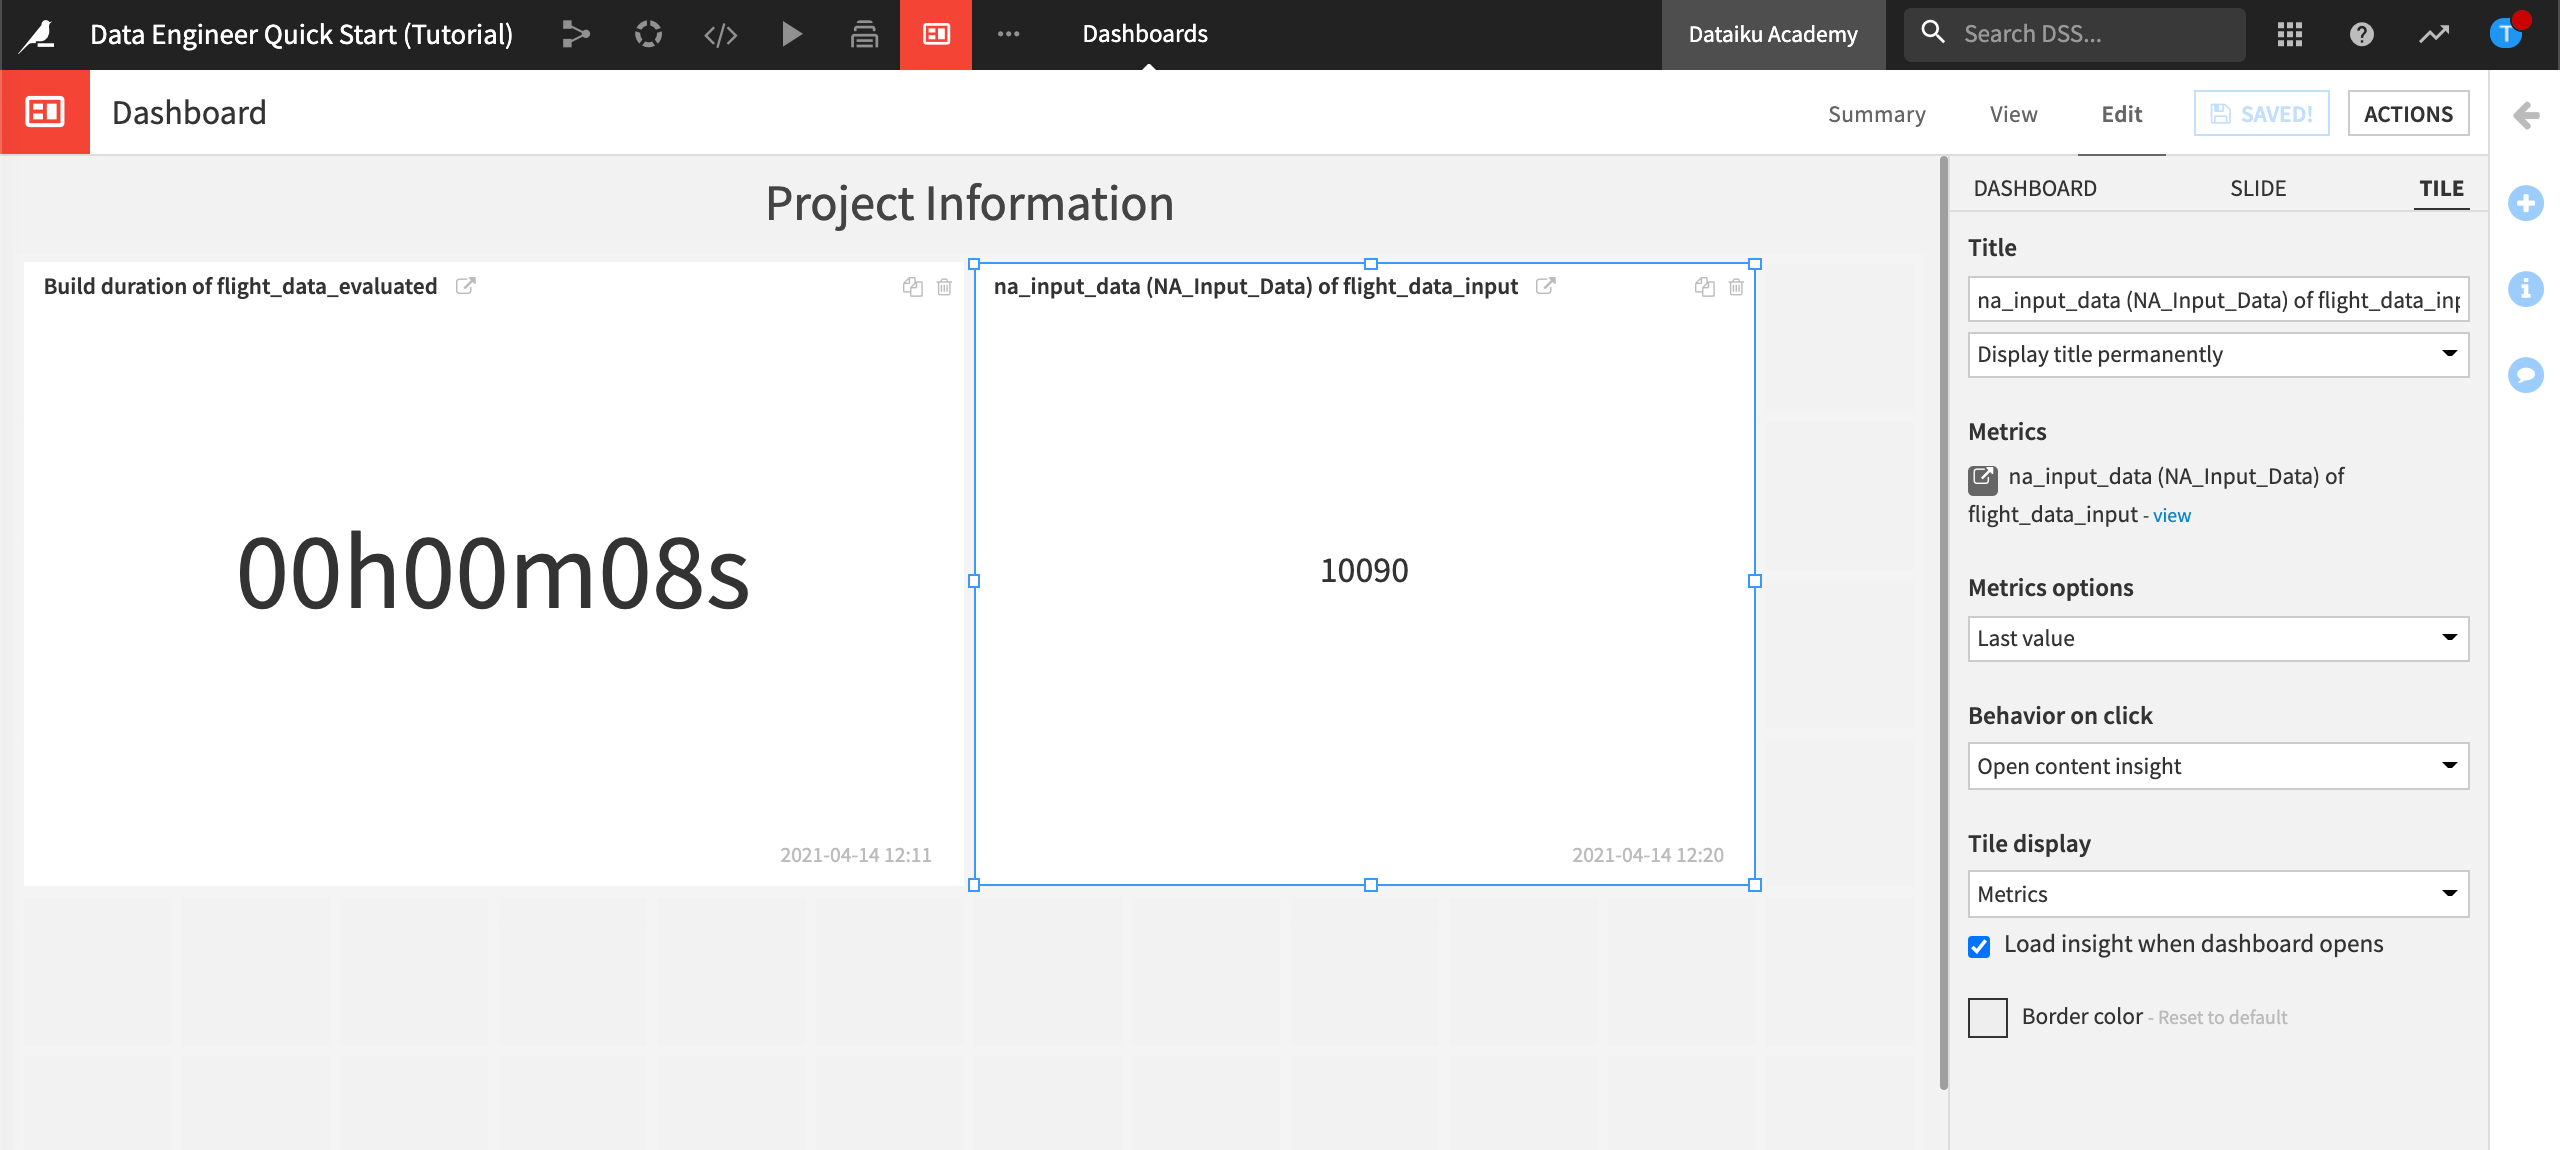
Dataiku DSS displays the default dashboard and the published metric. This dashboard already contains the metric to show the build duration of flight_data_evaluated.
Grab the handles of the newly published insight to resize it.
Save the changes.

Export the Dashboard
We could now export this dashboard to share it with users who do not have access to it. To do this:
In the upper right of the dashboard, click Actions.
Choose Export.
In File Type, select the type of file you want to export.
Click Export Dashboard.
Note
The dashboards export feature must be set up prior to being usable. For more information, visit Exporting dashboards to PDF or images.