Getting Started
Dataiku DSS is a collaborative, end-to-end data science and machine learning platform that unites data analysts, data scientists, data engineers, architects, and business users in a common space to bring faster business insights.
In this quick start, you will learn about the ways that Dataiku DSS can provide value to coders and data scientists through a simple use case: predicting whether a customer will generate high or low revenue. You’ll explore an existing project and improve upon the steps that a data analyst team member already performed. Some of the tasks you’ll perform include:
exploring data using a Python notebook;
engineering features using code in a notebook and code recipe;
training a machine learning model and generating predictions;
monitoring model performance using a scenario, and more.
This hands-on tutorial is designed for coders and data scientists entirely new to Dataiku DSS. Because Dataiku DSS is an inclusive enterprise AI platform, you’ll see how many actions performed using the coding interface can be completed using the point-and-click interface.
Note
This tutorial is part of our quick start program that includes:
AI Consumer which explores the visual interface,
Business Analyst which covers data pipelines and advanced analytics,
Data Engineer which focuses on collaboration, model metrics, and Flow improvement, and
Data Scientist which covers the use of the coding interface in Dataiku DSS.
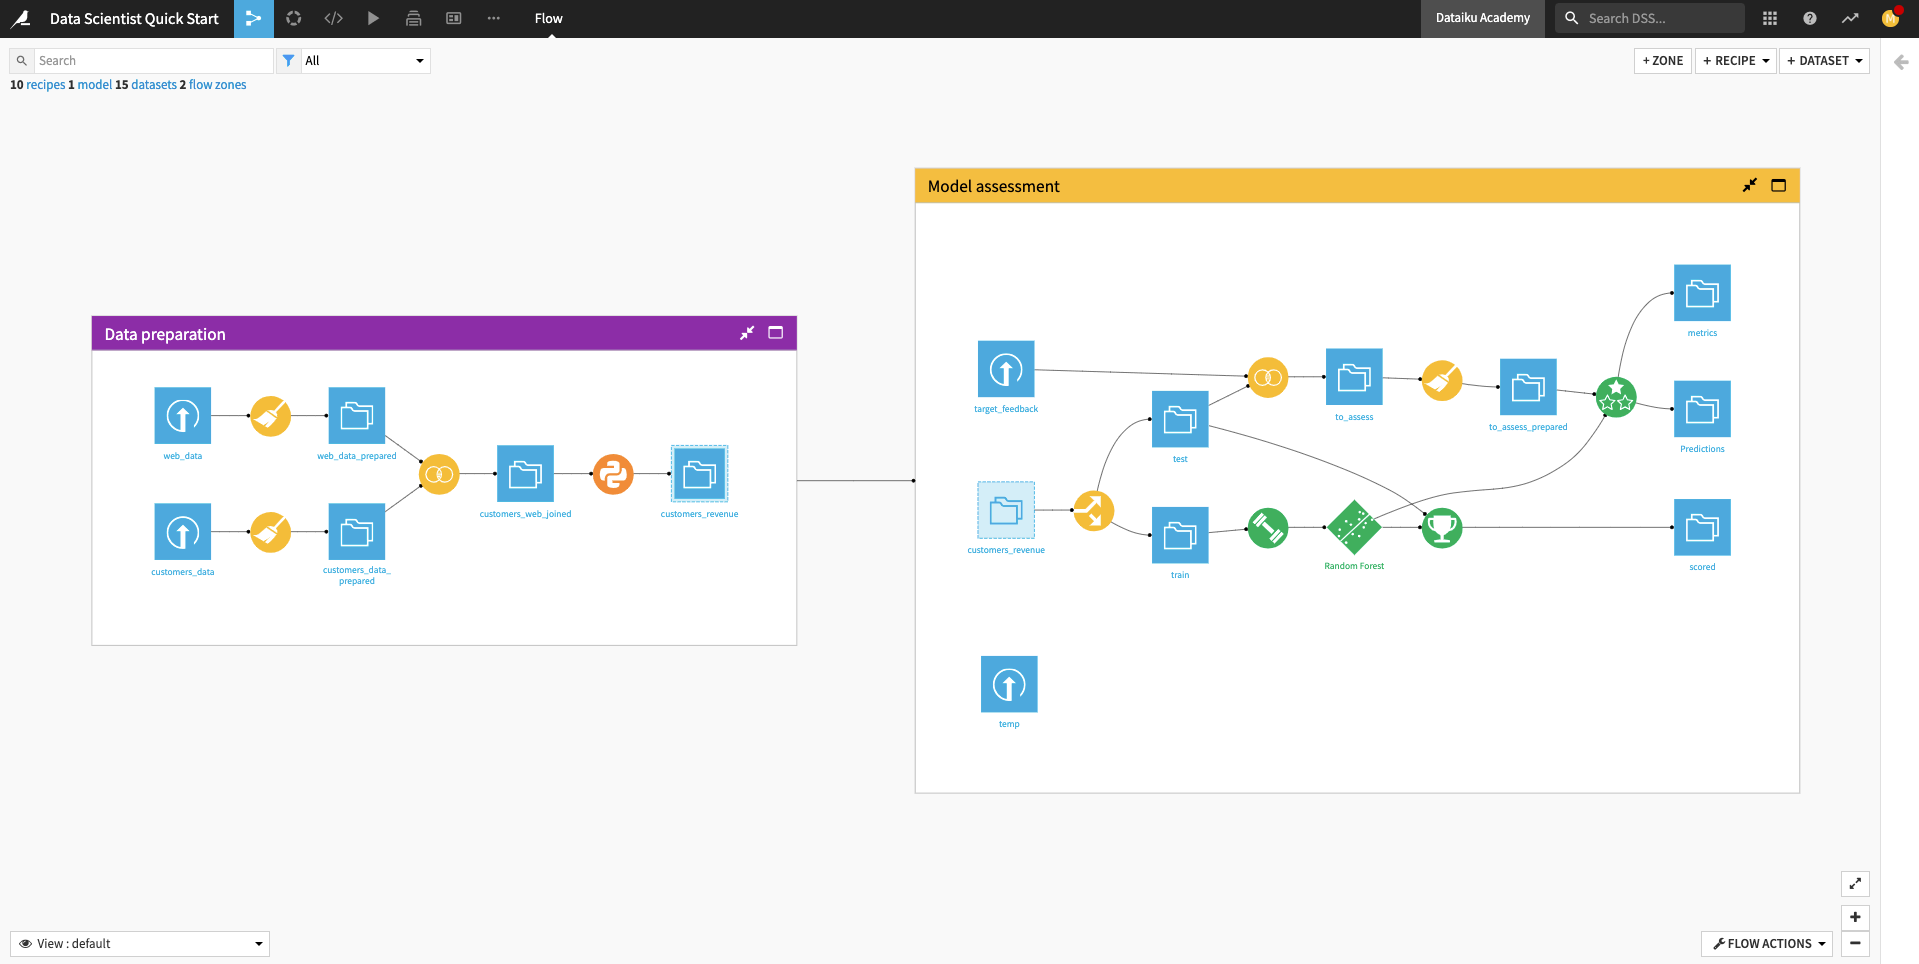
When you’re finished, you will have built the workflow below and understood all of its components!
Prerequisites
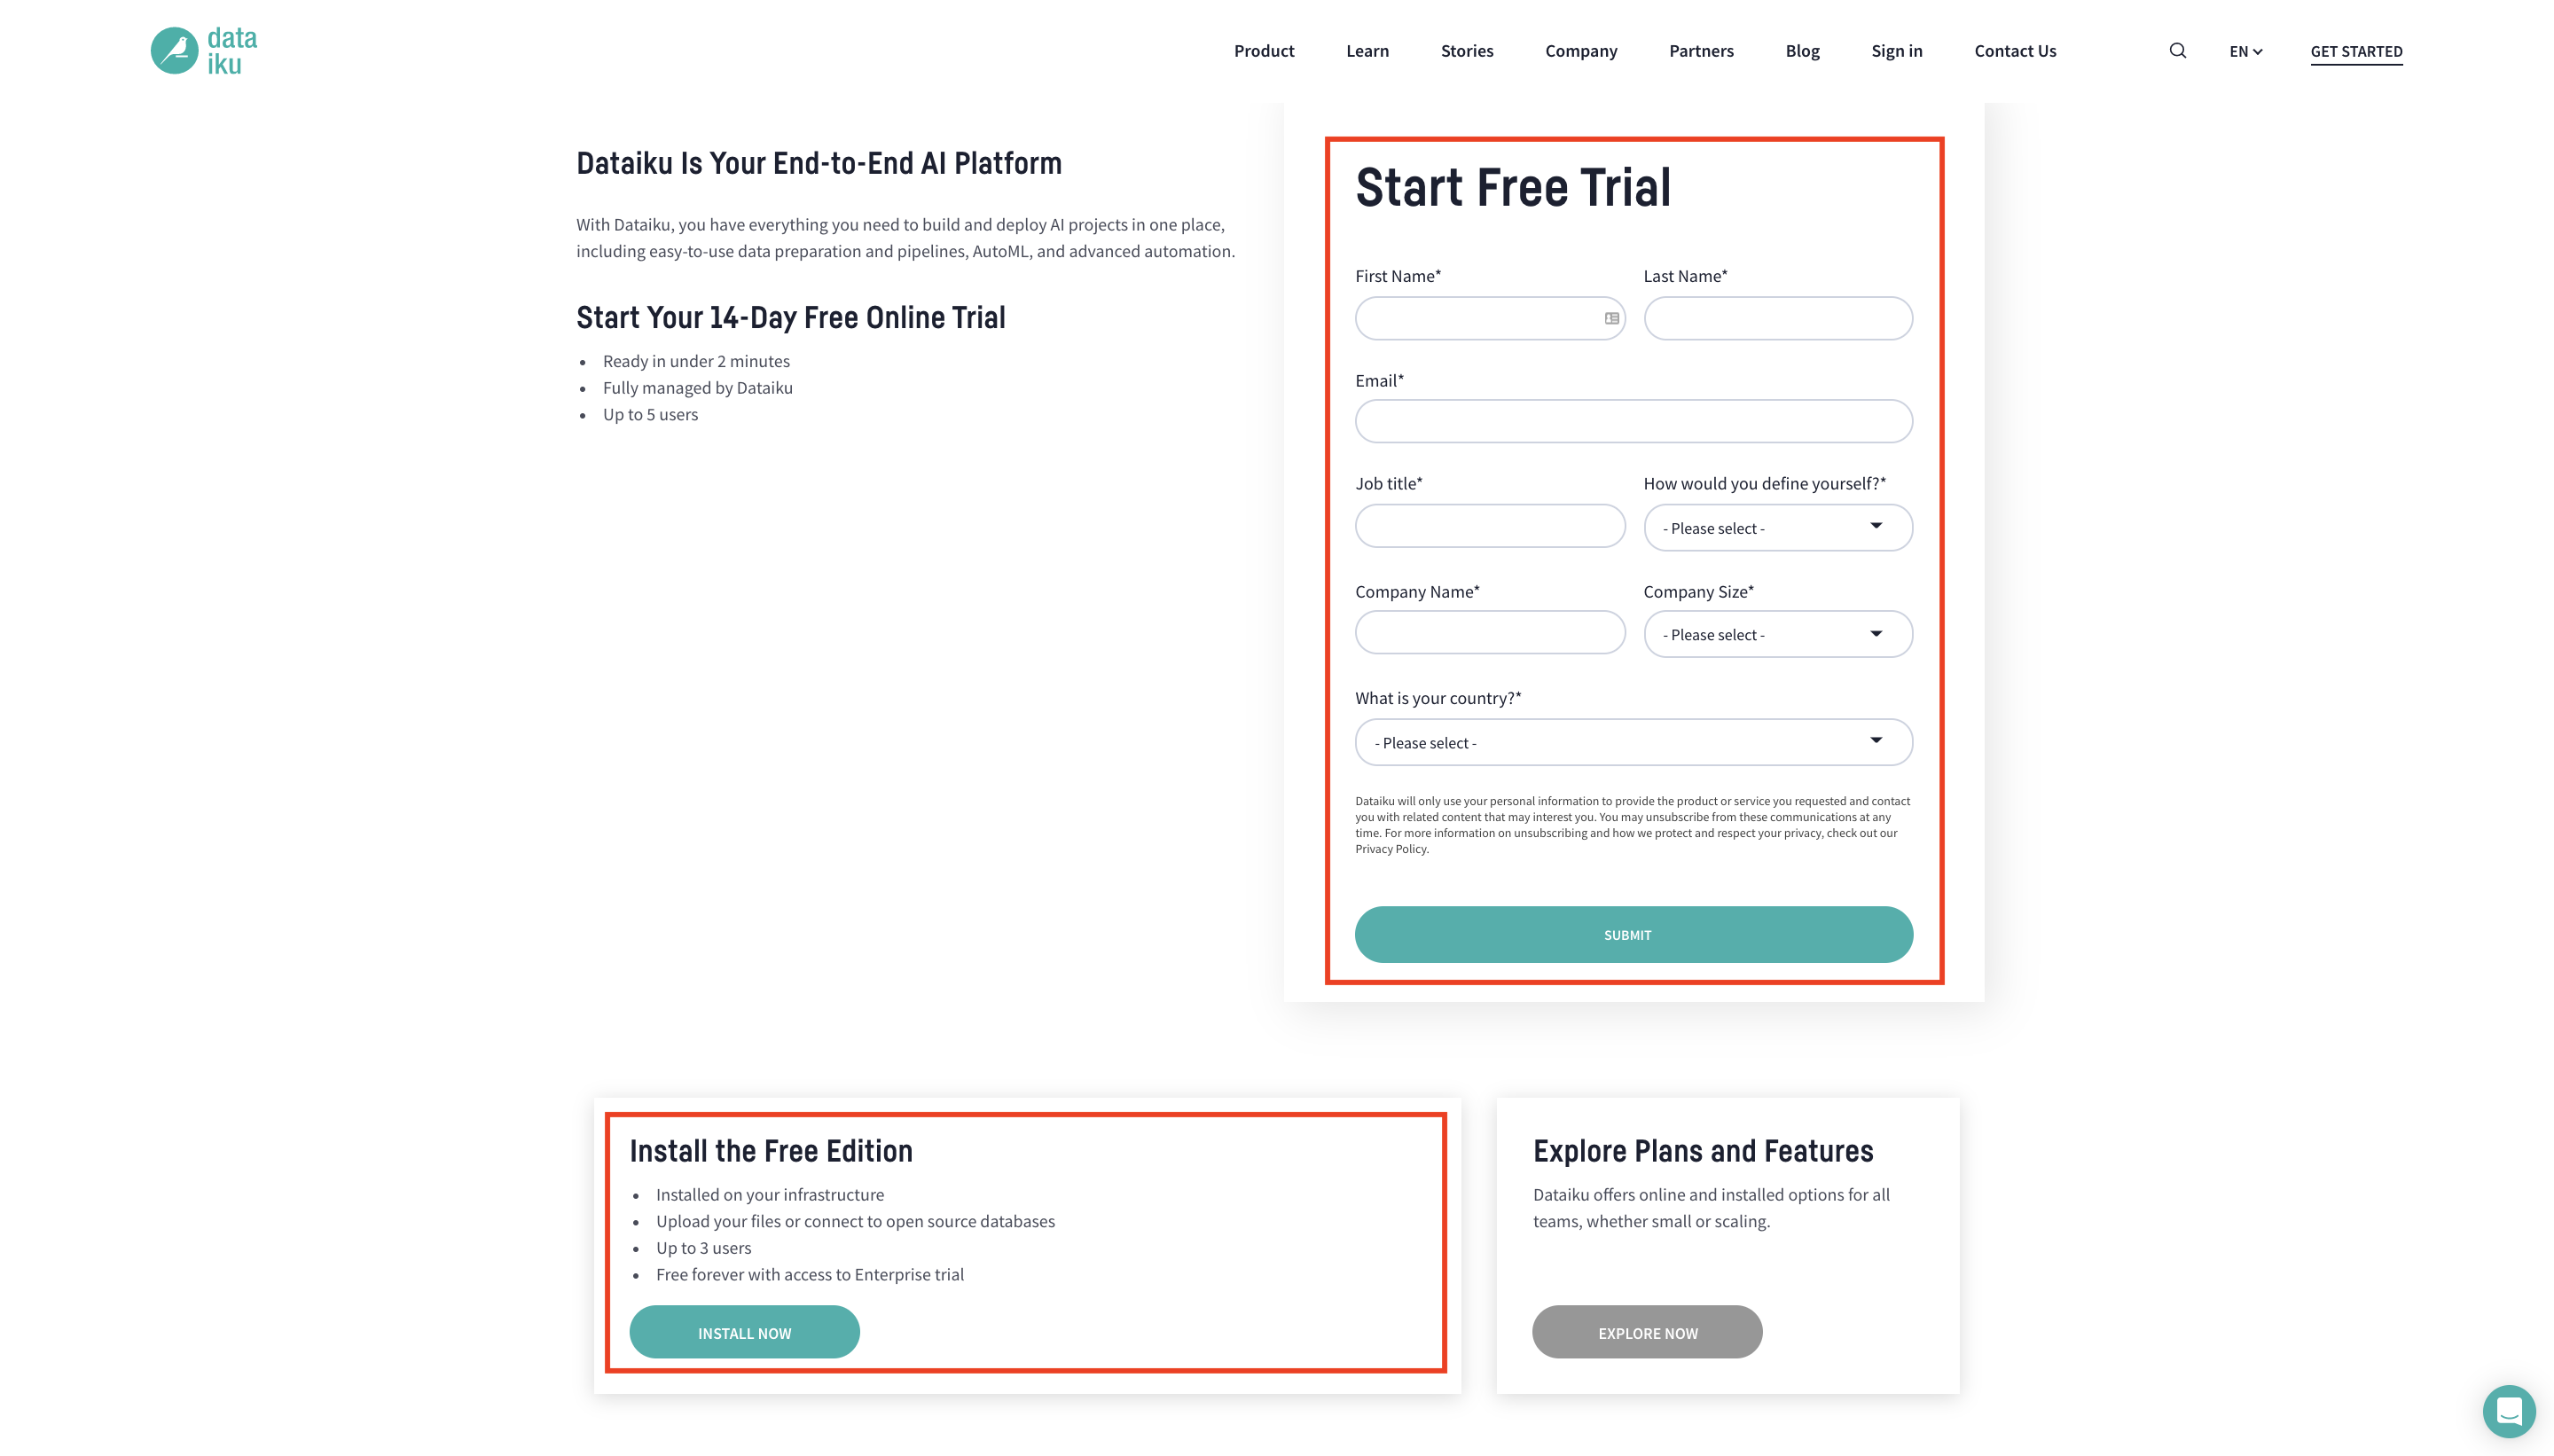
To follow along or reproduce the tutorial steps, you will need access to an instance of Dataiku DSS (version 9.0 or above). If you do not already have access, you can get started in one of two ways:
Start a 14-Day Free Online Trial, or
Download the free edition.
Tip
For each section of this quick start, written instructions are recorded in bullet points. Be sure to follow these while using the screenshots as a guide. We also suggest that you keep these instructions open in one tab of your browser and your Dataiku DSS instance open in another.
You can find a read-only completed version of the final project in the public gallery.
Create the Project
When you open your instance of Dataiku DSS, you’ll immediately land on the Dataiku homepage. Here, you’ll be able to browse projects, recent items, dashboards, and applications that have been shared with you.
Note
A Dataiku DSS project is a holder for all work on a particular activity.
You can create a new project in a few different ways. You can start a blank project or import a zip file. You might also have projects already shared with you based on the user groups to which you belong.
We’ll create our project from an existing Dataiku tutorial project.
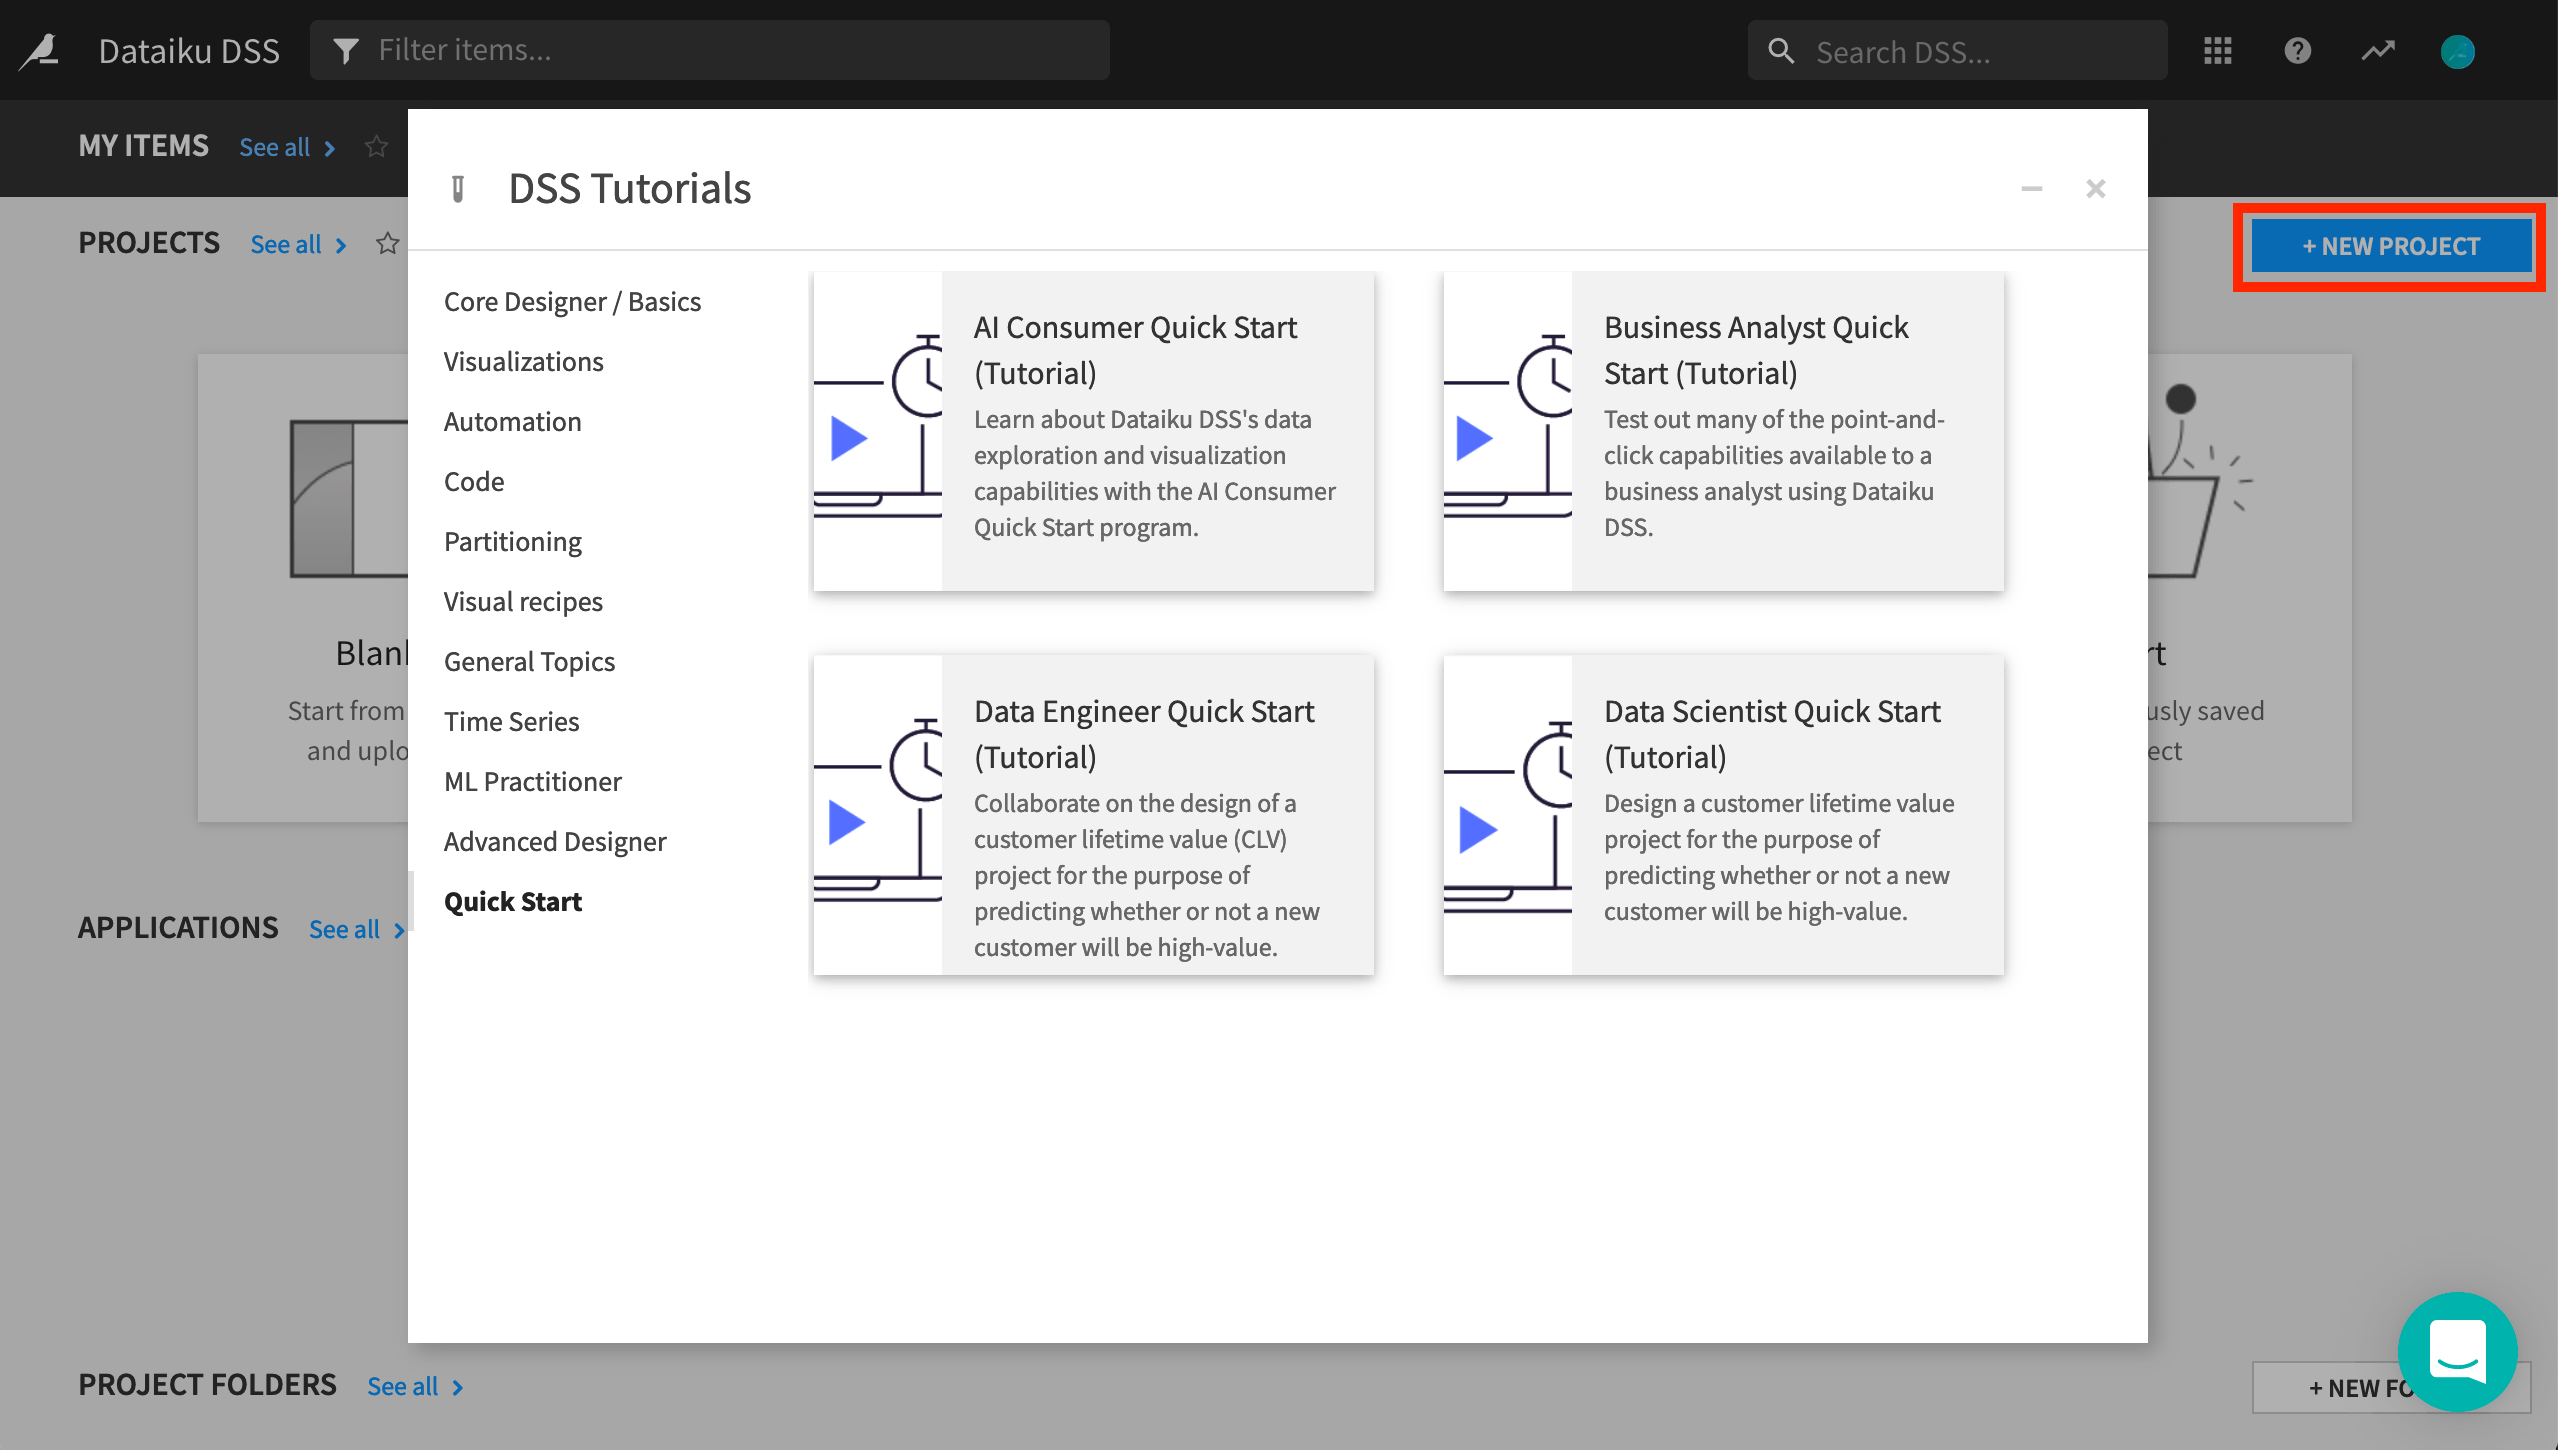
From the Dataiku DSS homepage, click on +New Project.
Choose DSS Tutorials > Quick Start > Data Scientist Quick Start (Tutorial).
Click OK when the tutorial has been successfully created.
Explore the Project
After creating the project, you’ll land on the project homepage. This page contains a high-level overview of the project’s status and recent activity, along with shortcuts such as those found in the top navigation bar.
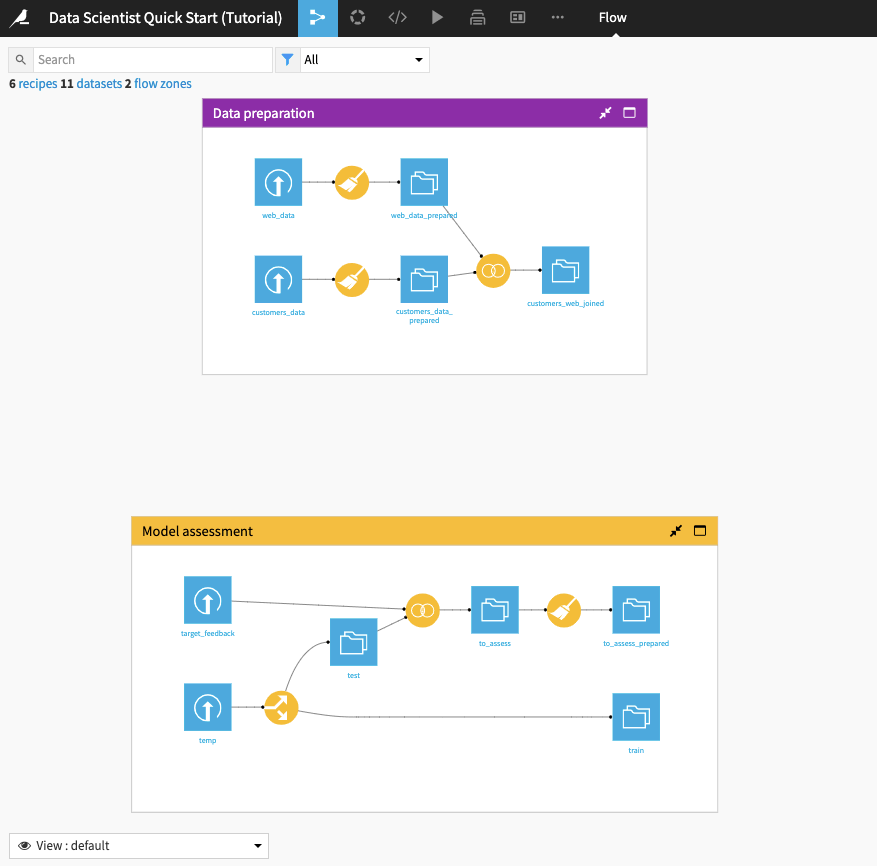
From the top navigation bar, click the Flow icon to open up the project workflow, called the Flow.
Note
The Flow is the visual representation of how data, recipes (steps for data transformation), and models work together to move data through an analytics pipeline.
A blue square in the Flow represents a dataset. The icon on the square represents the type of dataset, such as an uploaded file, or its underlying storage connection, such as a SQL database or cloud storage.
Begin by building all the datasets in the Flow. To do this,
Click Flow Actions from the bottom-right corner of your window.
Select Build all and keep the default selection for handling dependencies.
Click Build.
Wait for the build to finish, then refresh the page to see the built Flow.
Tip
No matter what kind of dataset the blue square represents, the methods and interface in Dataiku DSS for exploring, visualizing, and analyzing it are the same.
Explore the Flow
The Flow begins with two Flow Zones, one for Data preparation and one for Model assessment.
Data preparation
The Data preparation Flow Zone contains two input datasets: web_data and customers_data. These datasets contain customer information, such as customer web usage and revenue.
A data analyst colleague has cleaned these datasets and performed some preliminary preparation on them. In this quick start, a data scientist will perform some feature engineering on these datasets and use them to build a machine learning (ML) model that predicts whether a customer will generate high revenue.
Model assessment
The Model assessment Flow Zone contains two input datasets: target_feedback and temp. The target_feedback dataset contains the ground truth (or true labels) for a test dataset used to evaluate the ML model’s performance. On the other hand, temp is a placeholder and will be replaced by an intermediate dataset in the Flow.
In the Model assessment Flow Zone, the data analyst has created a to_assess_prepared dataset that contains the test data and their true labels. This dataset will be used for evaluating the true test performance of the ML model