Hands-On: Perform N-sample Location Tests
Note
This lesson is a continuation of the Interactive Visual Statistics hands-on tutorial.
These tests allow you to compare the location parameters of multiple populations.
Let’s determine whether the means of multiple populations for the density variable are equal. To do this, we will use the N-sample Oneway ANOVA card.
Click the New Card button from the “Worksheet” header, and then select Statistical tests. Under N-sample test, click Oneway ANOVA.
Select density as the “Test Variable”.
Select quality as the “Grouping Variable”. Because quality has more than two values, we can use this variable to create multiple groups.
Select “Build groups from most frequent values”, and keep the default “Maximum number of groups
10.
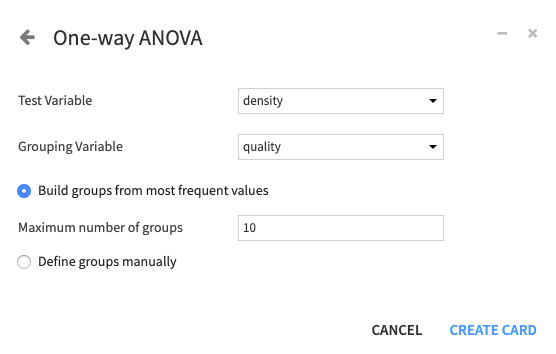
Click Create Card to create the card.
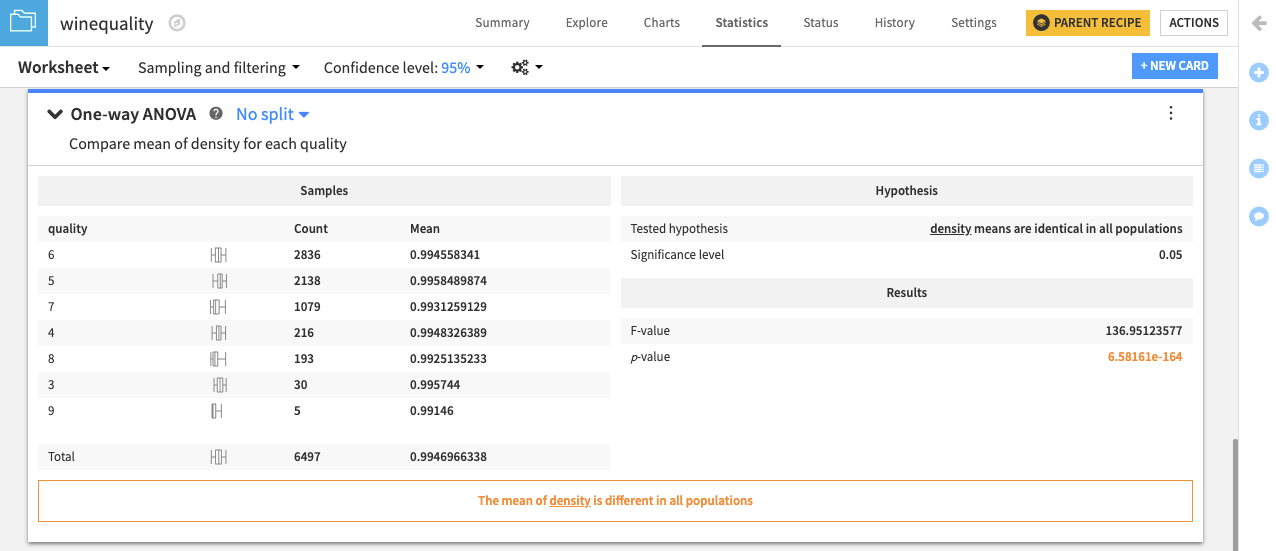
The card displays a summary of the samples for all the groups, the tested hypothesis, results of the test, and a conclusion about the test — in this case, “The mean of density is different in all populations”. For more information about the Oneway ANOVA card, see One-way ANOVA in the reference documentation.
Other available N-sample test cards include the Median mood test (N-samples), the Pairwise student t-test, and the Pairwise median mood test. To learn more about these cards, see N-sample tests in the reference documentation.