Hands-On: Perform Two-sample Distribution Tests
Note
This lesson is a continuation of the Interactive Visual Statistics hands-on tutorial.
These tests allow you to compare the distributions of two populations. For example, let’s test whether the distribution of the density variable is the same for the red wine and the white wine populations. To do this, we will use the Kolmogrov-Smirnov test card.
Click the New Card button from the “Worksheet” header, then select Statistical tests. Under Two-sample test, click Kolmogrov-Smirnov.
Select density as the “Test Variable”
Select type as the “Grouping Variable”. This prompts you to specify values of type to create the two populations.
Add
redfor Population 1 andwhitefor Population 2 to create two disjoint groups.Click Create Card to create the card.
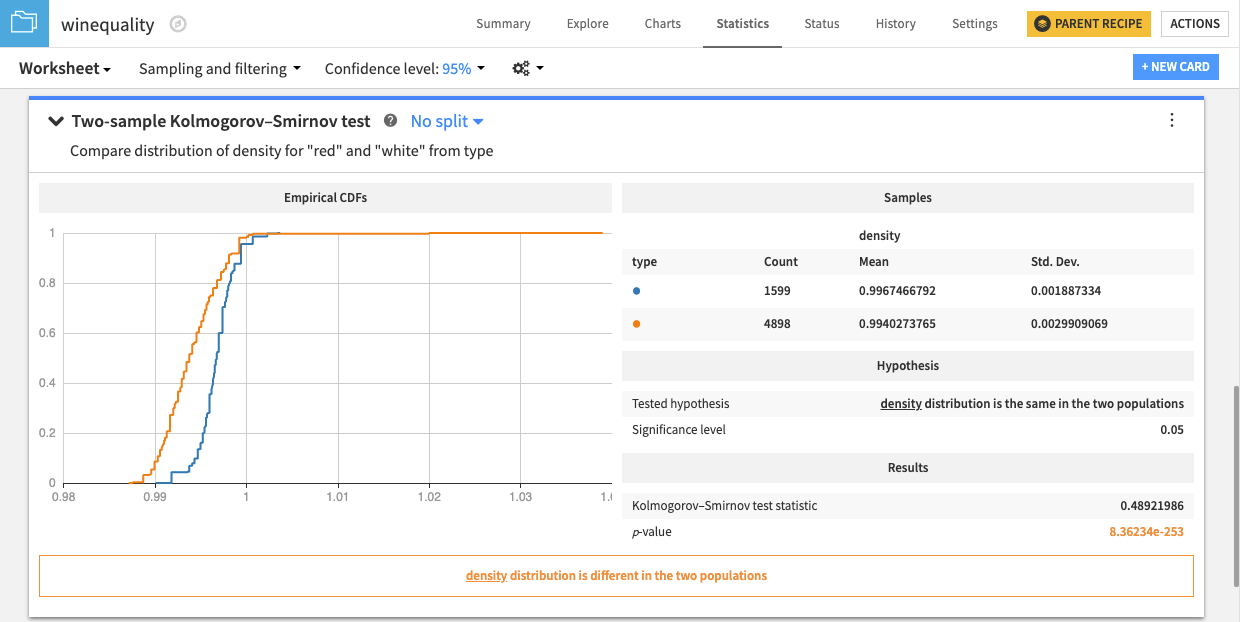
The card displays a figure of the empirical Cumulative Distribution Functions (CDFs) of the two populations, a summary of samples from the two populations, the tested hypothesis, results of the test, and a conclusion about the test — in this case, “density distribution is different in the two populations”. For more information about the Kolmogorov-Smirnov card, see Kolmogrov-Smirnov test (two-sample) in the reference documentation.