Retrain the Model with New Data
New Capital Bikeshare data is periodically being created and uploaded to the site. Recall that the bike_data folder already contains data from 2017. We can incorporate this new data into the Flow and retrain our clustering model to account for changing usage of the Bikeshare system.
Return to the bike_data dataset, and navigate to the Settings tab.
Within the Files tab, select List Files to display the names of the two files available in the folder.
On the left, click on Show Advanced options and change the “Files to include” field to the 2017 data.
Click Test. Refreshing List Files should reflect the change.
After saving, return to the Explore tab. The Start date column should have 2017 dates.
Note
Depending on the situation, we might want to keep the 2016 data and analyze the combined data. For the purposes of this use case, we’ll retrain the model on just the 2017 data.
With the bike_data dataset now holding 2017 data, let’s retrain the model using the same workflow.
From the Clustering (KMEANS) on bikeStations_prepared_joined recipe, click Retrain from the Actions menu of the right sidebar.
For handling of dependencies, select Build & train required. This will perform a recursive build of the pipeline and pull the 2017 data through to the cluster model retraining.
Note
To see exactly which computations will be executed, clicking Preview takes one to the Jobs panel, where you can inspect the queue of activities awaiting any job.
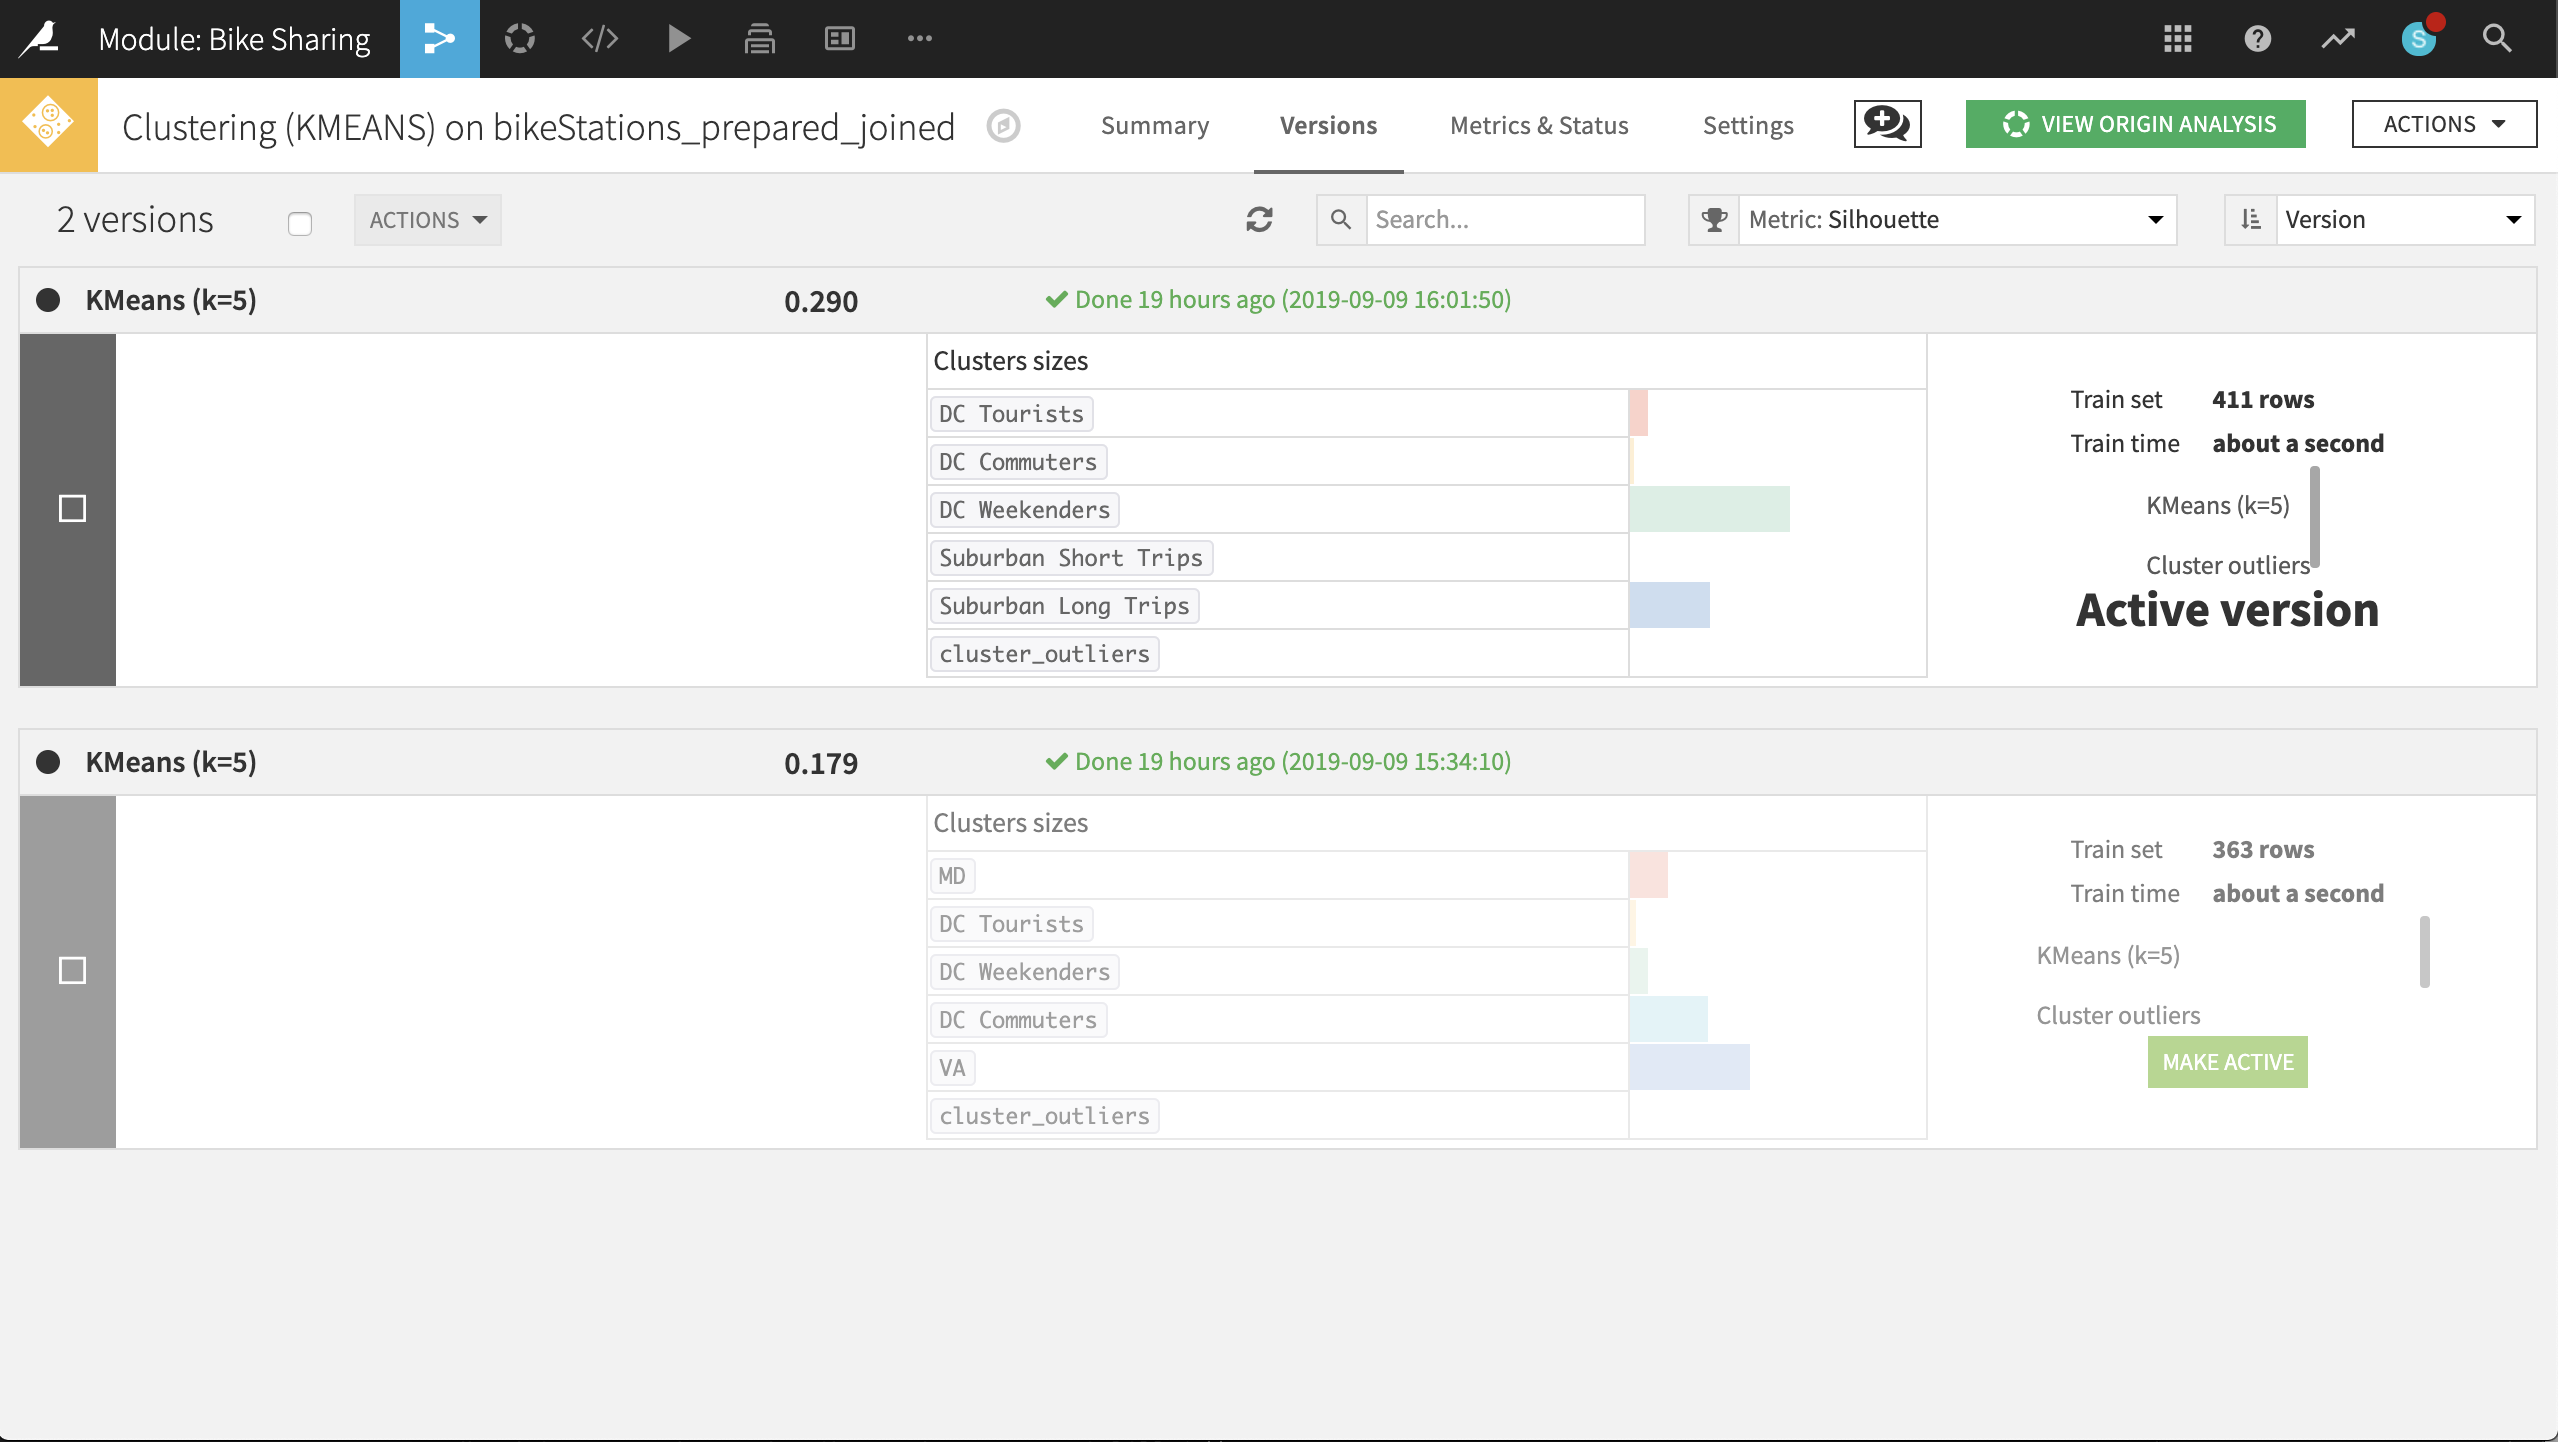
From the Flow, double-click on the model to see both versions. At the top-left corner of the Active version, click on KMeans (k-5) to inspect the updated metrics.
Looking at the updated heatmap, it appears that the clusters have shifted slightly. After studying the metrics, it may make more sense to label the clusters accordingly:
Rename VA to
Suburban Long Trips.Rename MD to
DC Tourists.Rename DC Commuters to
Suburban Short Trips.Rename DC Tourists to
DC Commuters.
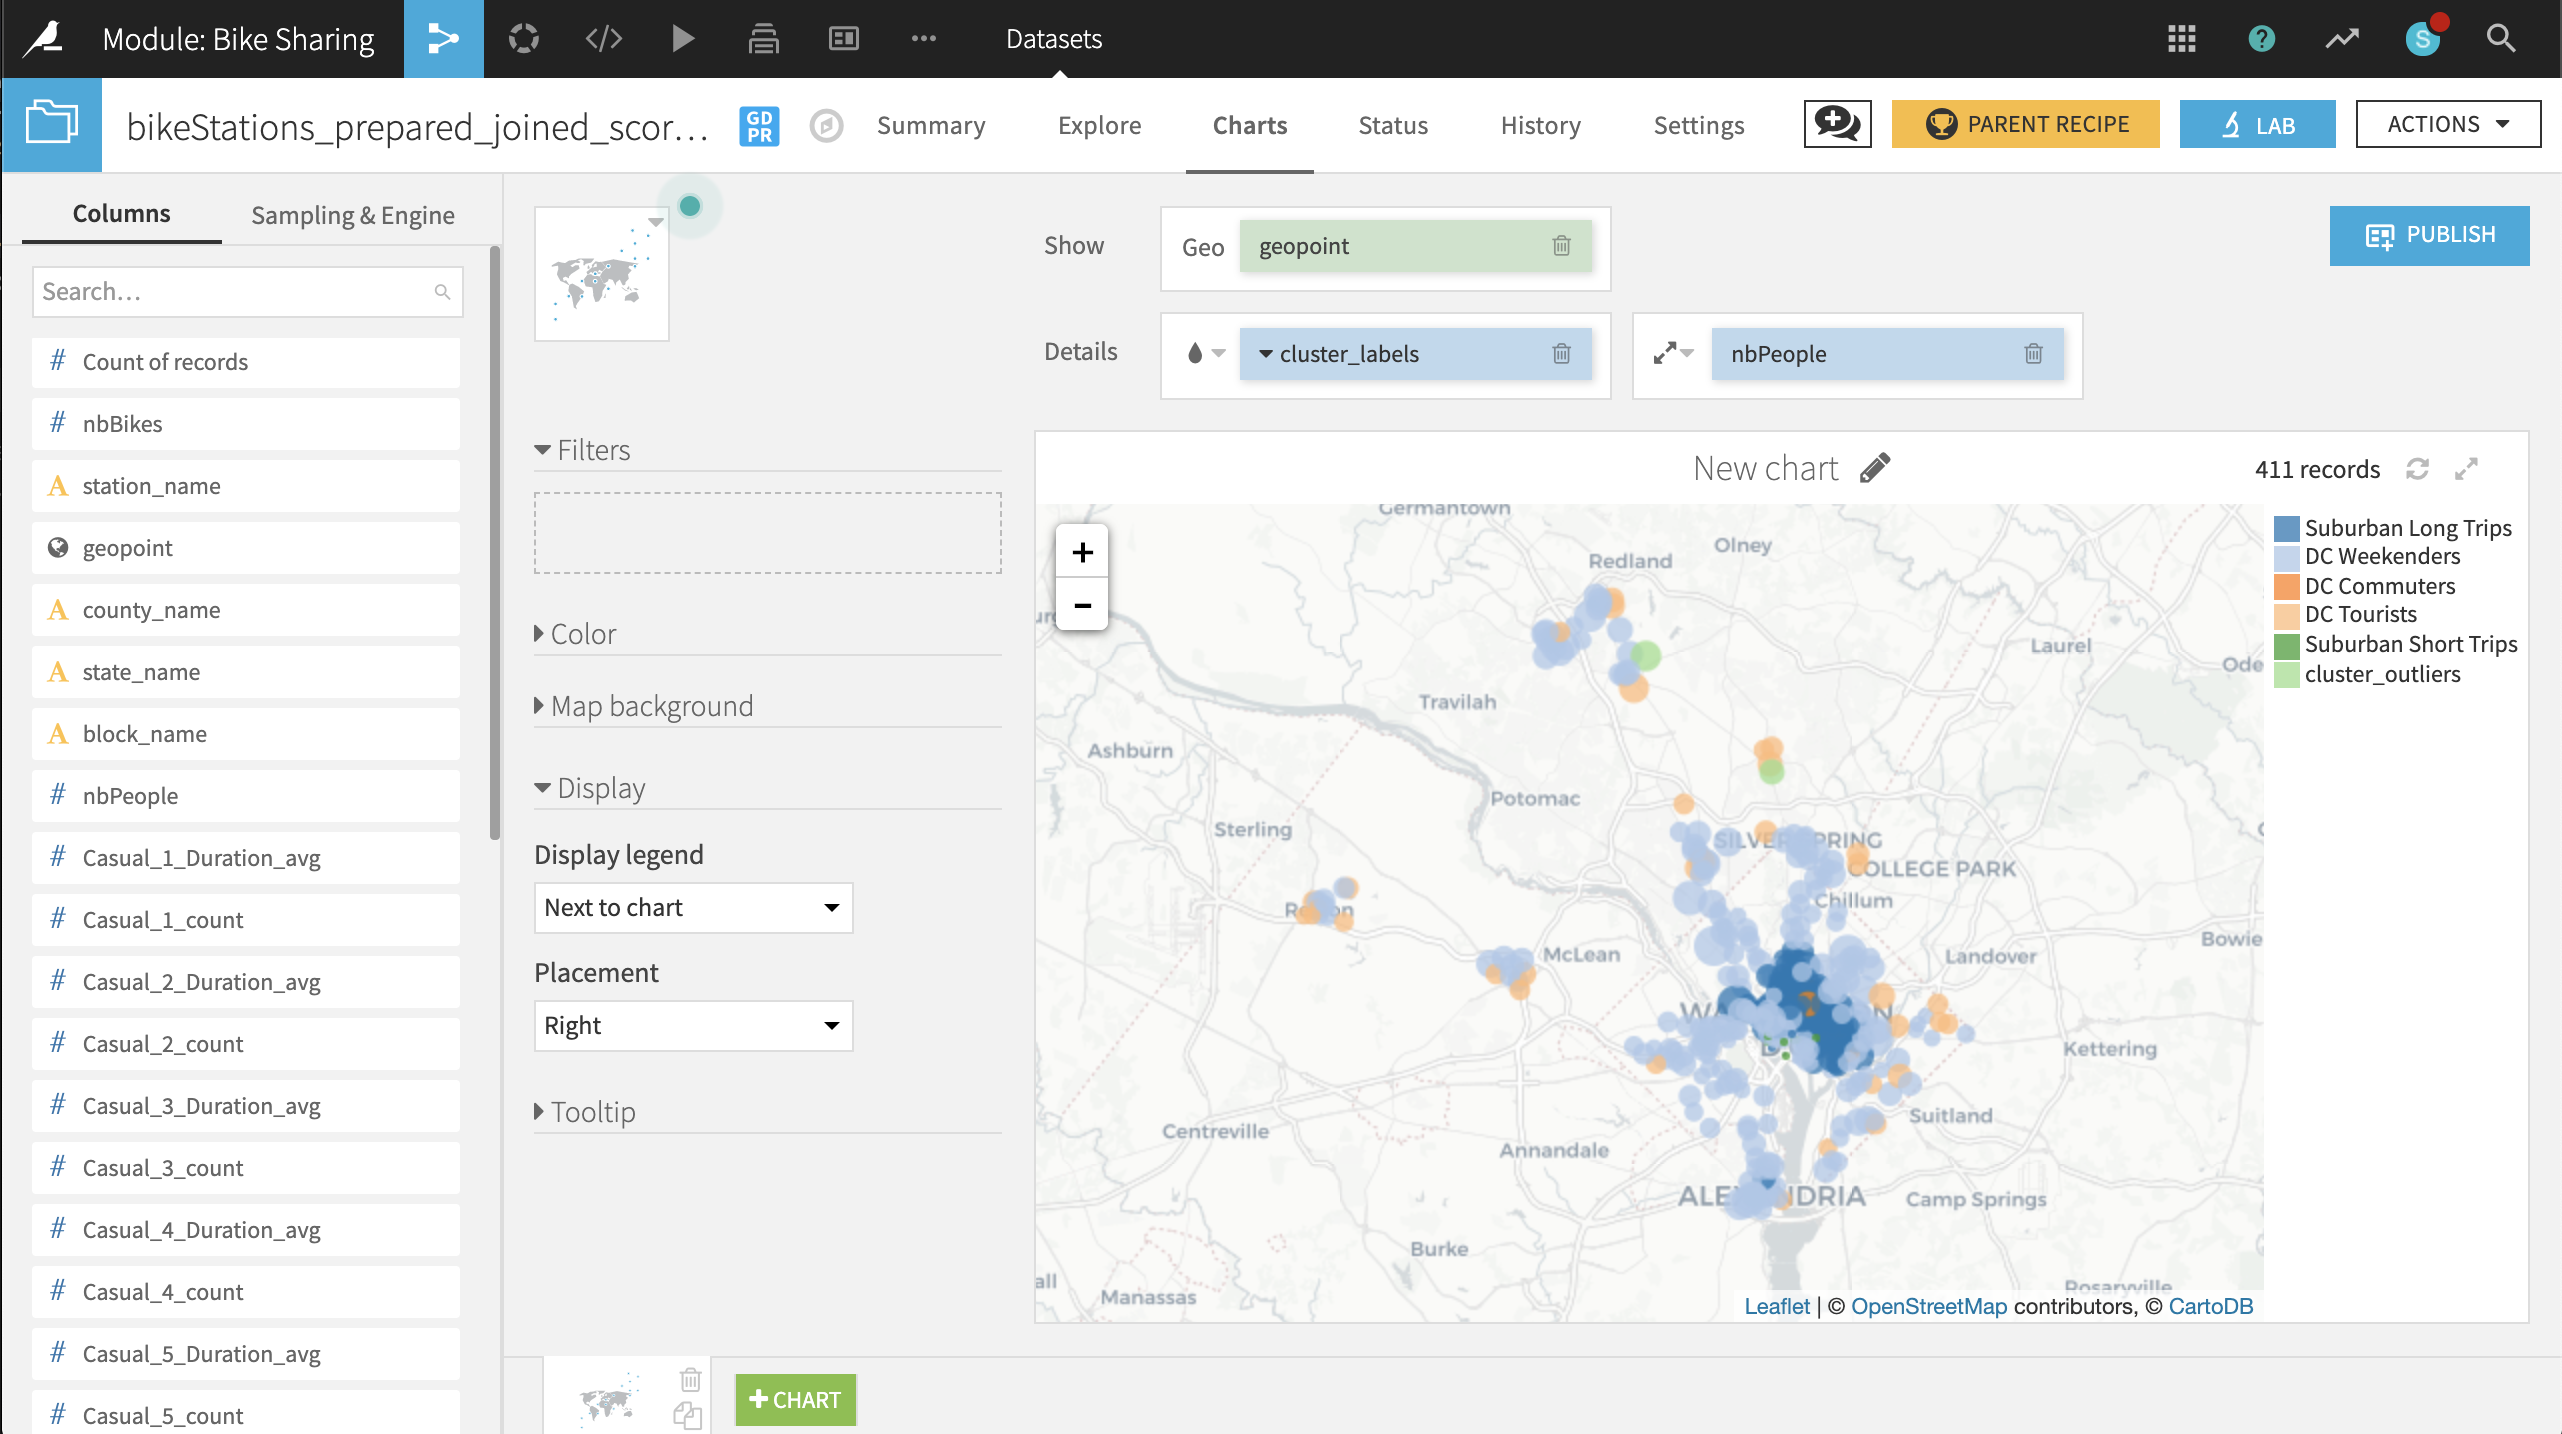
Rebuild the final scored dataset (a non-recursive build should be sufficient). Navigate to the map in the Charts tab to see what has changed.
Just eyeballing, it’s difficult to see any significant changes from 2016 to 2017. A couple of stations in the outlier cluster now appear in Maryland, far away from downtown DC. It is now your role to identify and understand any other changes. :-)