Preparing the Web Logs Data
Create a new UploadedFiles dataset from the web logs data (LogsDataiku.csv.gz) and name it LogsDataiku.
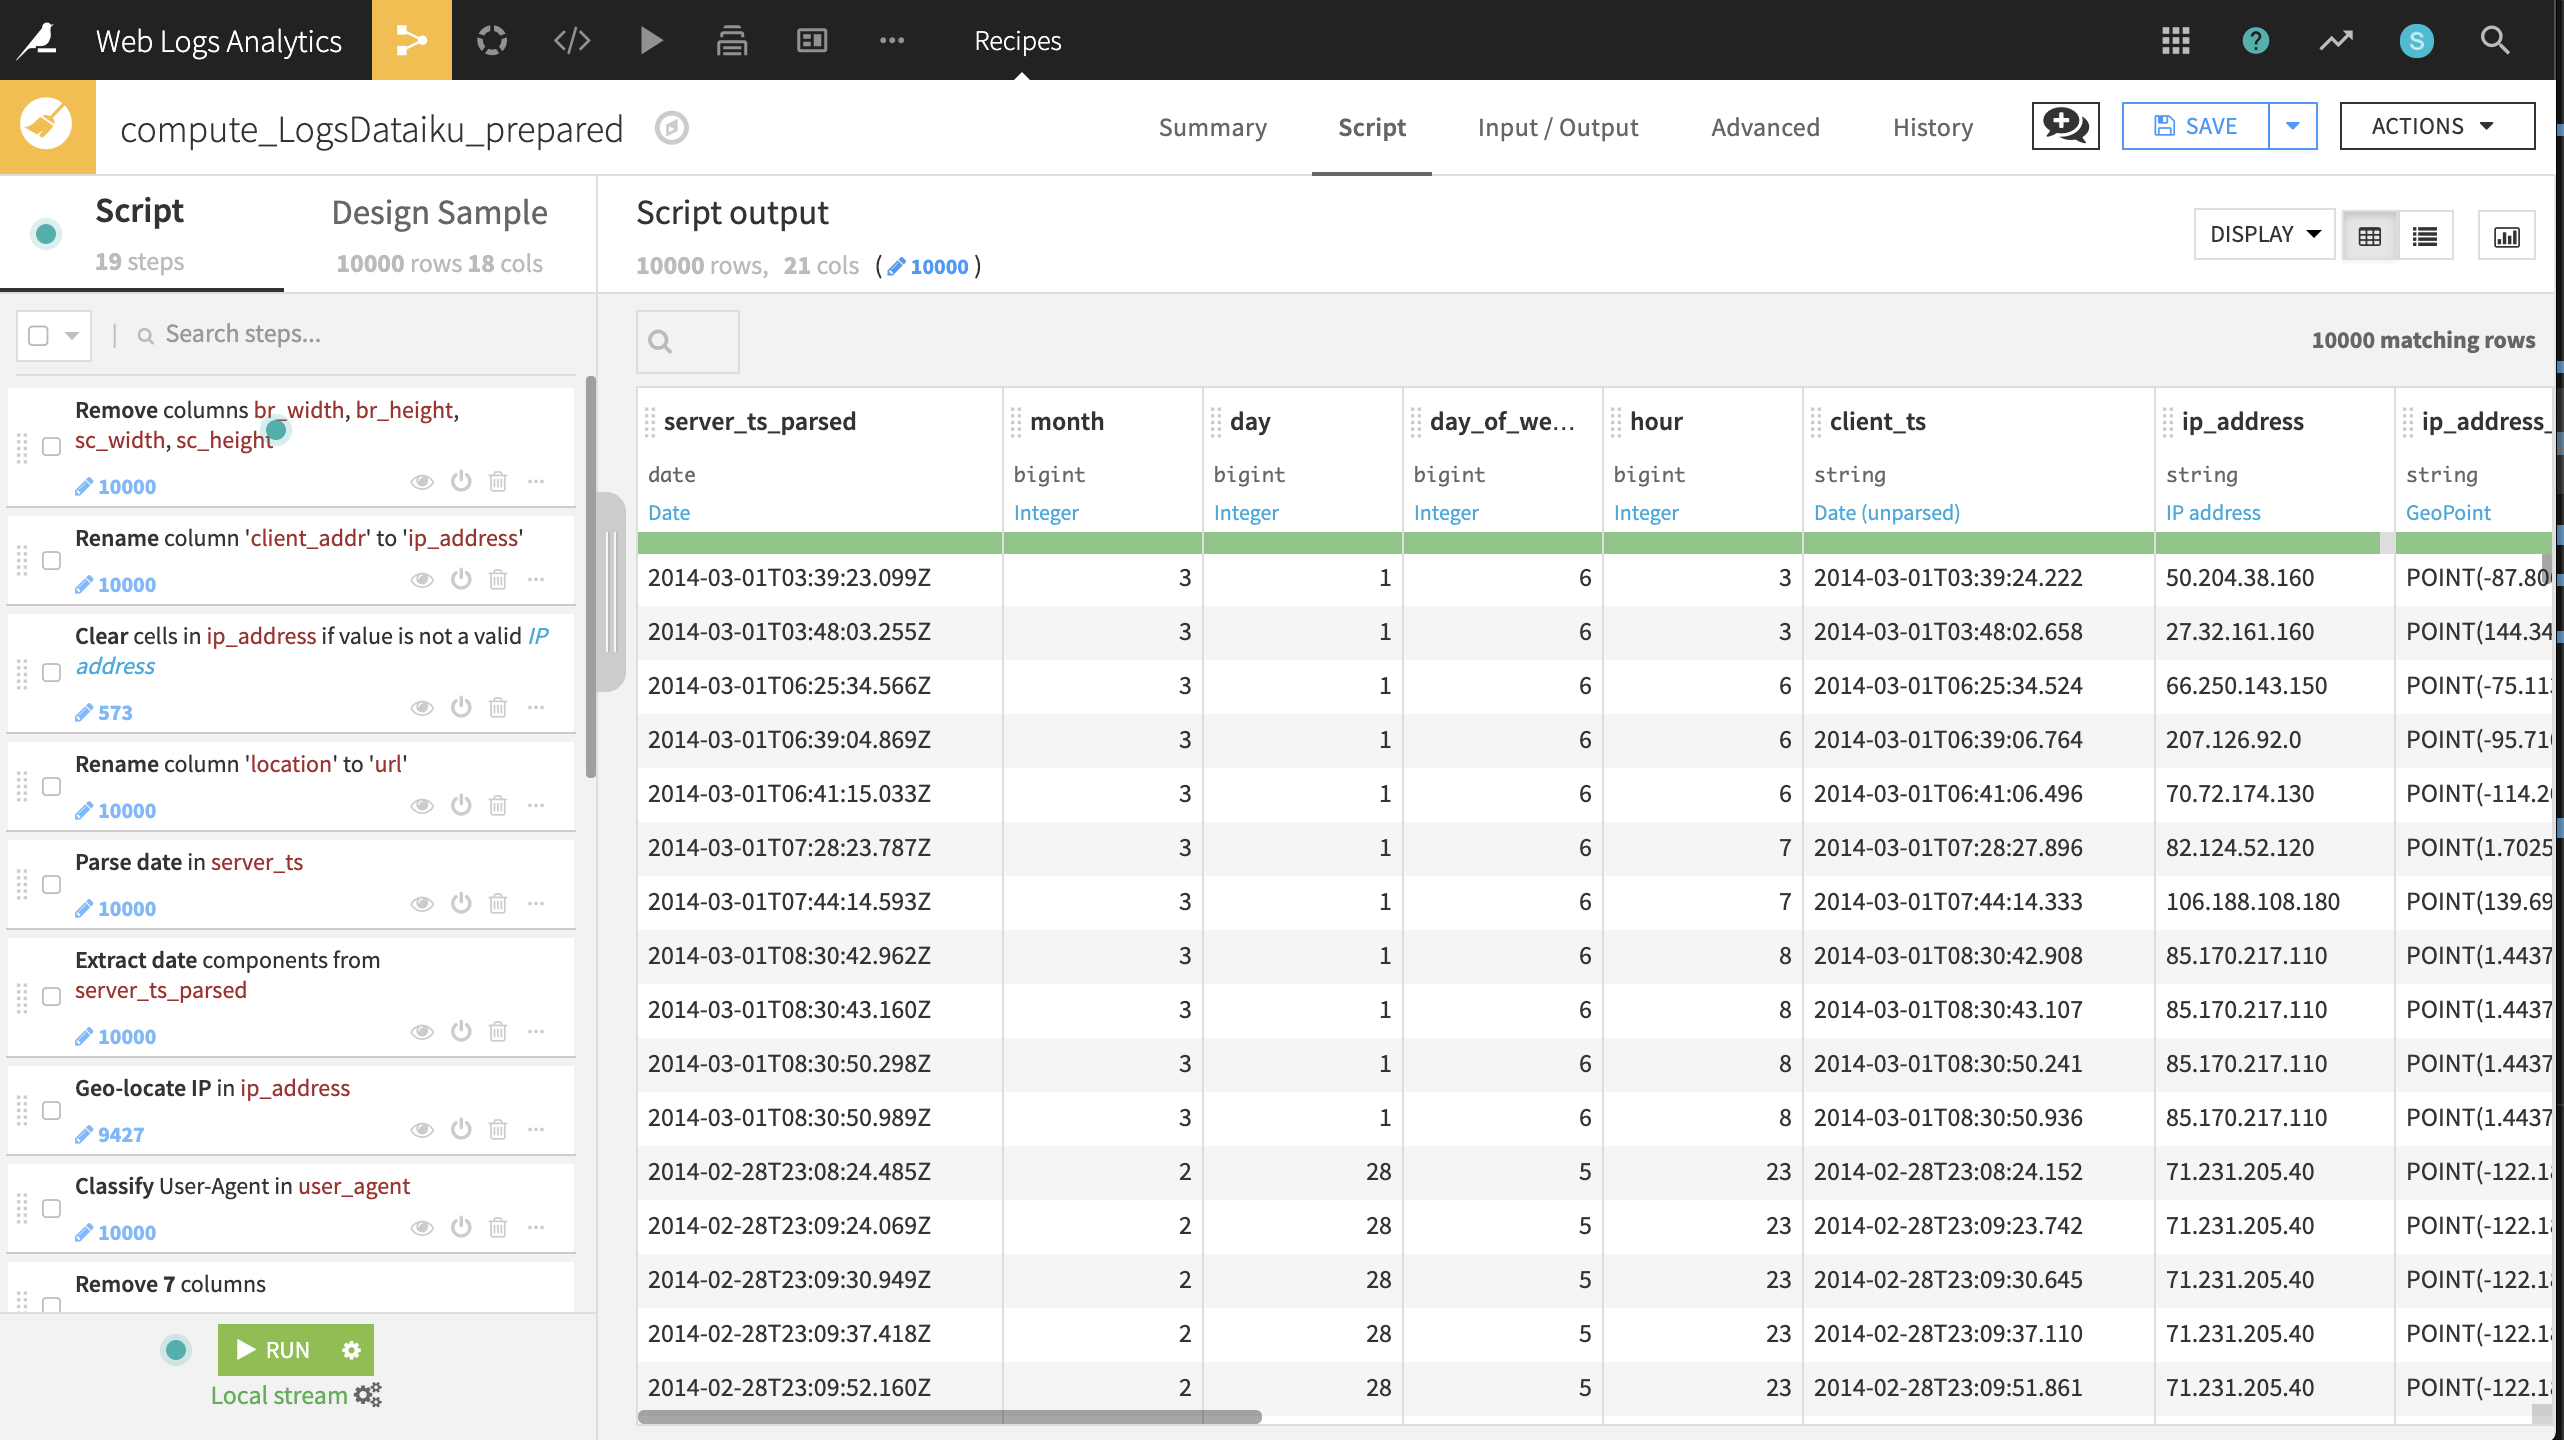
The dataset is already quite clean so the data preparation steps will focus mostly on enrichment and feature engineering. Create a Prepare recipe with LogsDataiku as the input and add the following steps to the script.
Hint
Clicking the down arrow to the right of the column header brings quick access to the most common data preparation steps for the column’s associated meaning. Many of the required steps below can be executed from this window.
Cleaning
Remove four columns: br_width, br_height, sc_width and sc_height
Rename the column client_addr to ip_address
Clear invalid cells in the ip_address column for the IP address meaning
Rename the column location to url
Feature engineering dates, locations, and user agents
Parse the server_ts column into a new Date column, server_ts_parsed, with format “yyyy-MM-dd’T’HH:mm:ss.SSS”
Extract four date components from server_ts_parsed: named month, day, day_of_week, and hour
Geo-locate the ip_address column, extracting the country, city and GeoPoint with the ip_address_ prefix
Classify, or enrich, the user_agent column
Remove user_agent and all of the enriched columns, with the exception of user_agent_type
Note
Note that parsing a date into the existing column will change the column’s meaning, but not its storage type. Parsing a date into a new column, on the other hand, changes both type and meaning. This will have consequences if you wish to perform mathematical operations on the column. For a more detailed guide on managing dates, please see the reference documentation.
Feature engineering the Dataiku URLs
Split URL in url, extracting only the path
Split url_path on
/and select Truncate so that it keeps only the first output column starting from the beginningFill empty cells of url_path_0 with
homeusing the “Fill empty cells with fixed value” processorCreate dummy columns from values of url_path_0 using the Unfold processor. This step creates new columns representing the section of the website the visitor was on with a “1”.
Remove the url_path and url_path_0 columns
Feature engineering the referrer URLs
Split URL in referer, extracting only the hostname
Use the Find and replace processor on referer_host, replacing
t.cowithtwitter.comand matching on the complete value of the stringIn the same column, replace
www.with an empty expression (i.e. no value), matching on substringOnce more for referer_host, replace
\..*with an empty expression, matching on regular expression. This step allows us to later put all traffic from the local Google domains under a single group.Reduce clutter by removing eight more columns: server_ts, referer, type, visitor_params, session_params, event_params, br_lang, and tz_off
Run all 19 steps of the recipe, updating the schema to 21 columns. We now have a clean, enriched dataset containing information about our website visits!
Charts for the Prepared Logs
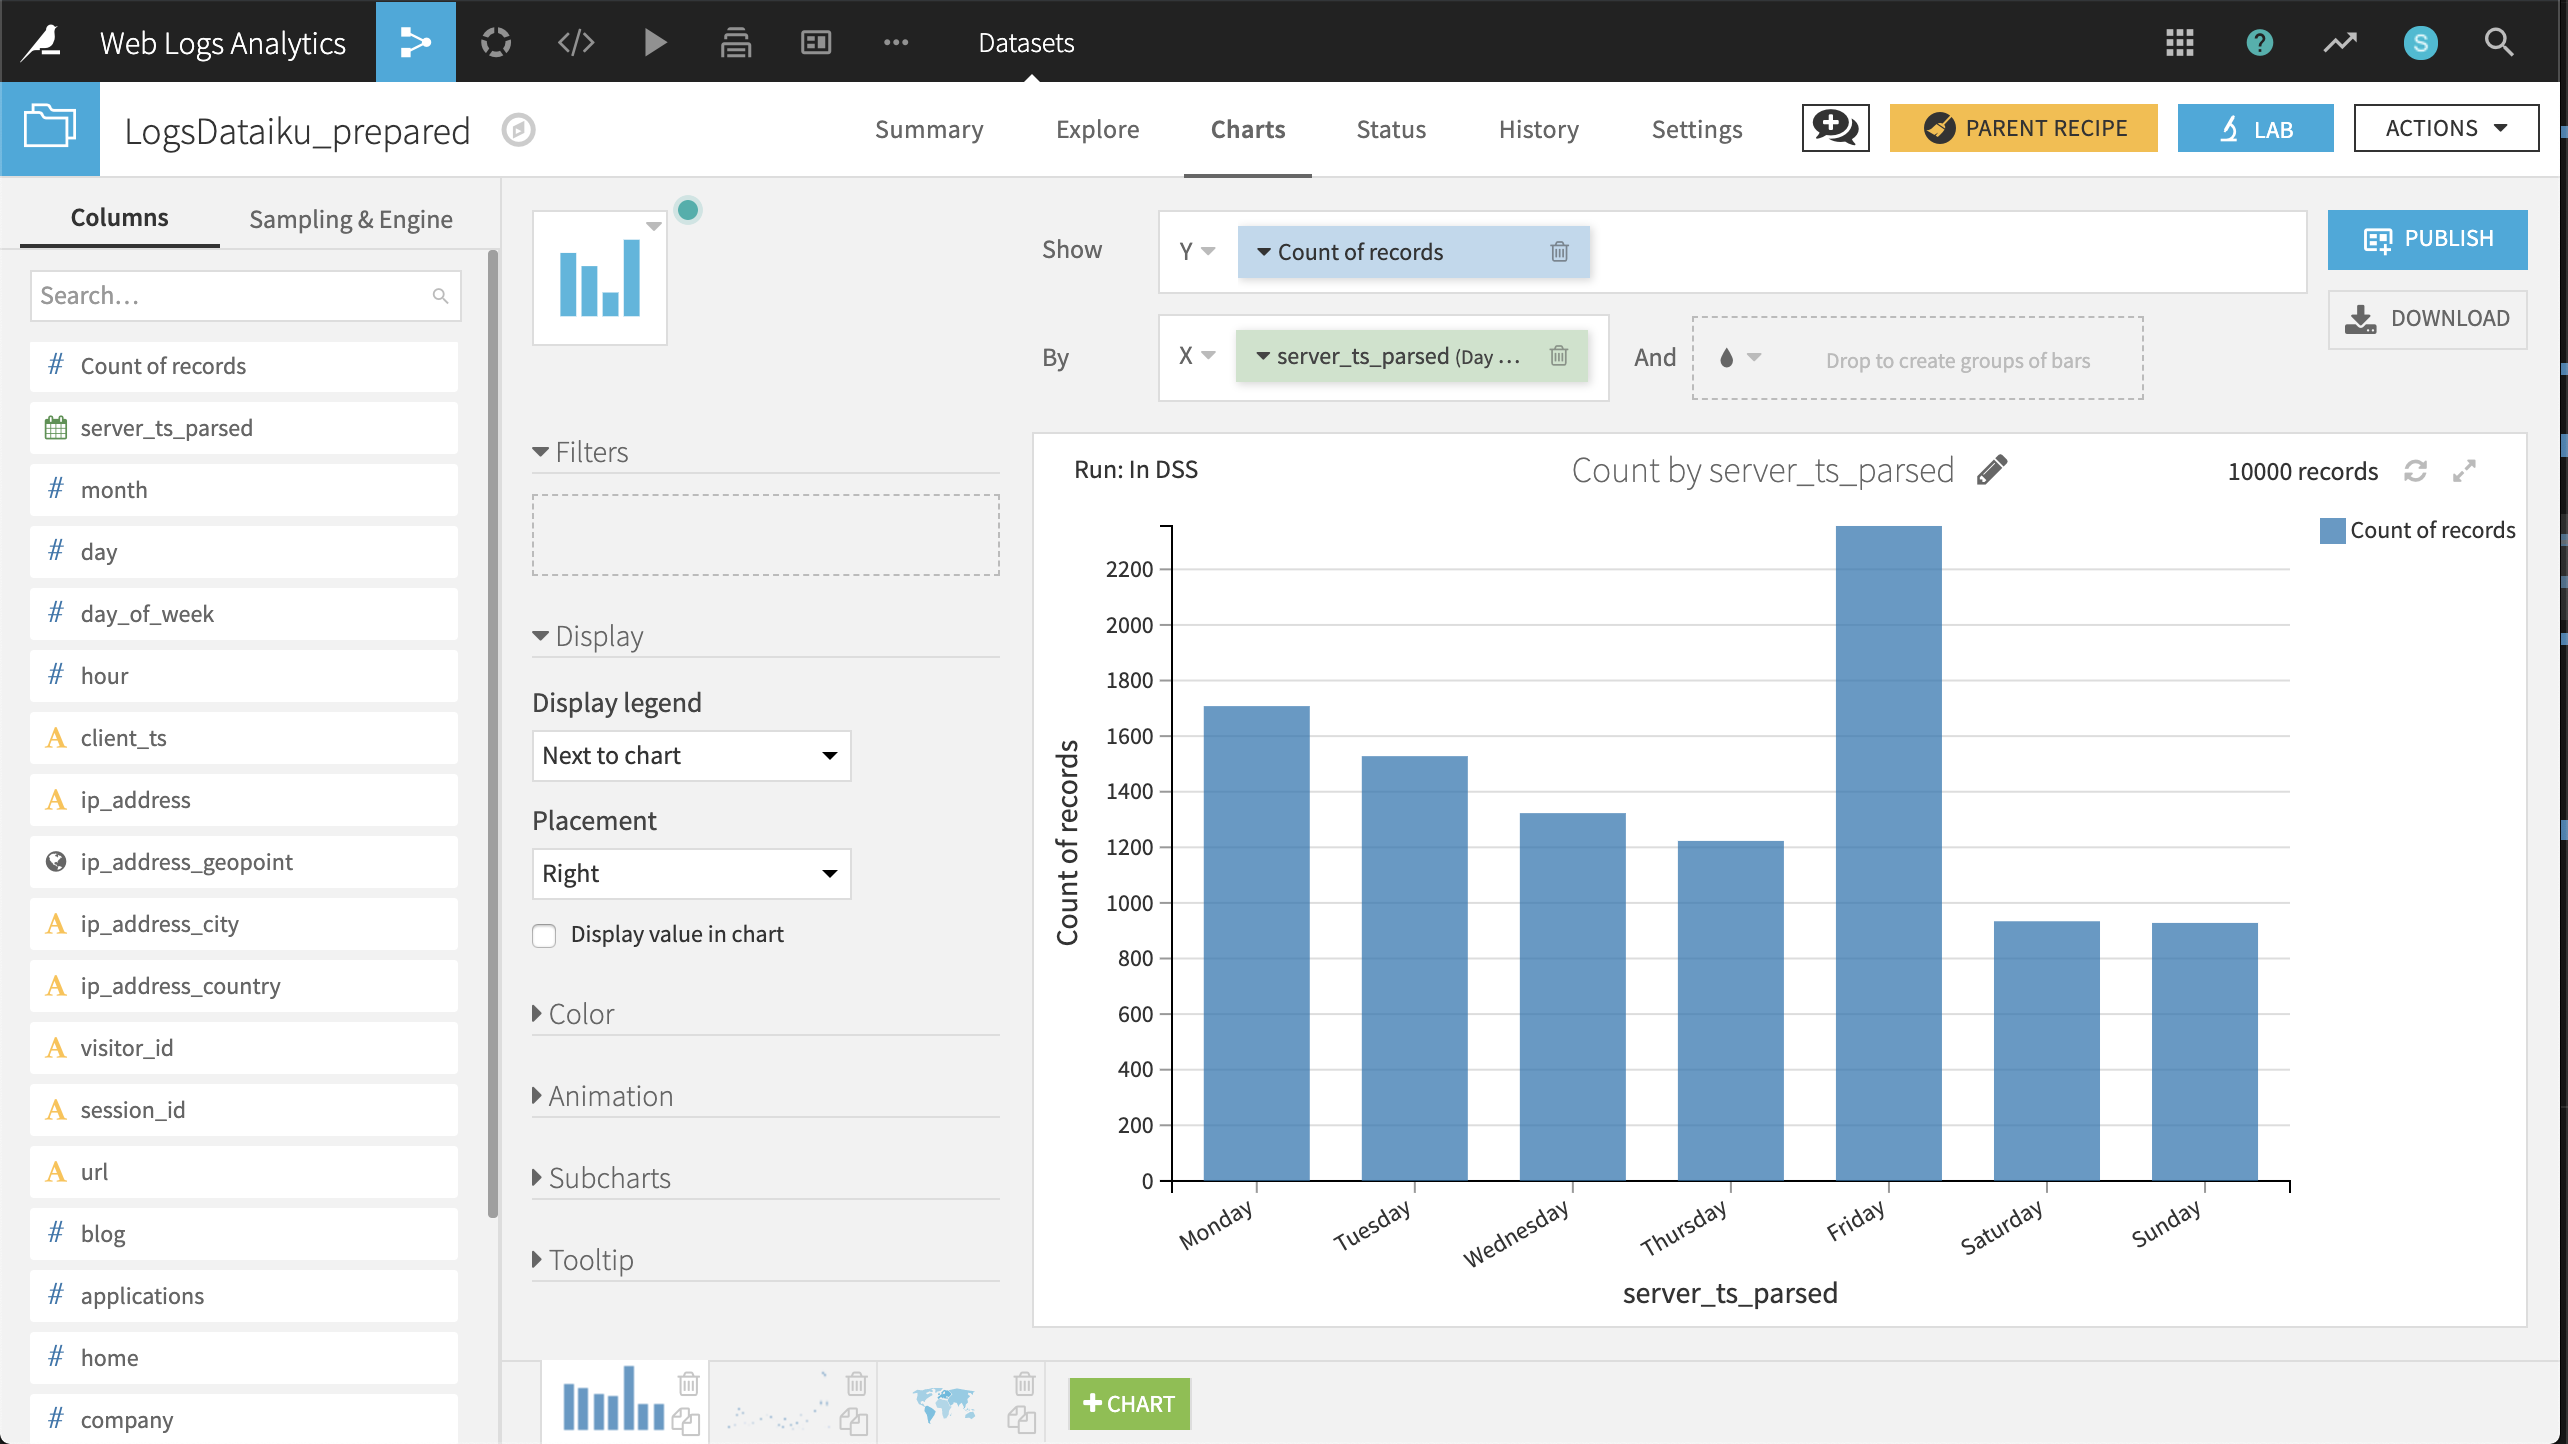
Now that our data has been cleaned and enriched, three charts can help guide our initial analysis. | - Distribution of visits by day of week.
Create a Histogram with Count of records on the Y-axis and server_ts_parsed on the X-axis, with “Day of week” as the date range.
The resulting chart shows that the number of visits is highest on Friday and Monday, lowest on the weekend, and visits steadily decline from Monday through Thursday before spiking on Friday.
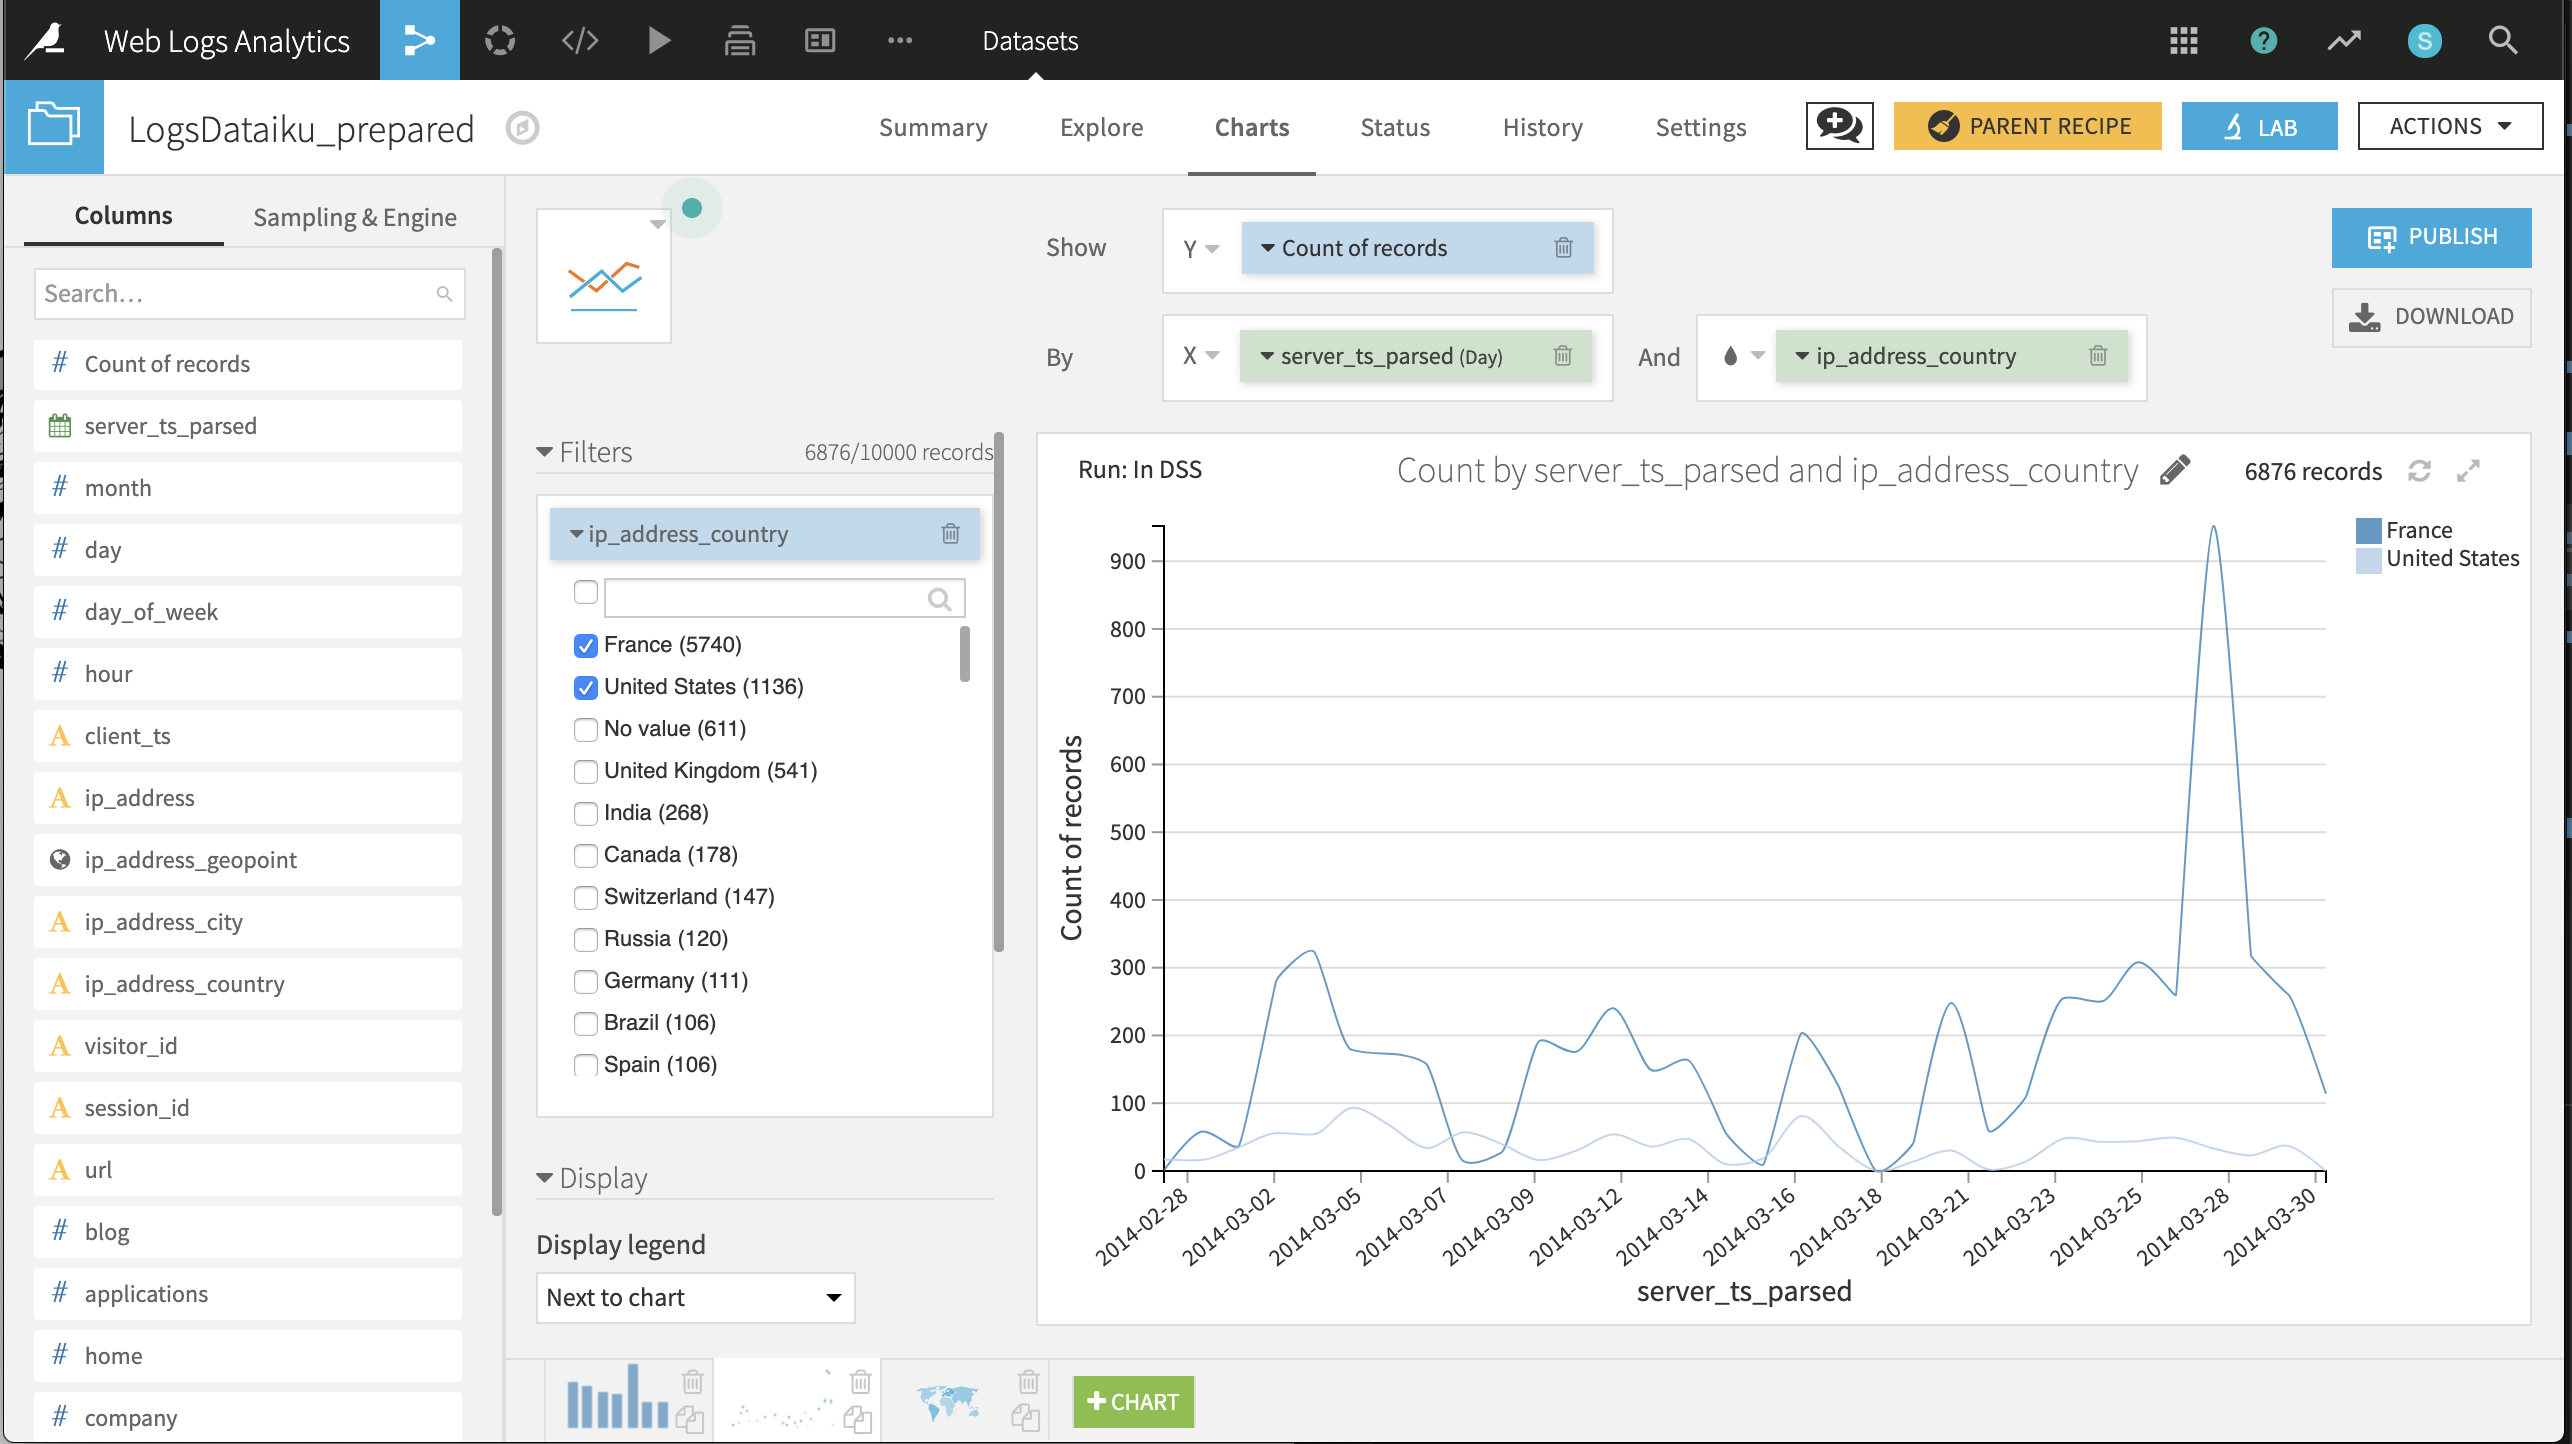
Daily timeline of visits from France and the US
Create a Lines chart with Count of records on the Y-axis and server_ts_parsed on the X-axis, with “Day” as the date range.
Drag ip_address_country to the “And” subgroup field; plus add a filter on ip_address_country with only France and the United States selected.
The resulting chart suggests that, during the available period, the number of visits on any given day is highly variable; visits from France tend to outnumber those from the US; and aside from a spike on 2014-03-28, the number of daily visits is under 400.
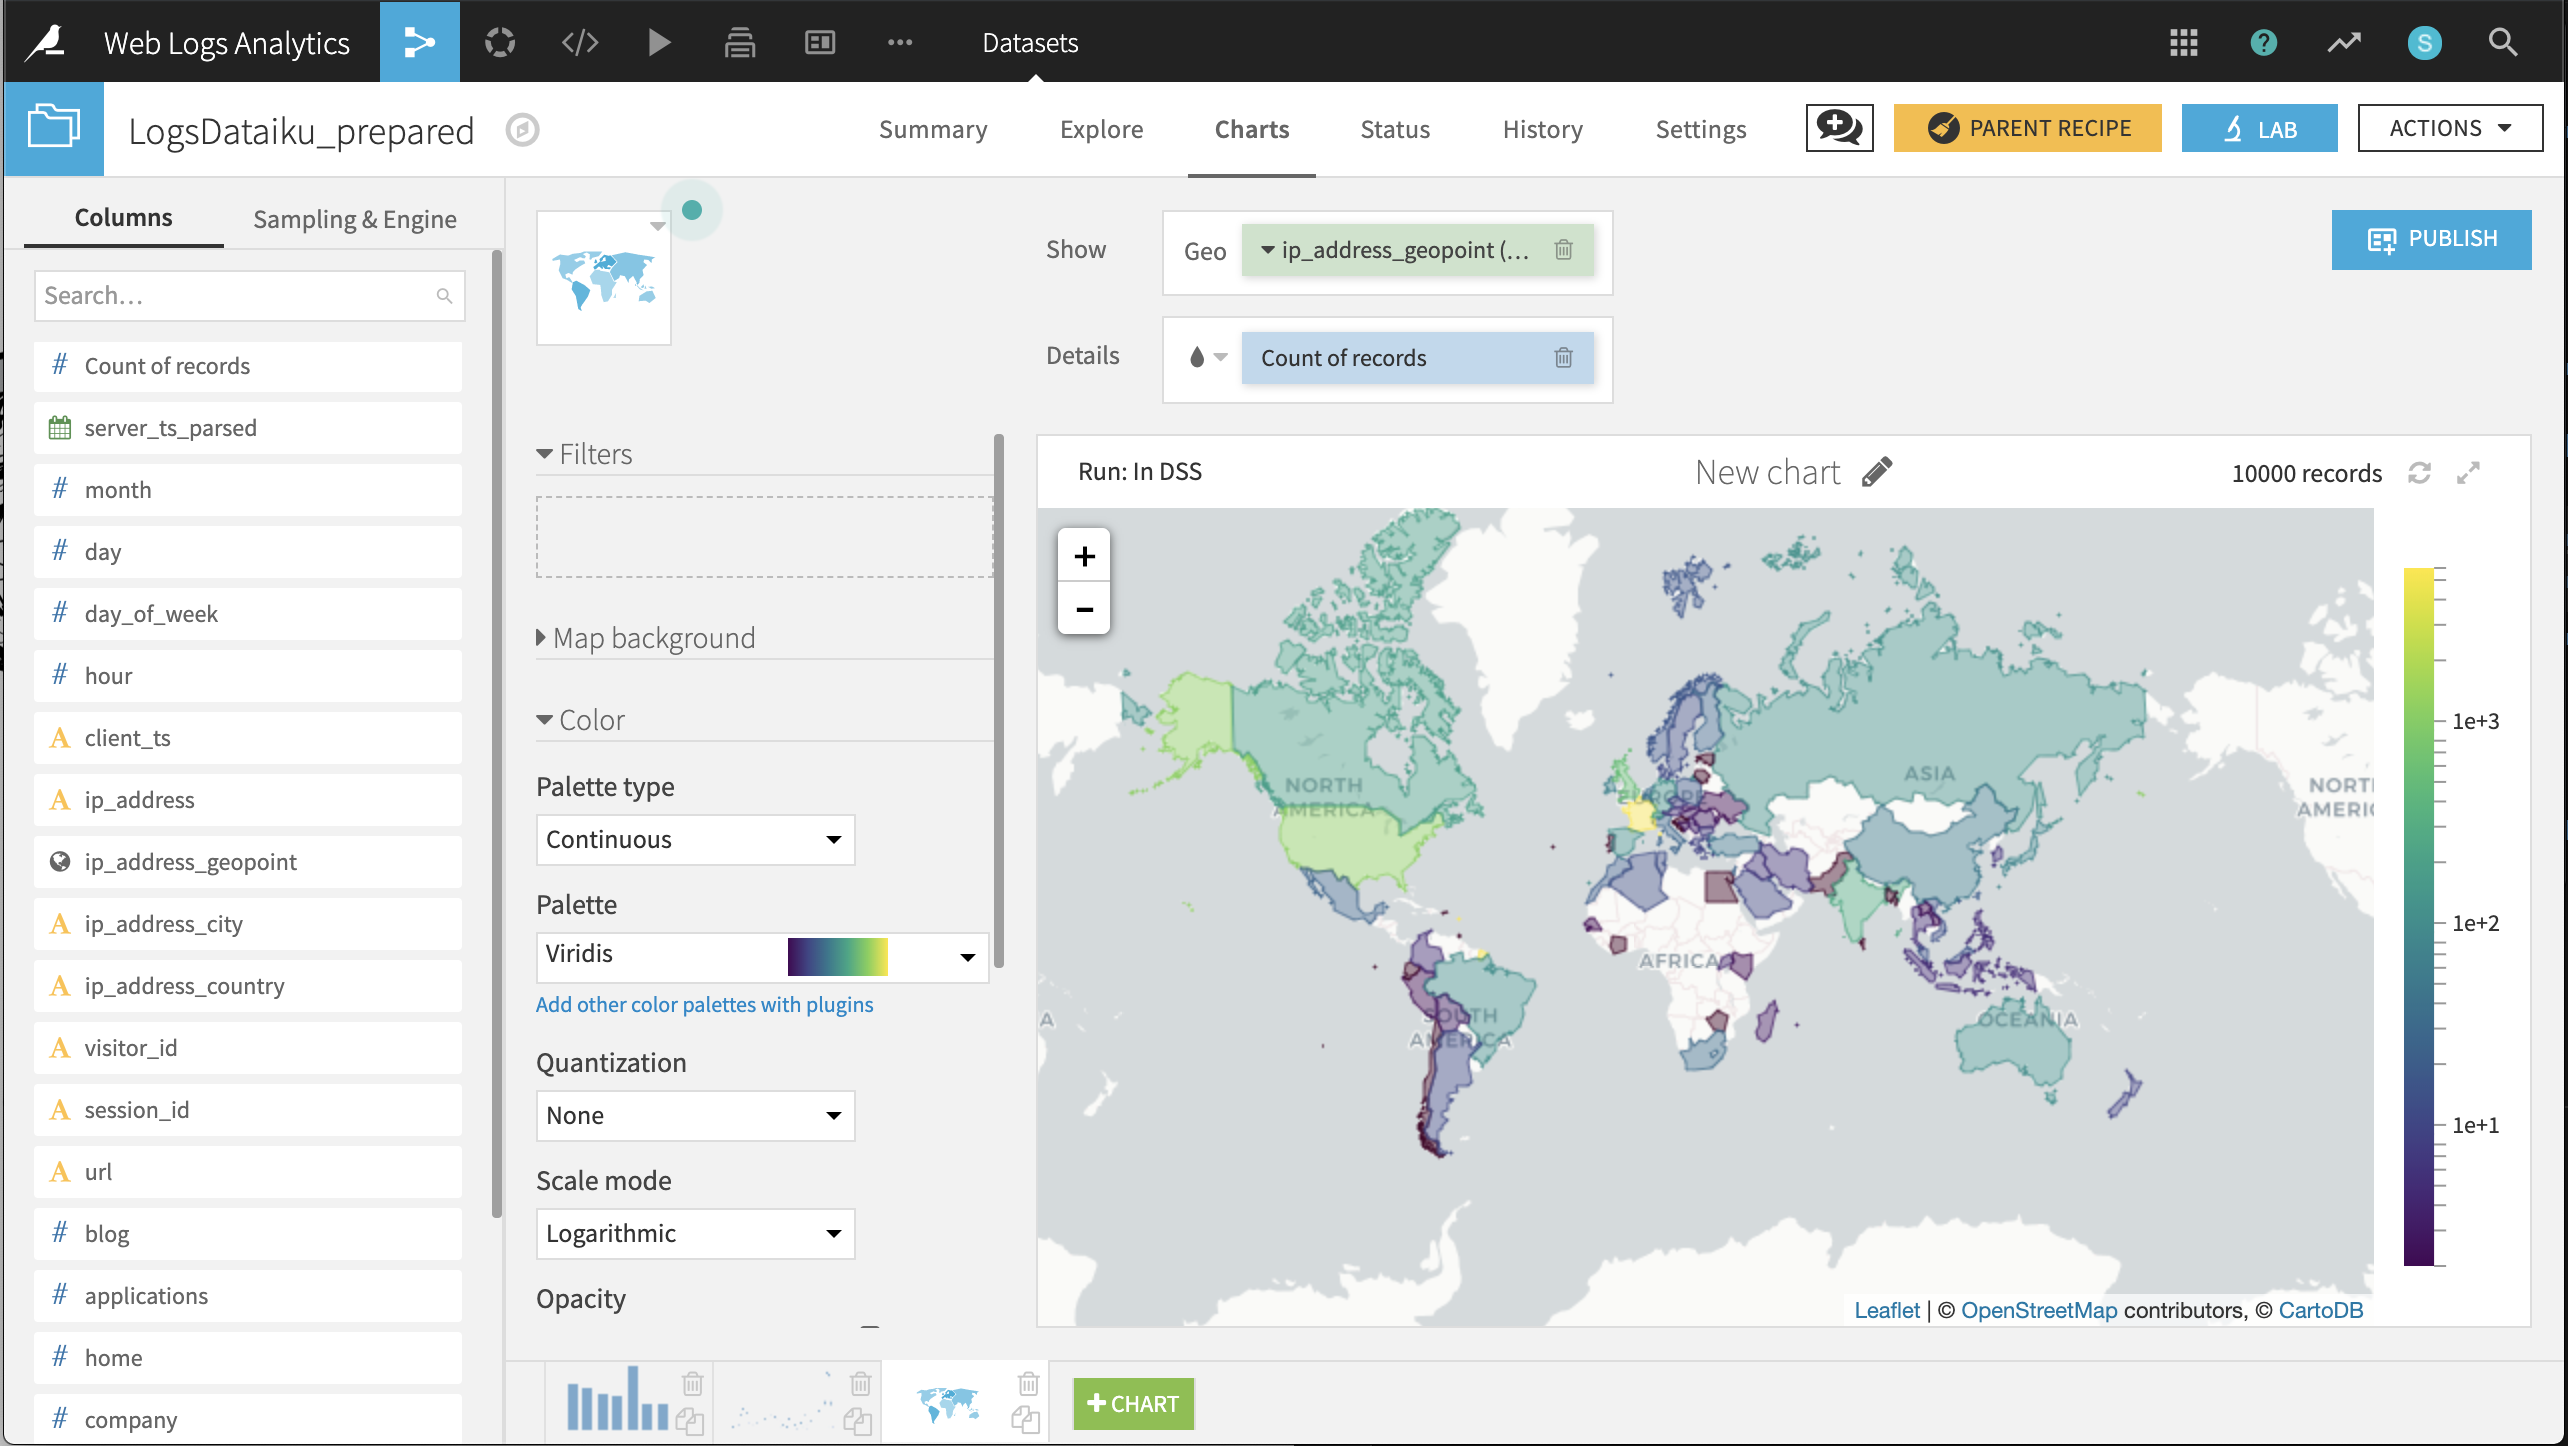
Choropleth of visits by country of origin
Create a Filled Administrative Map with ip_address_geopoint providing the geographic information and Count of records providing the color details.
Changing the selected color palette to a multi-color palette, such as Viridis, and the color scale mode to Logarithmic can help differentiate the countries.
The resulting chart shows that after France and the United States, the most visitors come from the United Kingdom, India, and Canada.