Referrer Analysis
We want to identify the top referrers to the Dataiku website in terms of volume (i.e. number of pageviews and distinct visitors), as well as their level of engagement (i.e. number of distinct Dataiku URLs). In order to achieve this, we need to group the dataset by unique values within the referer_host column.
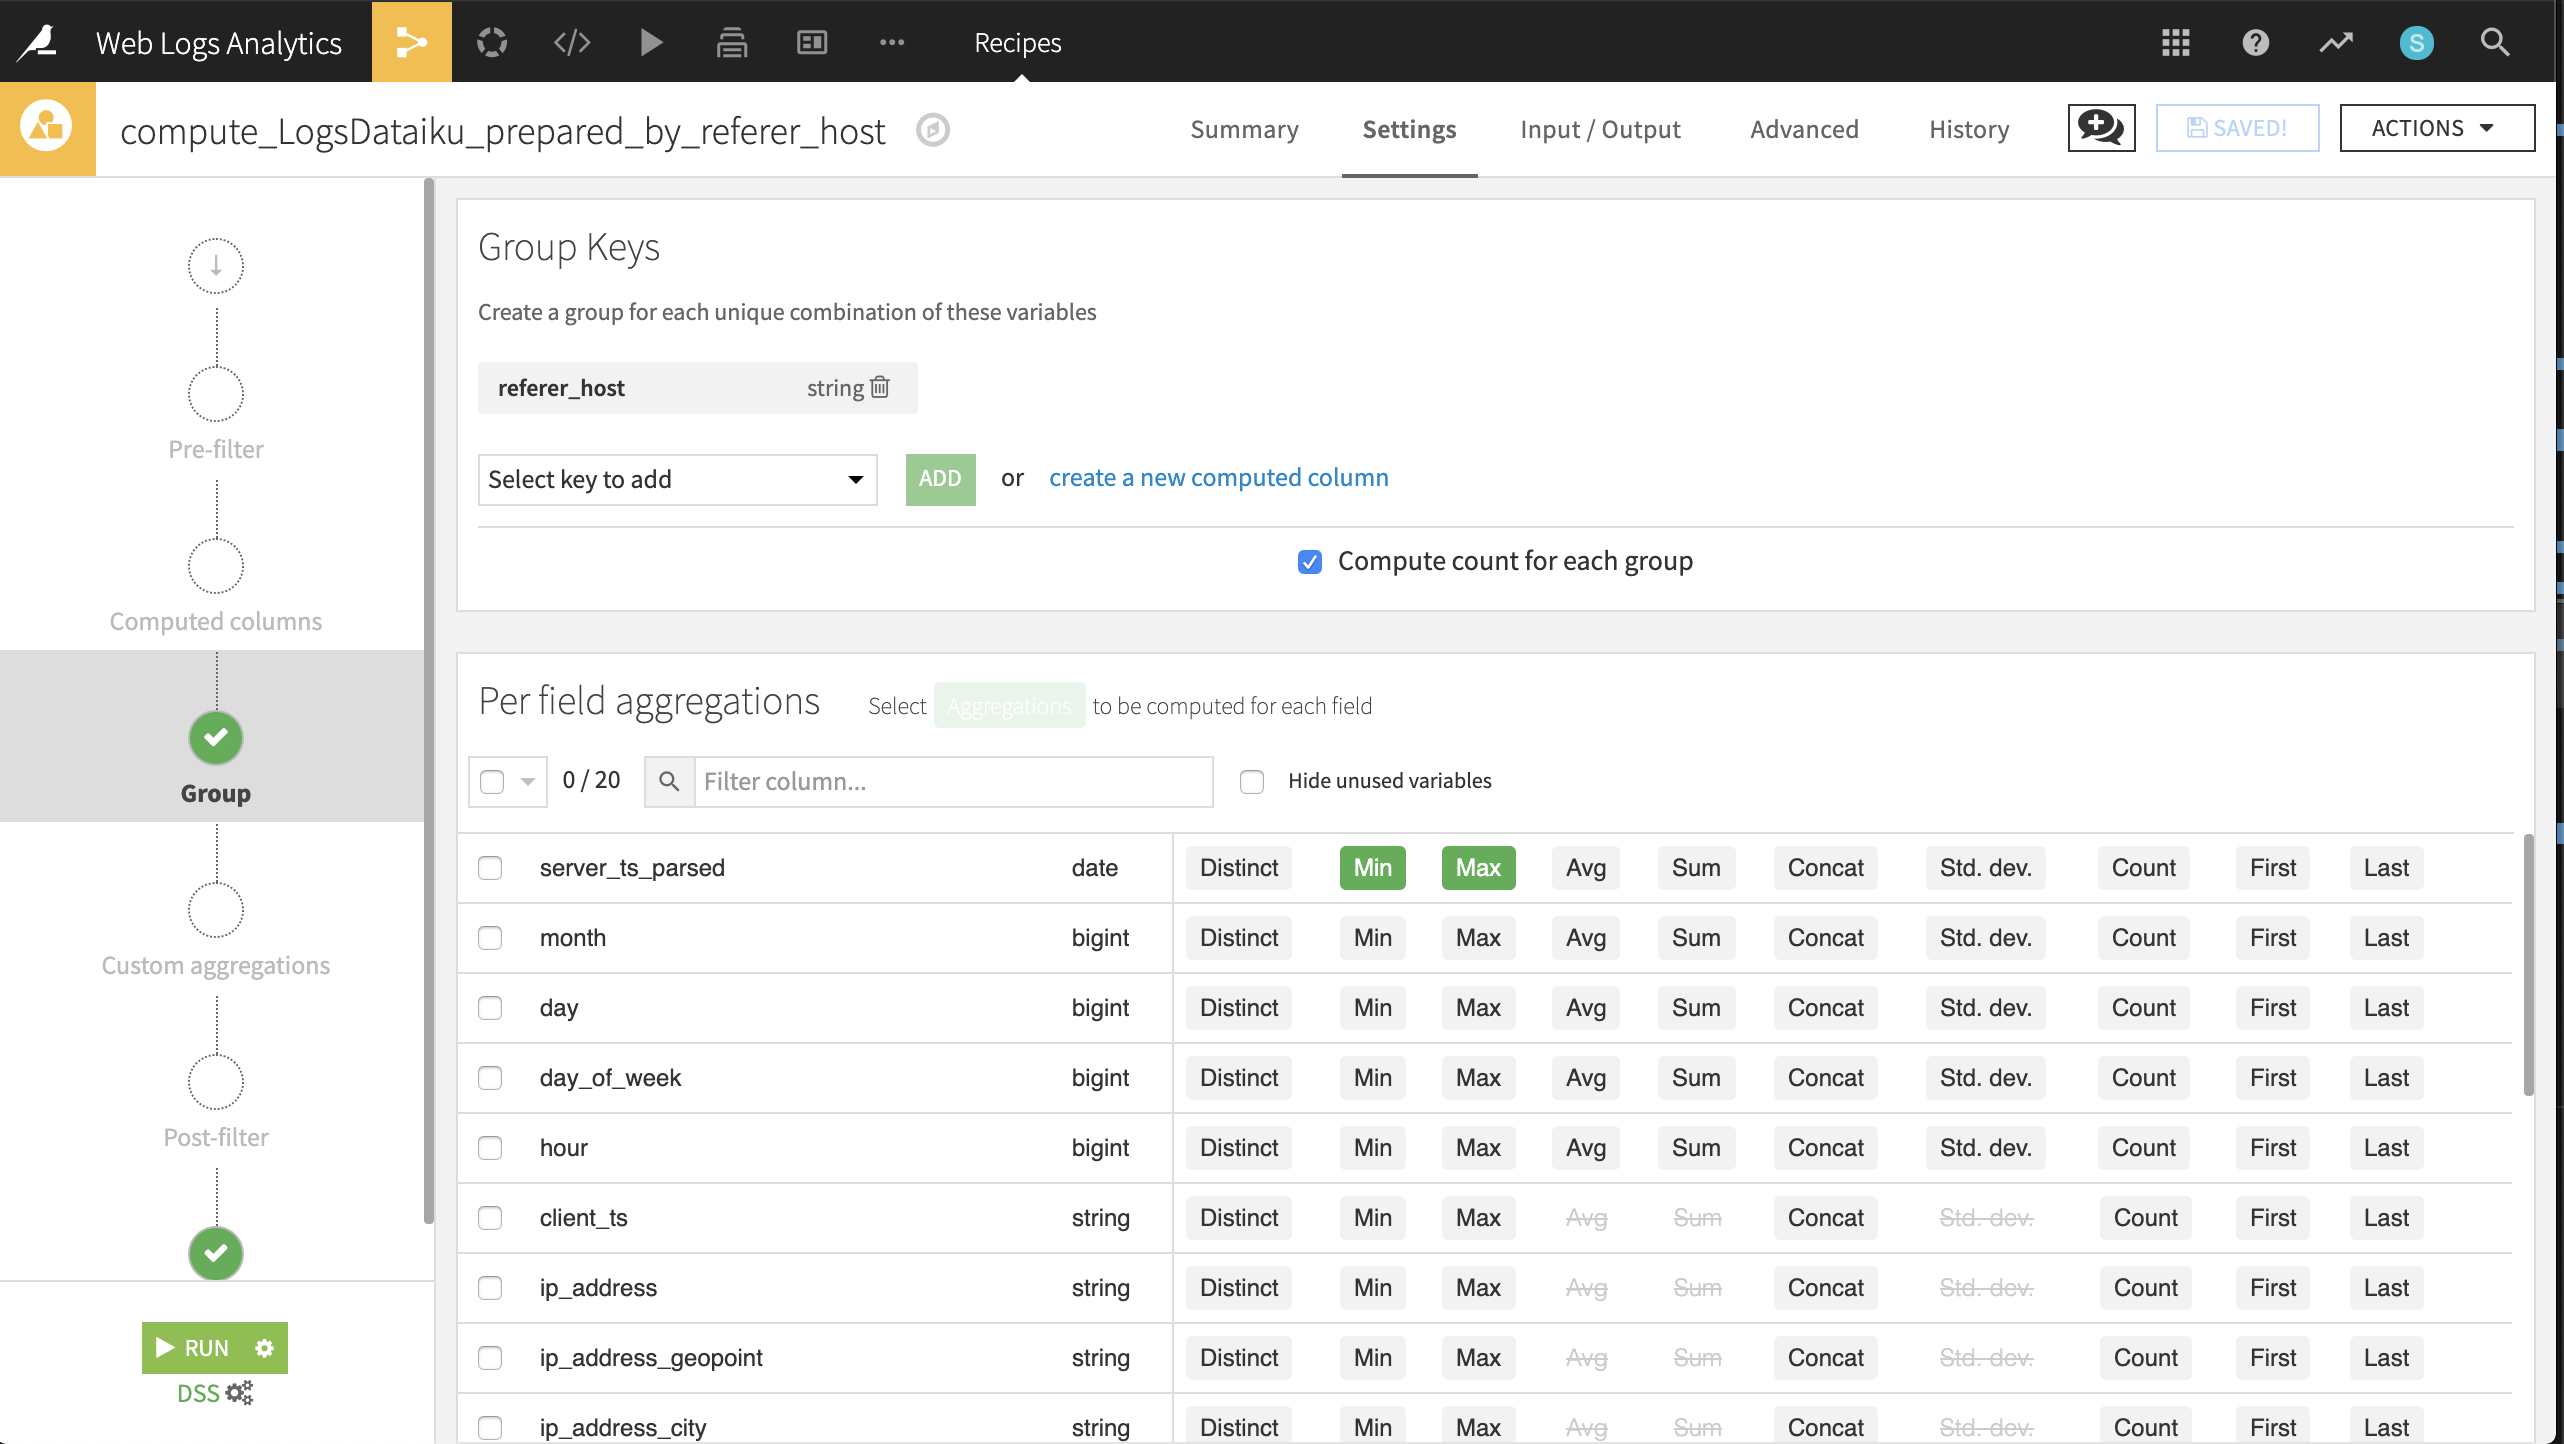
From the LogsDataiku_prepared dataset, create a new Group recipe with referer_host as the column to group by. Keep the default output name
LogsDataiku_prepared_by_referer_host.At the Group step, keep Compute count for each group selected and add the following per-field aggregations:
For server_ts_parsed: Min, Max
For visitor_id and url: Distinct
Run the recipe, updating the schema to six columns.
In the output dataset, click on the Charts tab and create the following visualizations described below. Later, we could publish these charts to a dashboard.
Pageviews, distinct visitors and distinct URLs per referrer.
Create a pivot table by dragging referer_host to the rows and count, visitor_id_distinct, and url_distinct as contents.
referer_host should be sorted by descending order of count.
Keep the AVG aggregation for all of the contents.
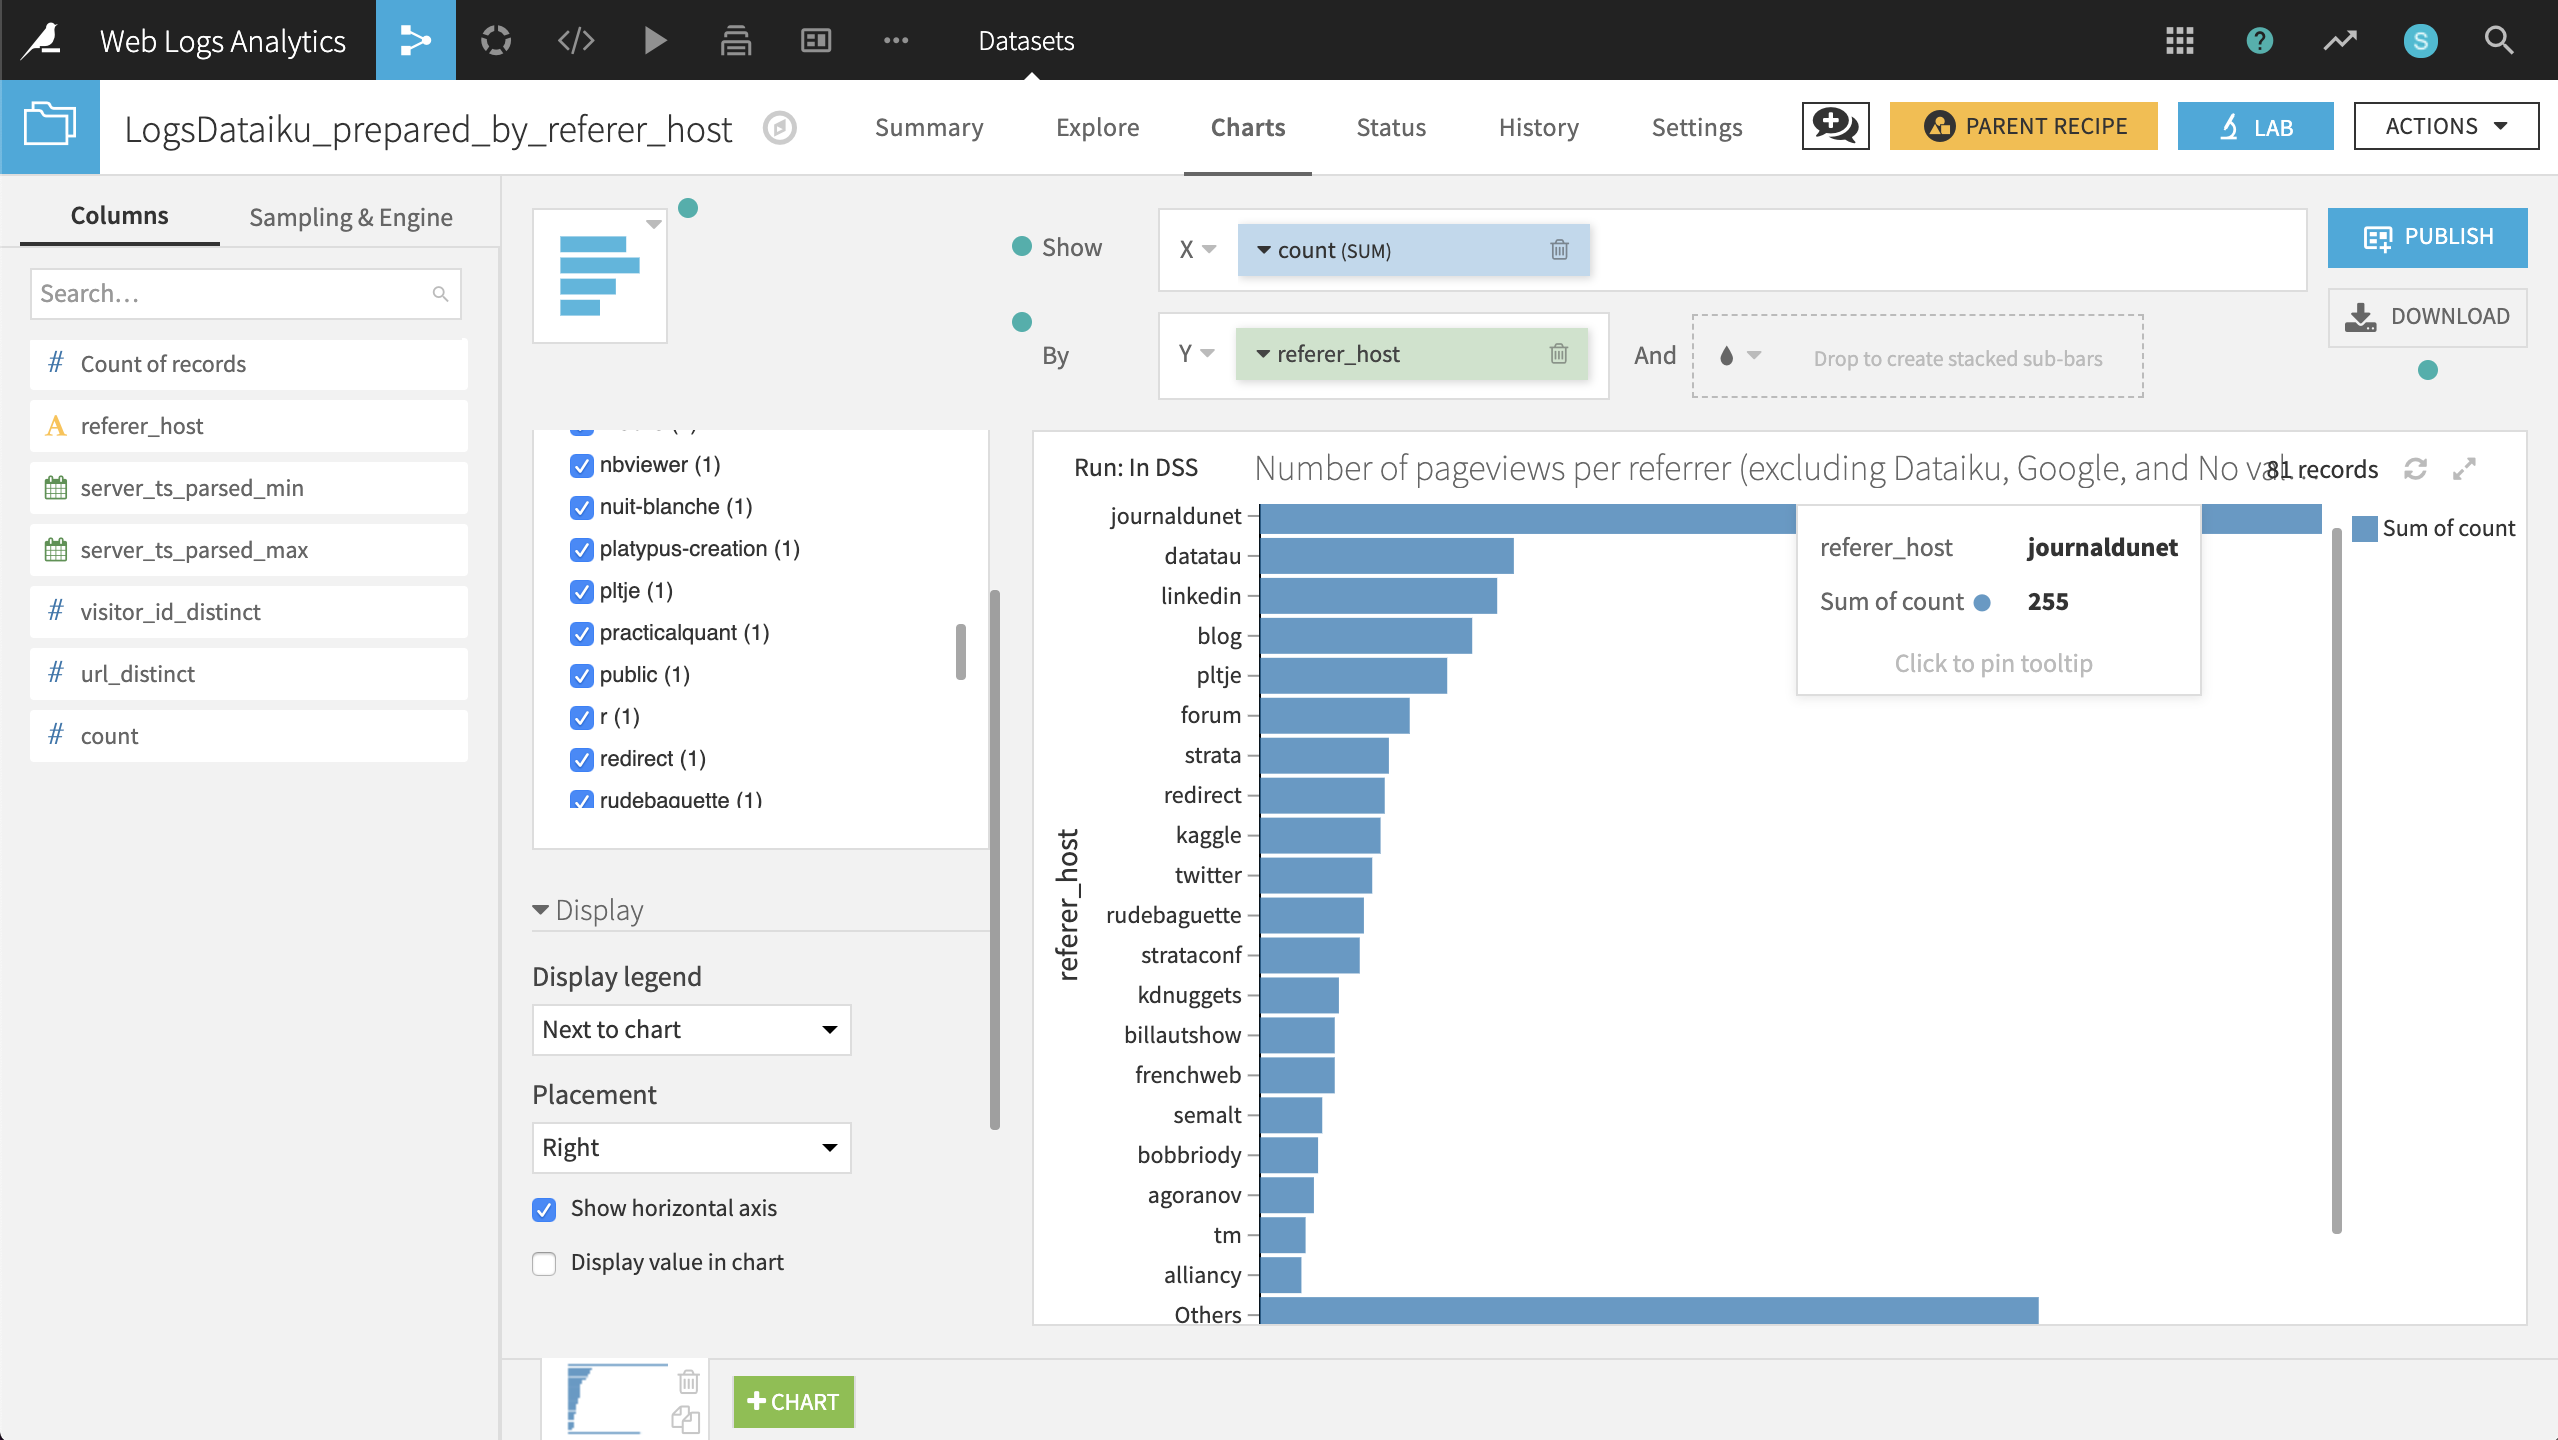
Number of pageviews per referrer (excluding Dataiku, Google, and No value).
Create a bar chart with count on the X-axis and referer_host on the Y-axis.
count should have the SUM aggregation, and referer_host should be sorted by descending sum of count.
Add referer_host host as a filter, excluding dataiku, google, and No value. Under the Display menu, check the box Show horizontal axis.
The resulting chart shows that “journaldunet” is the largest single referrer by a wide margin.