Build Machine Learning Models
Having explored and prepared the training data, now let’s start building machine learning models.
Note
Dataiku DSS contains a powerful automated machine learning engine that allows you to create highly optimized models with minimal user intervention.
At the same time, you retain full control over all aspects of a model’s design, such as which algorithms to test or which metrics to optimize. A high level of customization can be accomplished with the visual interface or expanded even further with code.
Train a Model
In order to train a model, you need to enter the Lab.
Note
The Lab is the place in Dataiku DSS optimized for experimentation and discovery. Keeping experimentation (such as model training) in the Lab helps avoid overcrowding the Flow with unnecessary items that may not be used in production.
From the Flow, select the training_data_prepared dataset.
From the Actions sidebar, click on the Lab.
Under “Visual analysis”, choose AutoML Prediction.
Select churn as the feature on which to create the prediction model.
Leave the “Quick Prototypes” setting and the default name, and click Create.
Without reviewing the design, click Train to start building models.

Inspect a Model
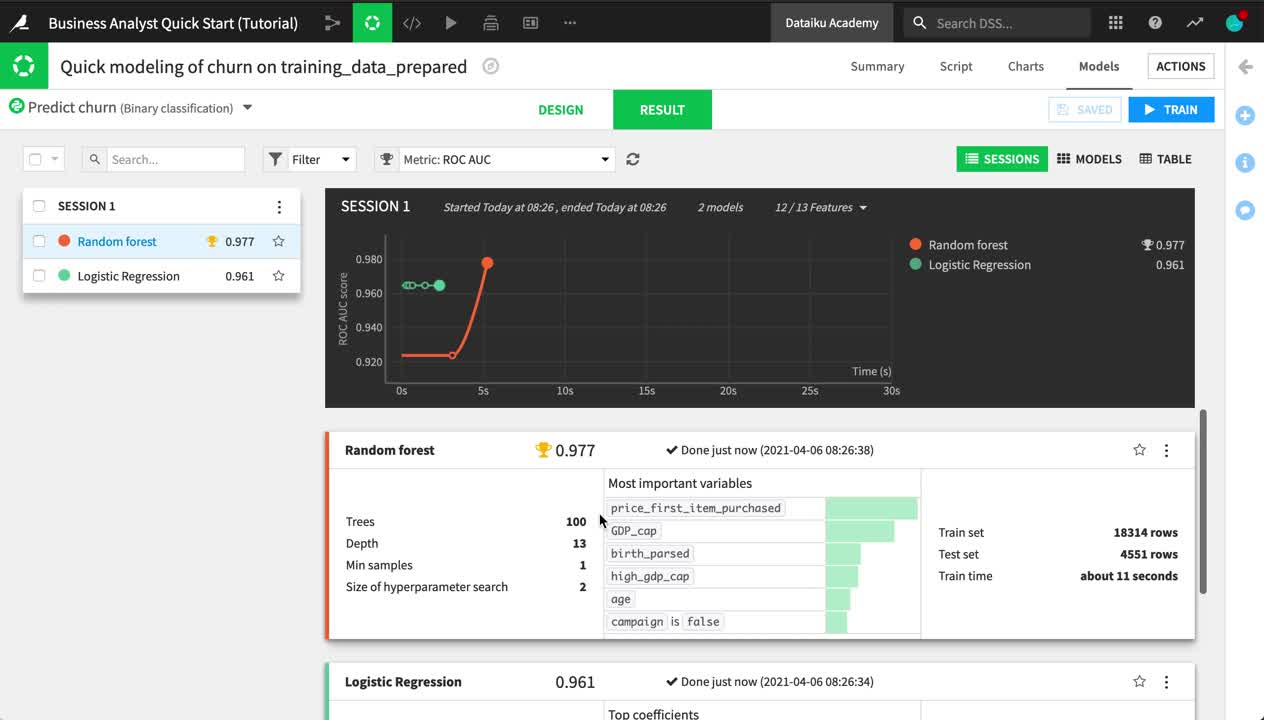
You have full transparency into how the random forest and logistic regression models were produced in the Design tab, as well as a number of tools to understand their interpretation and performance in the Result tab.
Let’s explore the results of the initial model training session.
From the Result tab of the visual analysis “Quick modeling of churn on training_data_prepared”, see the two results in Session 1 on the left side of the screen.
Click Random forest, which happened to be the highest-performing model in this case.
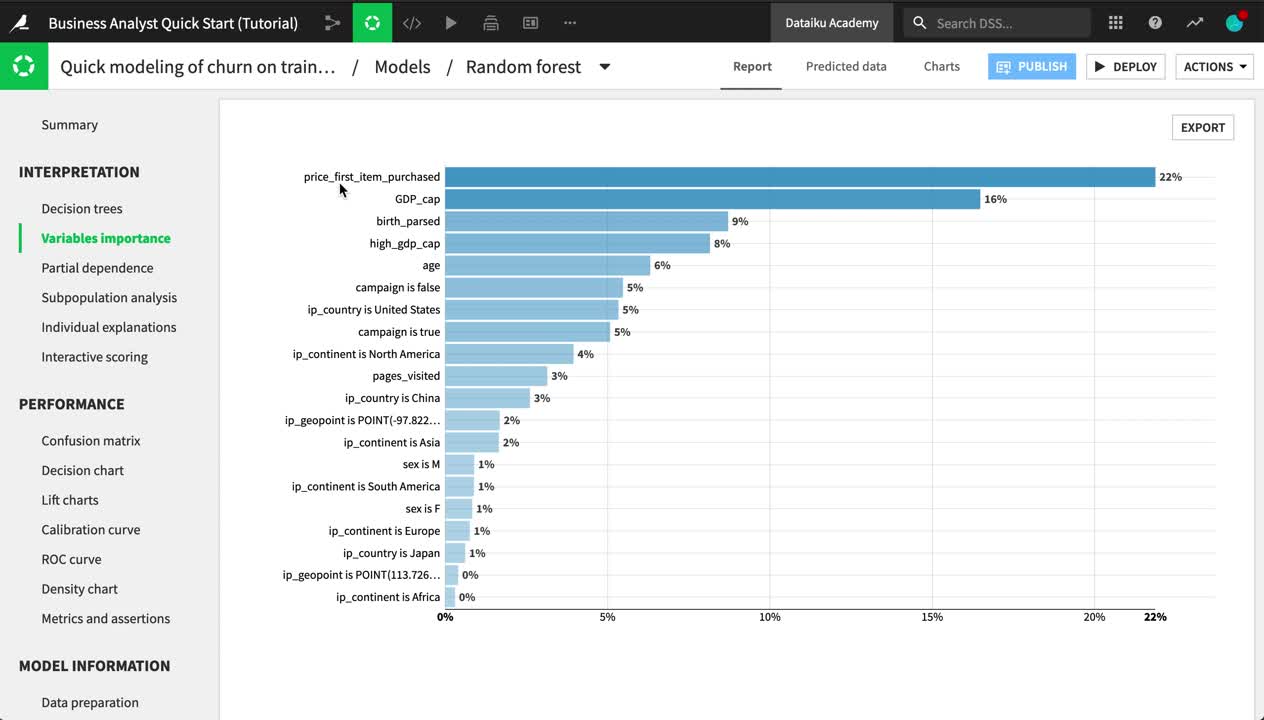
Explore some of the model report, such as the variables importance, confusion matrix, and ROC curve.
Navigate to the Subpopulation analysis panel.
Choose sex as the variable.
Click Compute to examine whether the model behaves identically for male and female customers.

Tip
The contents of this report change depending on the algorithm and type of modeling task. For example, a random forest model includes a chart of variable importance, and a K-means clustering task has a heatmap.
Iterate on a Model
You now have a baseline model, but you may be able to improve its performance by adjusting the design in a myriad number of ways.
When finished viewing the model report, click on Models near the top of the page to return to the results of the training session.
Navigate from the Result tab to the Design tab near the top center of the page.
Examine some of the conditions under which the first models were trained, such as the split of the train and test sets.
In the Features handling panel, turn off two features (ip_geopoint and birth_parsed) for which we have already extracted their information into ip_country and age.
In the Feature generation panel, add an explicit pairwise interaction between ip_country and sex.
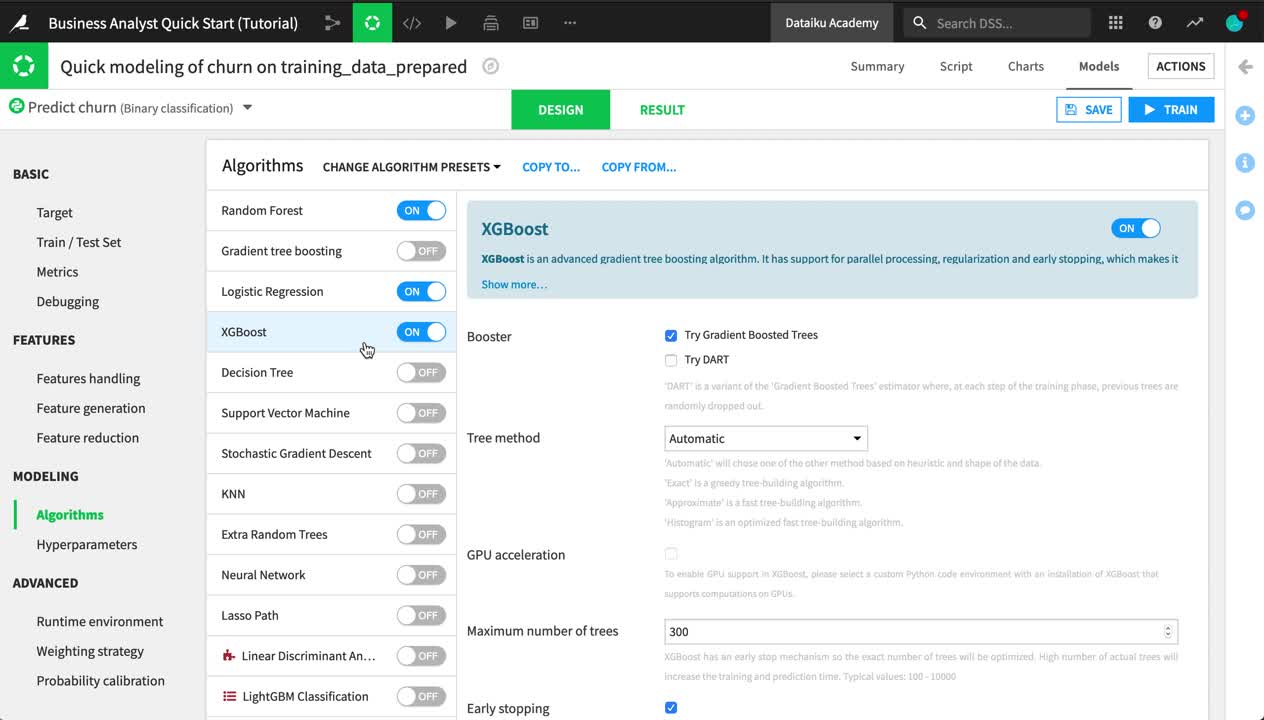
In the Algorithms panel, add a new algorithm to the training session, such as “XGBoost”.
When satisfied with your changes, click Train near the top right corner.
On the Training models dialog, click Train to build models once again with these new settings.

Tip
When training models, you can adjust many more possible settings covered in the product documentation.
Deploy a Model
The amount of time devoted to iterating the model design and interpreting the results can vary considerably depending on your objectives. In this case, let’s assume you are satisfied with the best performing model, and want to use it to generate predictions for new data that the model has not been trained on.
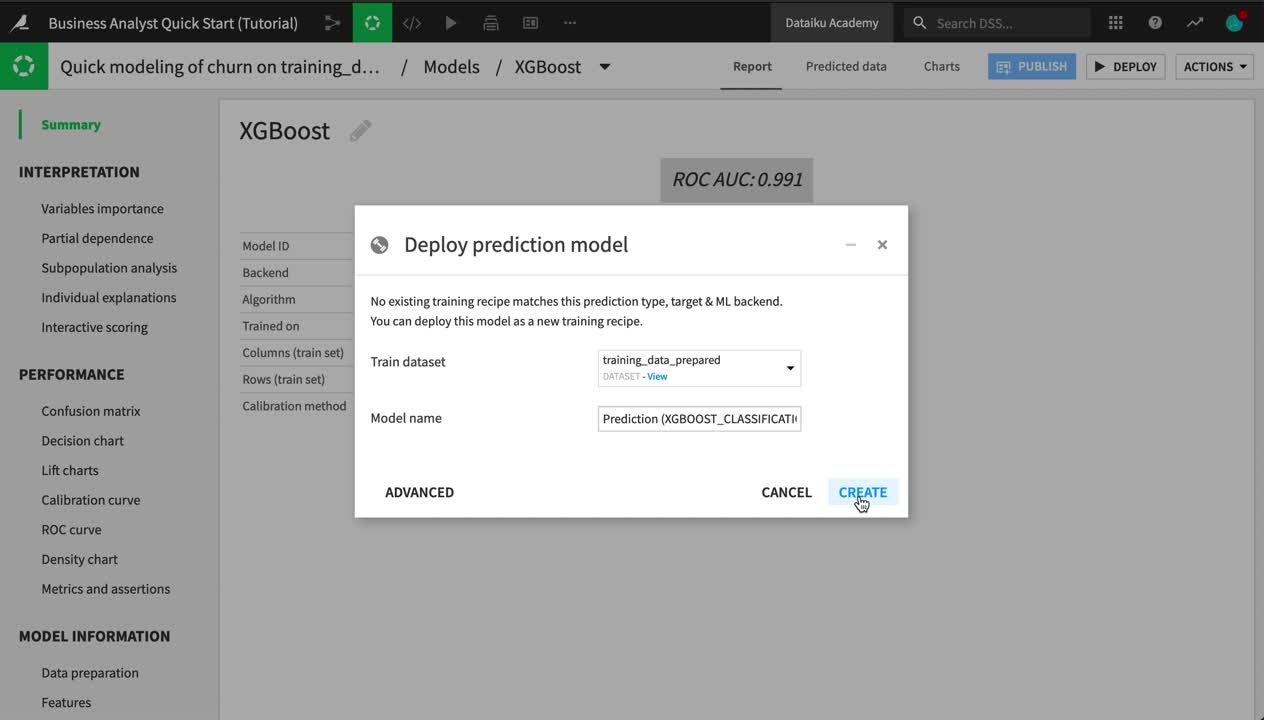
From the Result tab of the analysis, click to open the report of the best performing model (in this case, the XGBoost model from Session 2).
Click Deploy near the top right corner.
Click Create on the following dialog.
Observe two new green objects in the Flow:
a training recipe (green circle), and
a deployed or saved model (green diamond)
Double click to open the saved model from the Flow.

Tip
The model deployed to the Flow has one active version. As new data becomes available, you might retrain the model and deploy updated versions. If performance degrades for any reason, you can revert to an earlier version. You can also automate this process with scenarios.