
Tutorial | Cobuild basics#
Get started#
With Cobuild, you can build and manage an entire Dataiku project by describing what you want in plain language.
In this tutorial, you’ll use prompts in the Cobuild conversational interface to build a basic data analysis pipeline and to guide you through the project.
Important
Because of the nature of LLMs, Cobuild might give you different responses to the prompts in this tutorial, or it might achieve the same objectives in different ways. Your final project could look different from the one shown here.
Think of this tutorial as a guide to exploring with Cobuild, rather than a strict procedure to follow. Feel free to build on your conversations and experiment with Cobuild!
Objectives#
In this tutorial, you will:
Use Cobuild to create a Flow in Dataiku.
Write Cobuild prompts that help with different types of tasks, from brainstorming to building a Flow.
Track Cobuild’s activities and reasoning.
Learn how to check and edit Cobuild’s work.
Prerequisites#
To complete this tutorial, you will need:
Dataiku 14.7 or later.
Data Designer profile or higher.
The following settings configured by your instance administrator:
Enable Cobuild.
Configure an LLM path for Cobuild to use, either via Dataiku AI Services (Dataiku managed) or via an LLM Mesh path with configured model access (customer managed).
Grant permission for you to use Cobuild.
Create the project#
From the Dataiku Design homepage, click + New Project.
Select Learning projects.
Search for and select Cobuild Basics.
If needed, change the folder into which the project will be installed, and click Create.
From the project homepage, click Go to Flow (or type
g+f).
Note
You can also download the starter project from this website and import it as a ZIP file.
Use case summary#
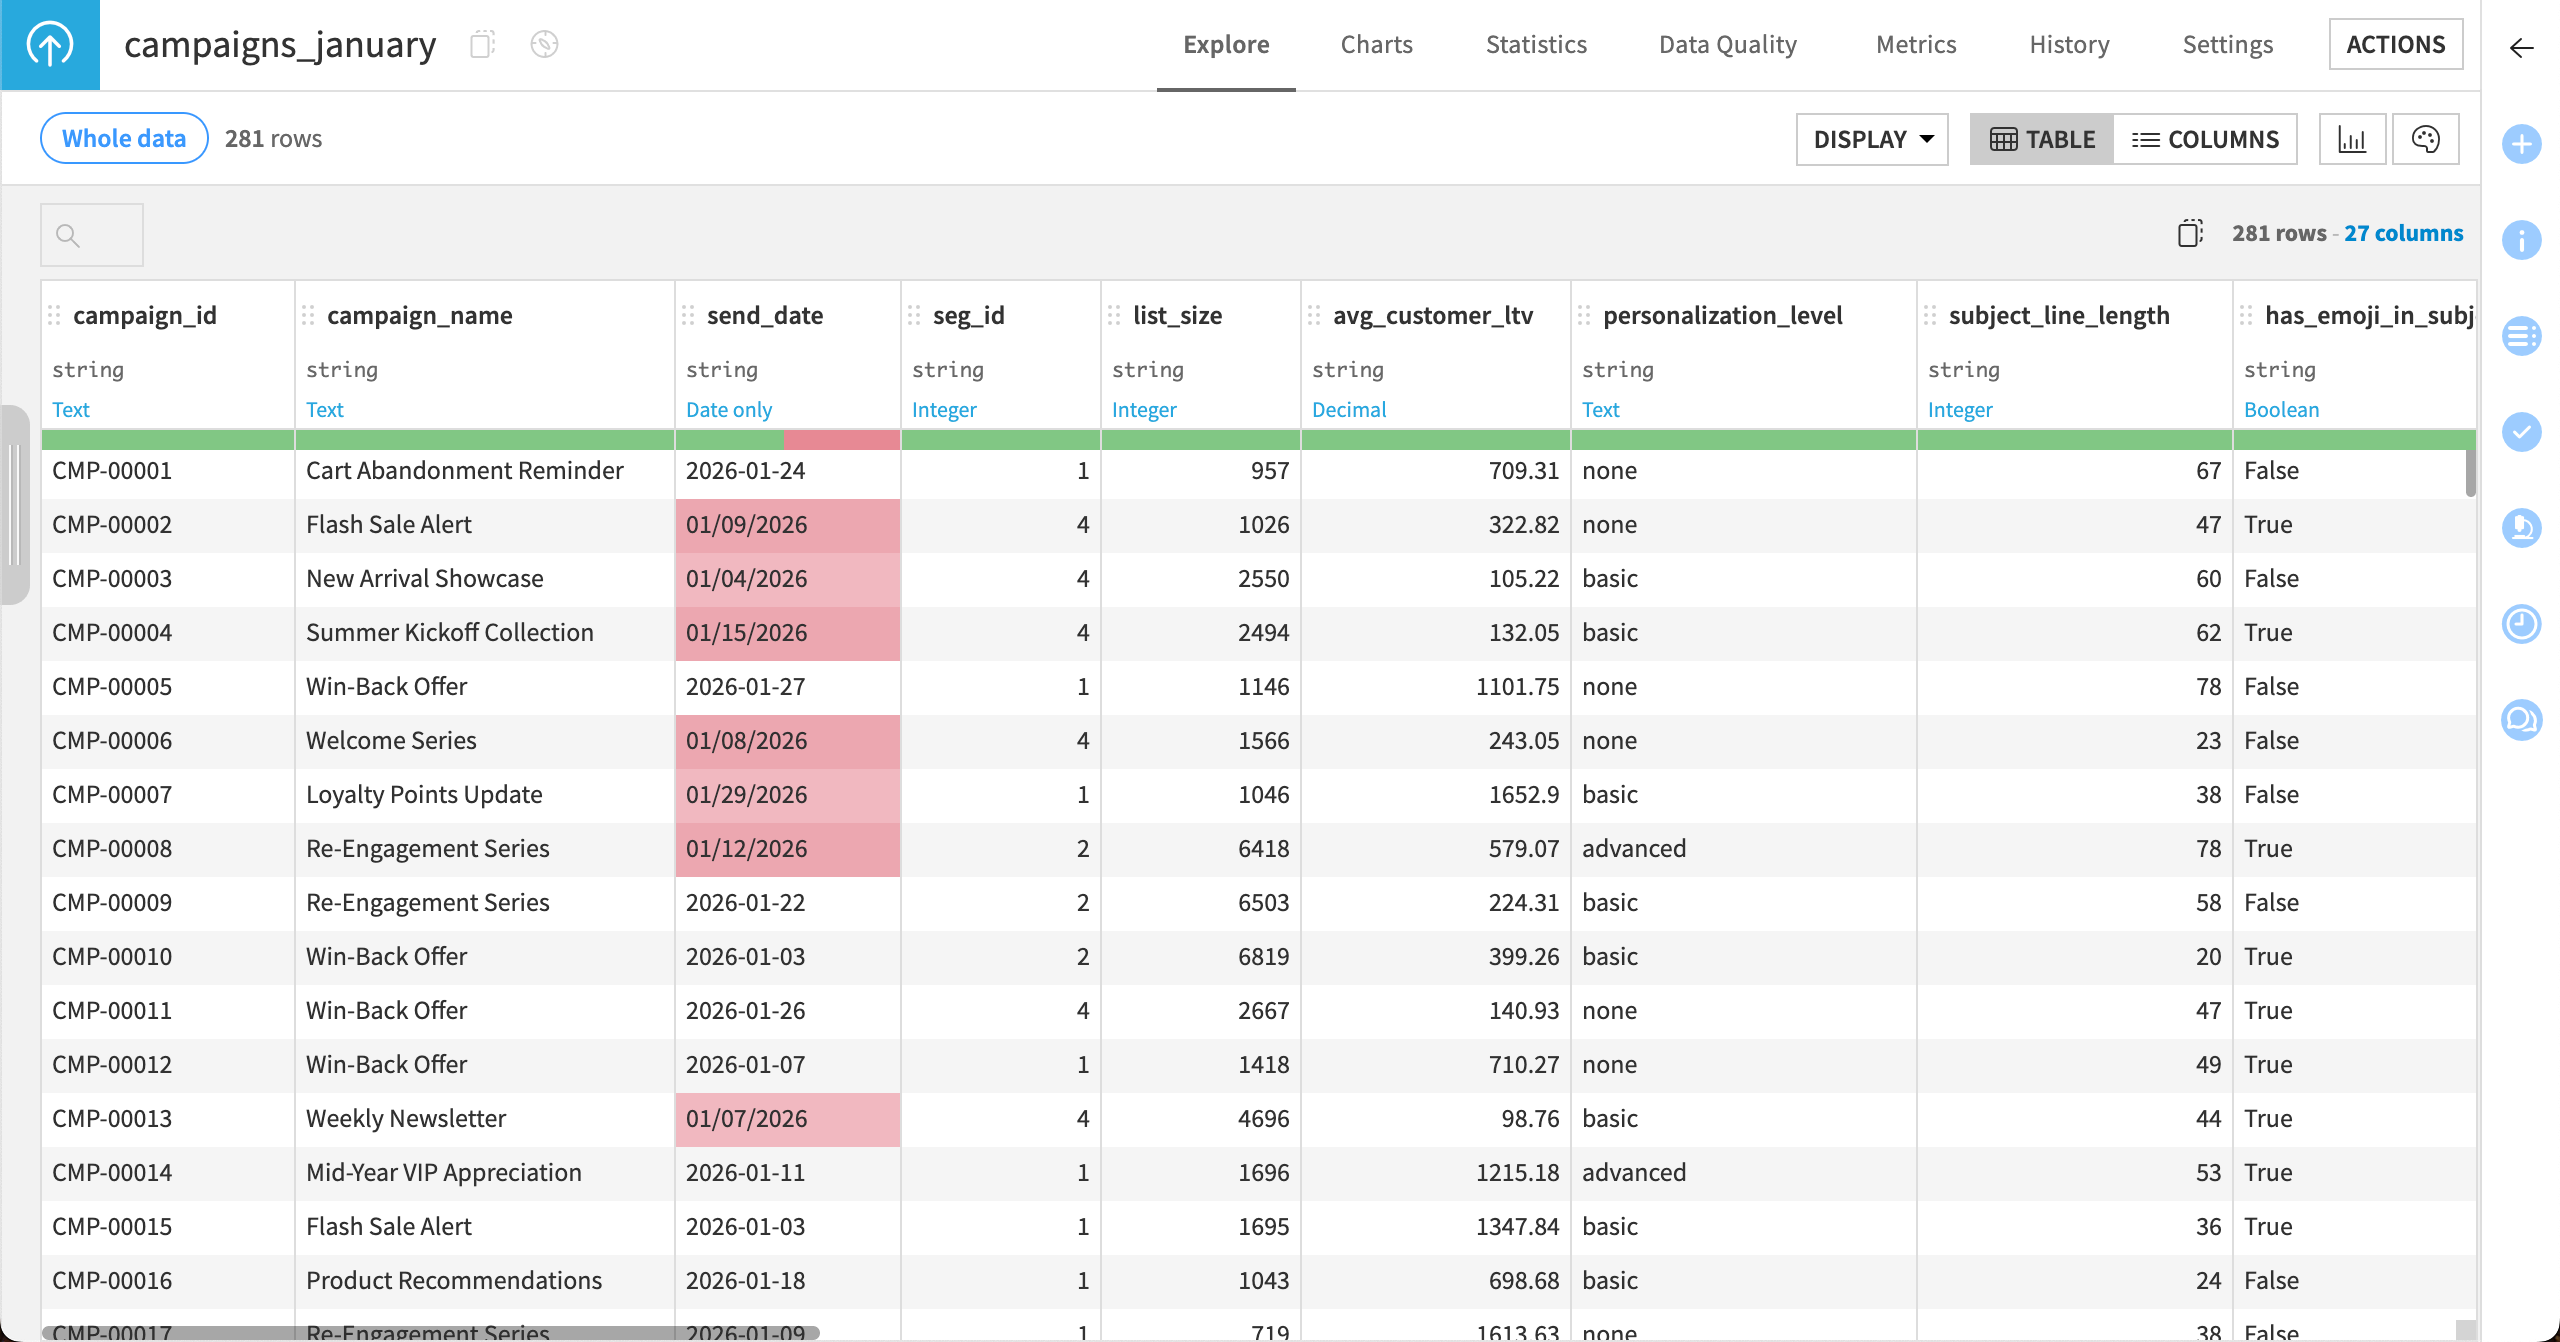
This tutorial uses simulated email marketing campaign data from a fictional retail company.
Starting with a few data files, you’ll use Cobuild to build the entire project lifecycle, including data preparation, analysis, and project documentation.
Each data file contains information on email campaigns, features describing their content, when they were sent, performance KPIs, and revenue generated.
Explore with prompts#
There is no one way to prompt with Cobuild. You could give it your purpose in the beginning and watch it build your entire Flow!
This tutorial will walk through each step in a project with detailed prompting so you can learn how conversations with Cobuild work.
To understand your data and build a plan for preparing it, start with some broad prompts.
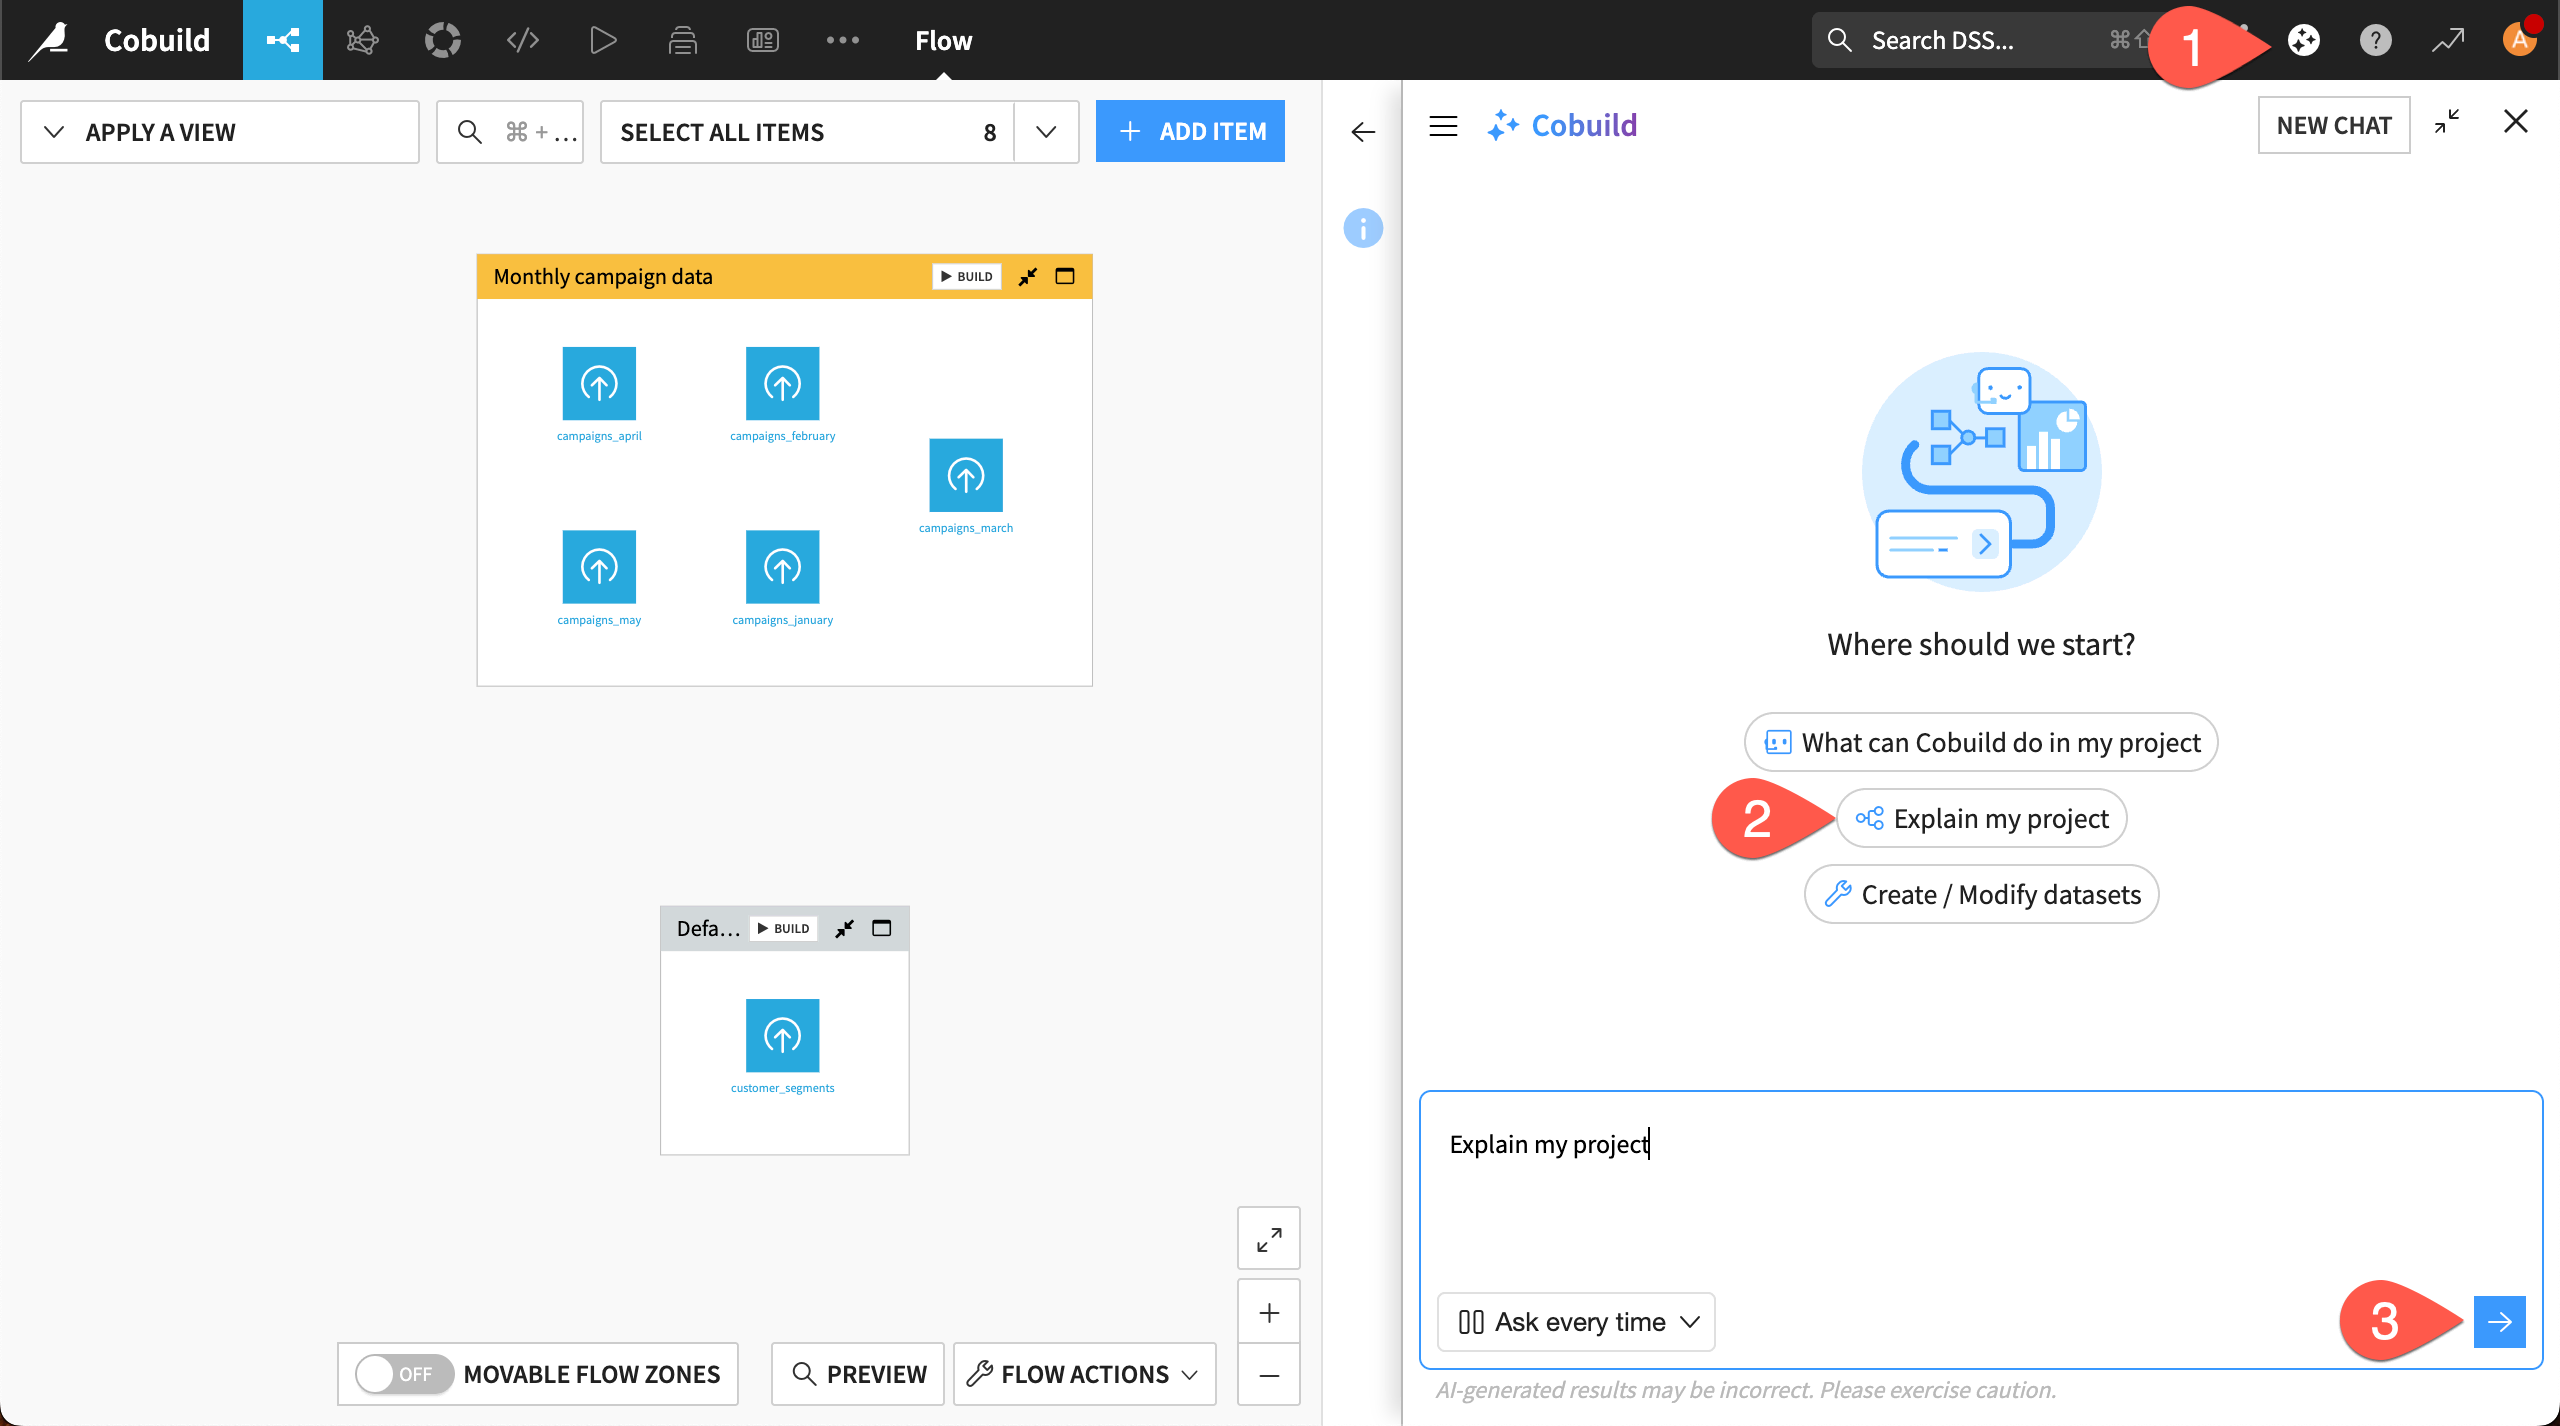
Click on the Cobuild (
 ) icon to bring up the chat window.
Click on the provided conversation starter Explain my project.
Send the chat by clicking on the arrow button in the chat.
Read Cobuild’s response.
Tip
You can change the size of the Cobuild window by clicking and dragging on the left border of the window.
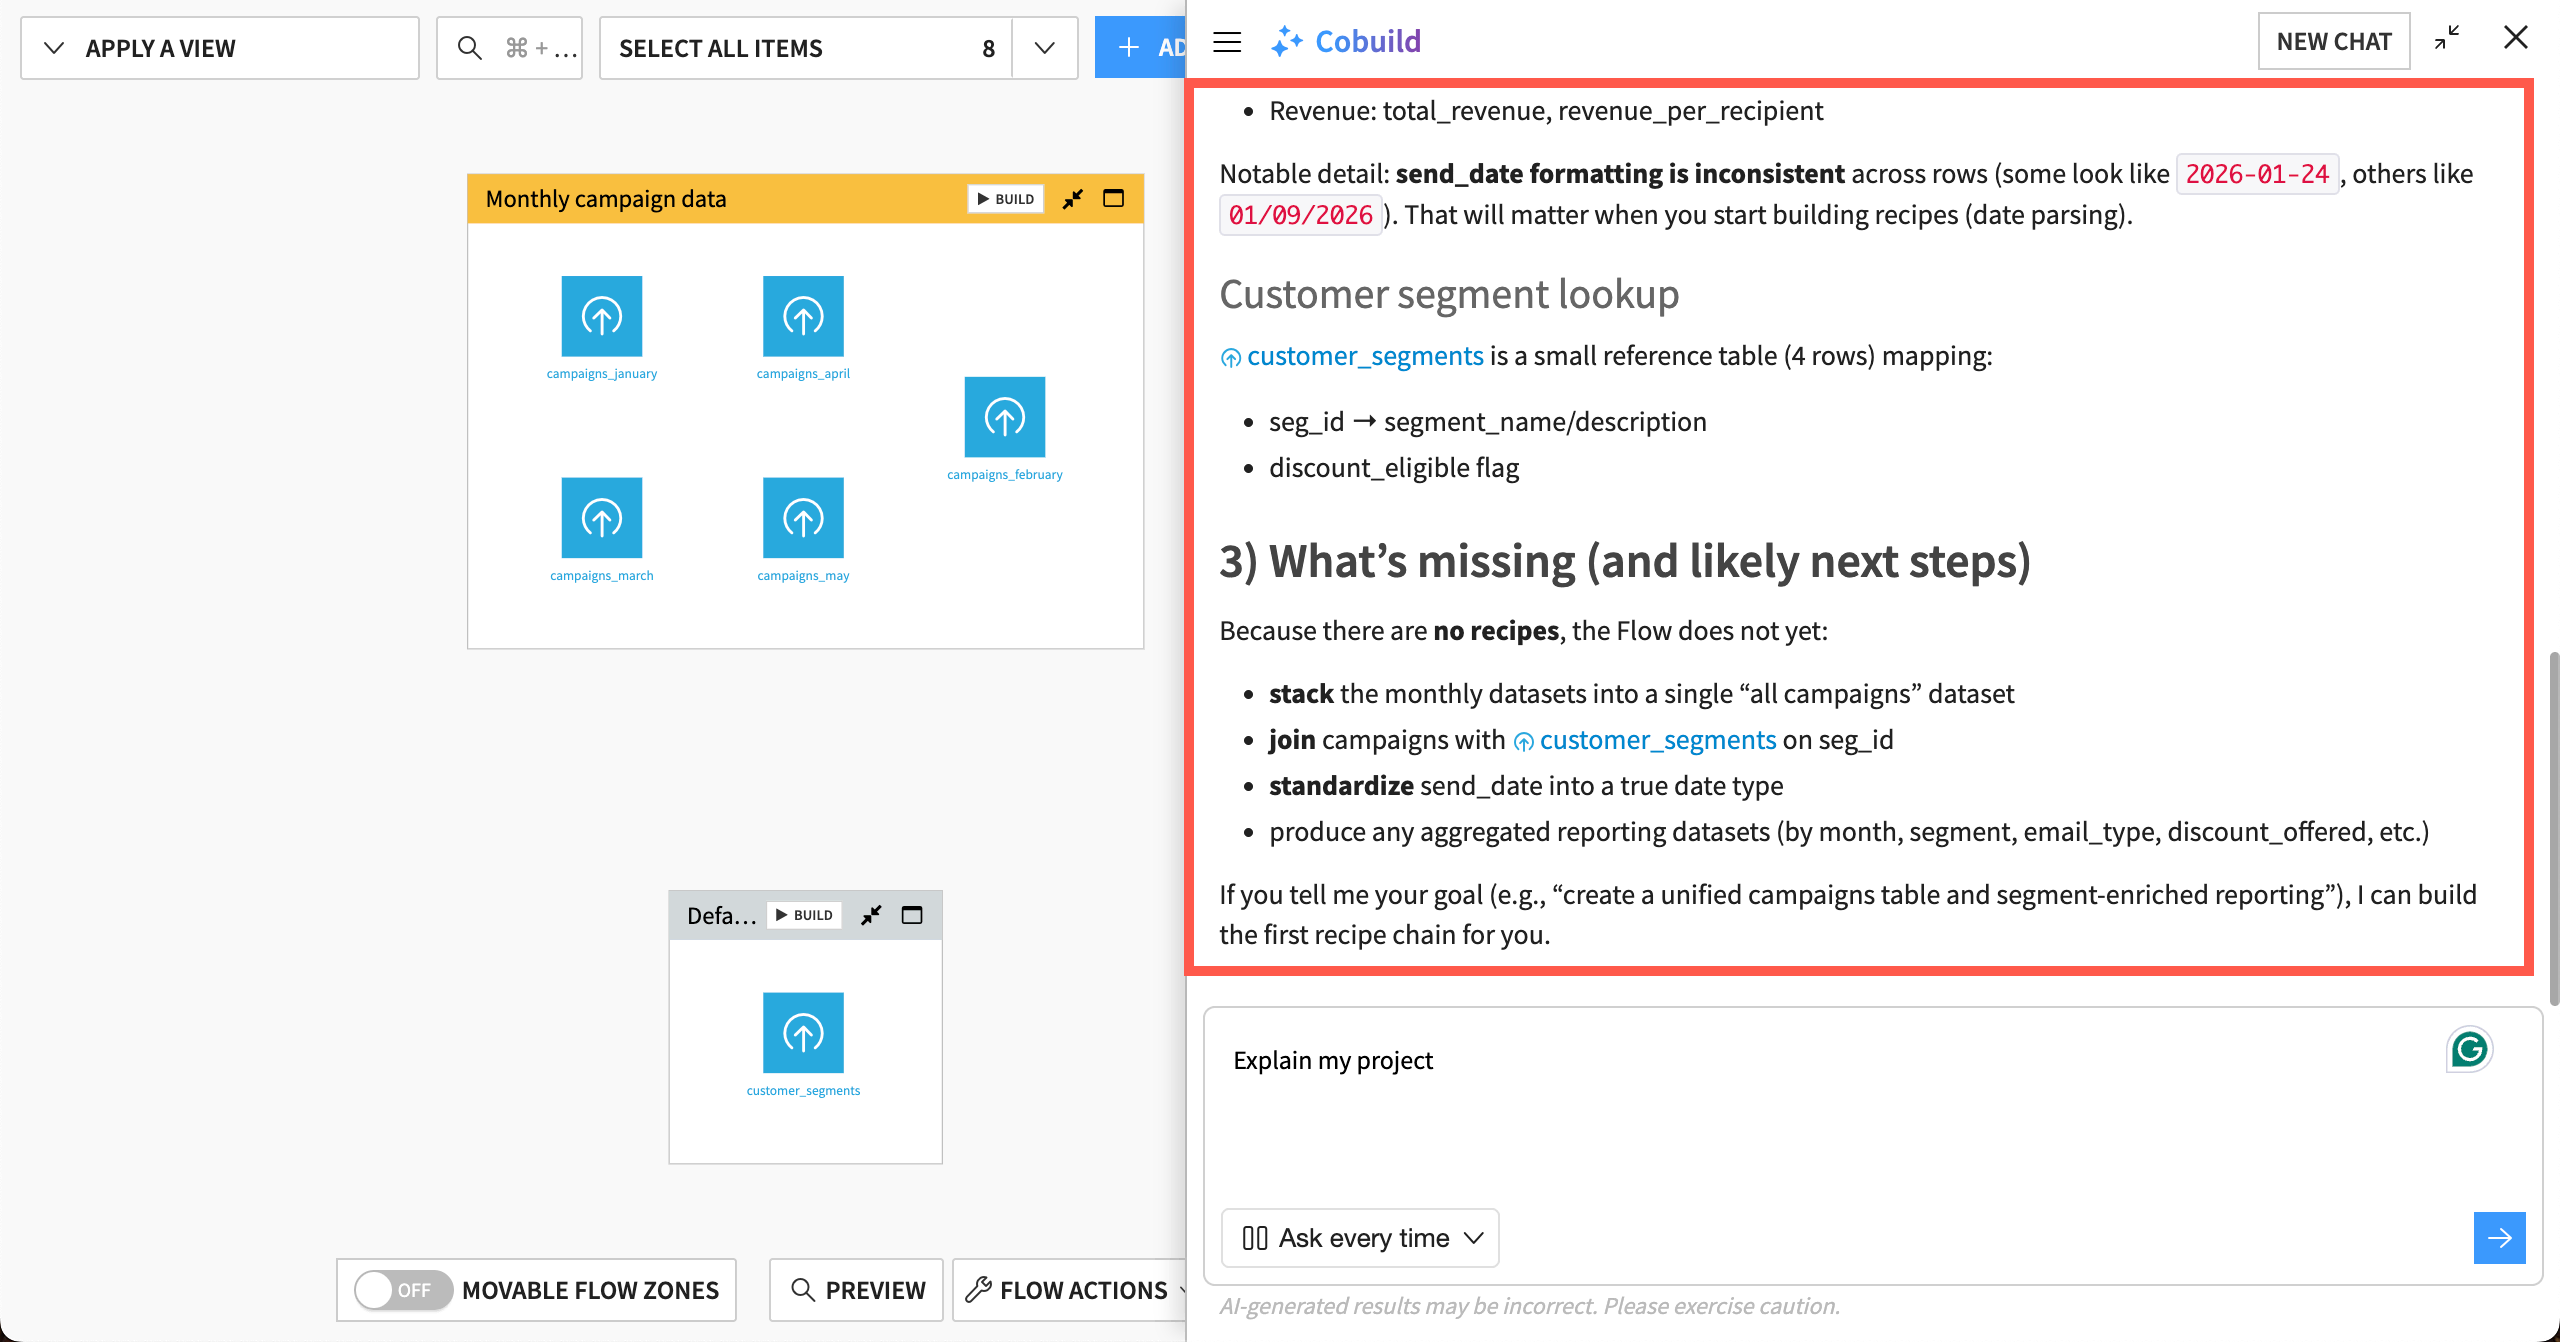
In the response, you might see Cobuild explaining the structure of this Flow, information contained in the datasets, and potential next steps.
In this example below, Cobuild has picked up on inconsistent date formatting that will need to be fixed, and it has suggested some other data preparation steps, such as stacking and joining the data.
If your Cobuild didn’t respond with potential next steps, try this prompt:
Suggest some next steps to prepare the datasets in the @monthly_campaign_data Flow zone for analysis.
View activity#
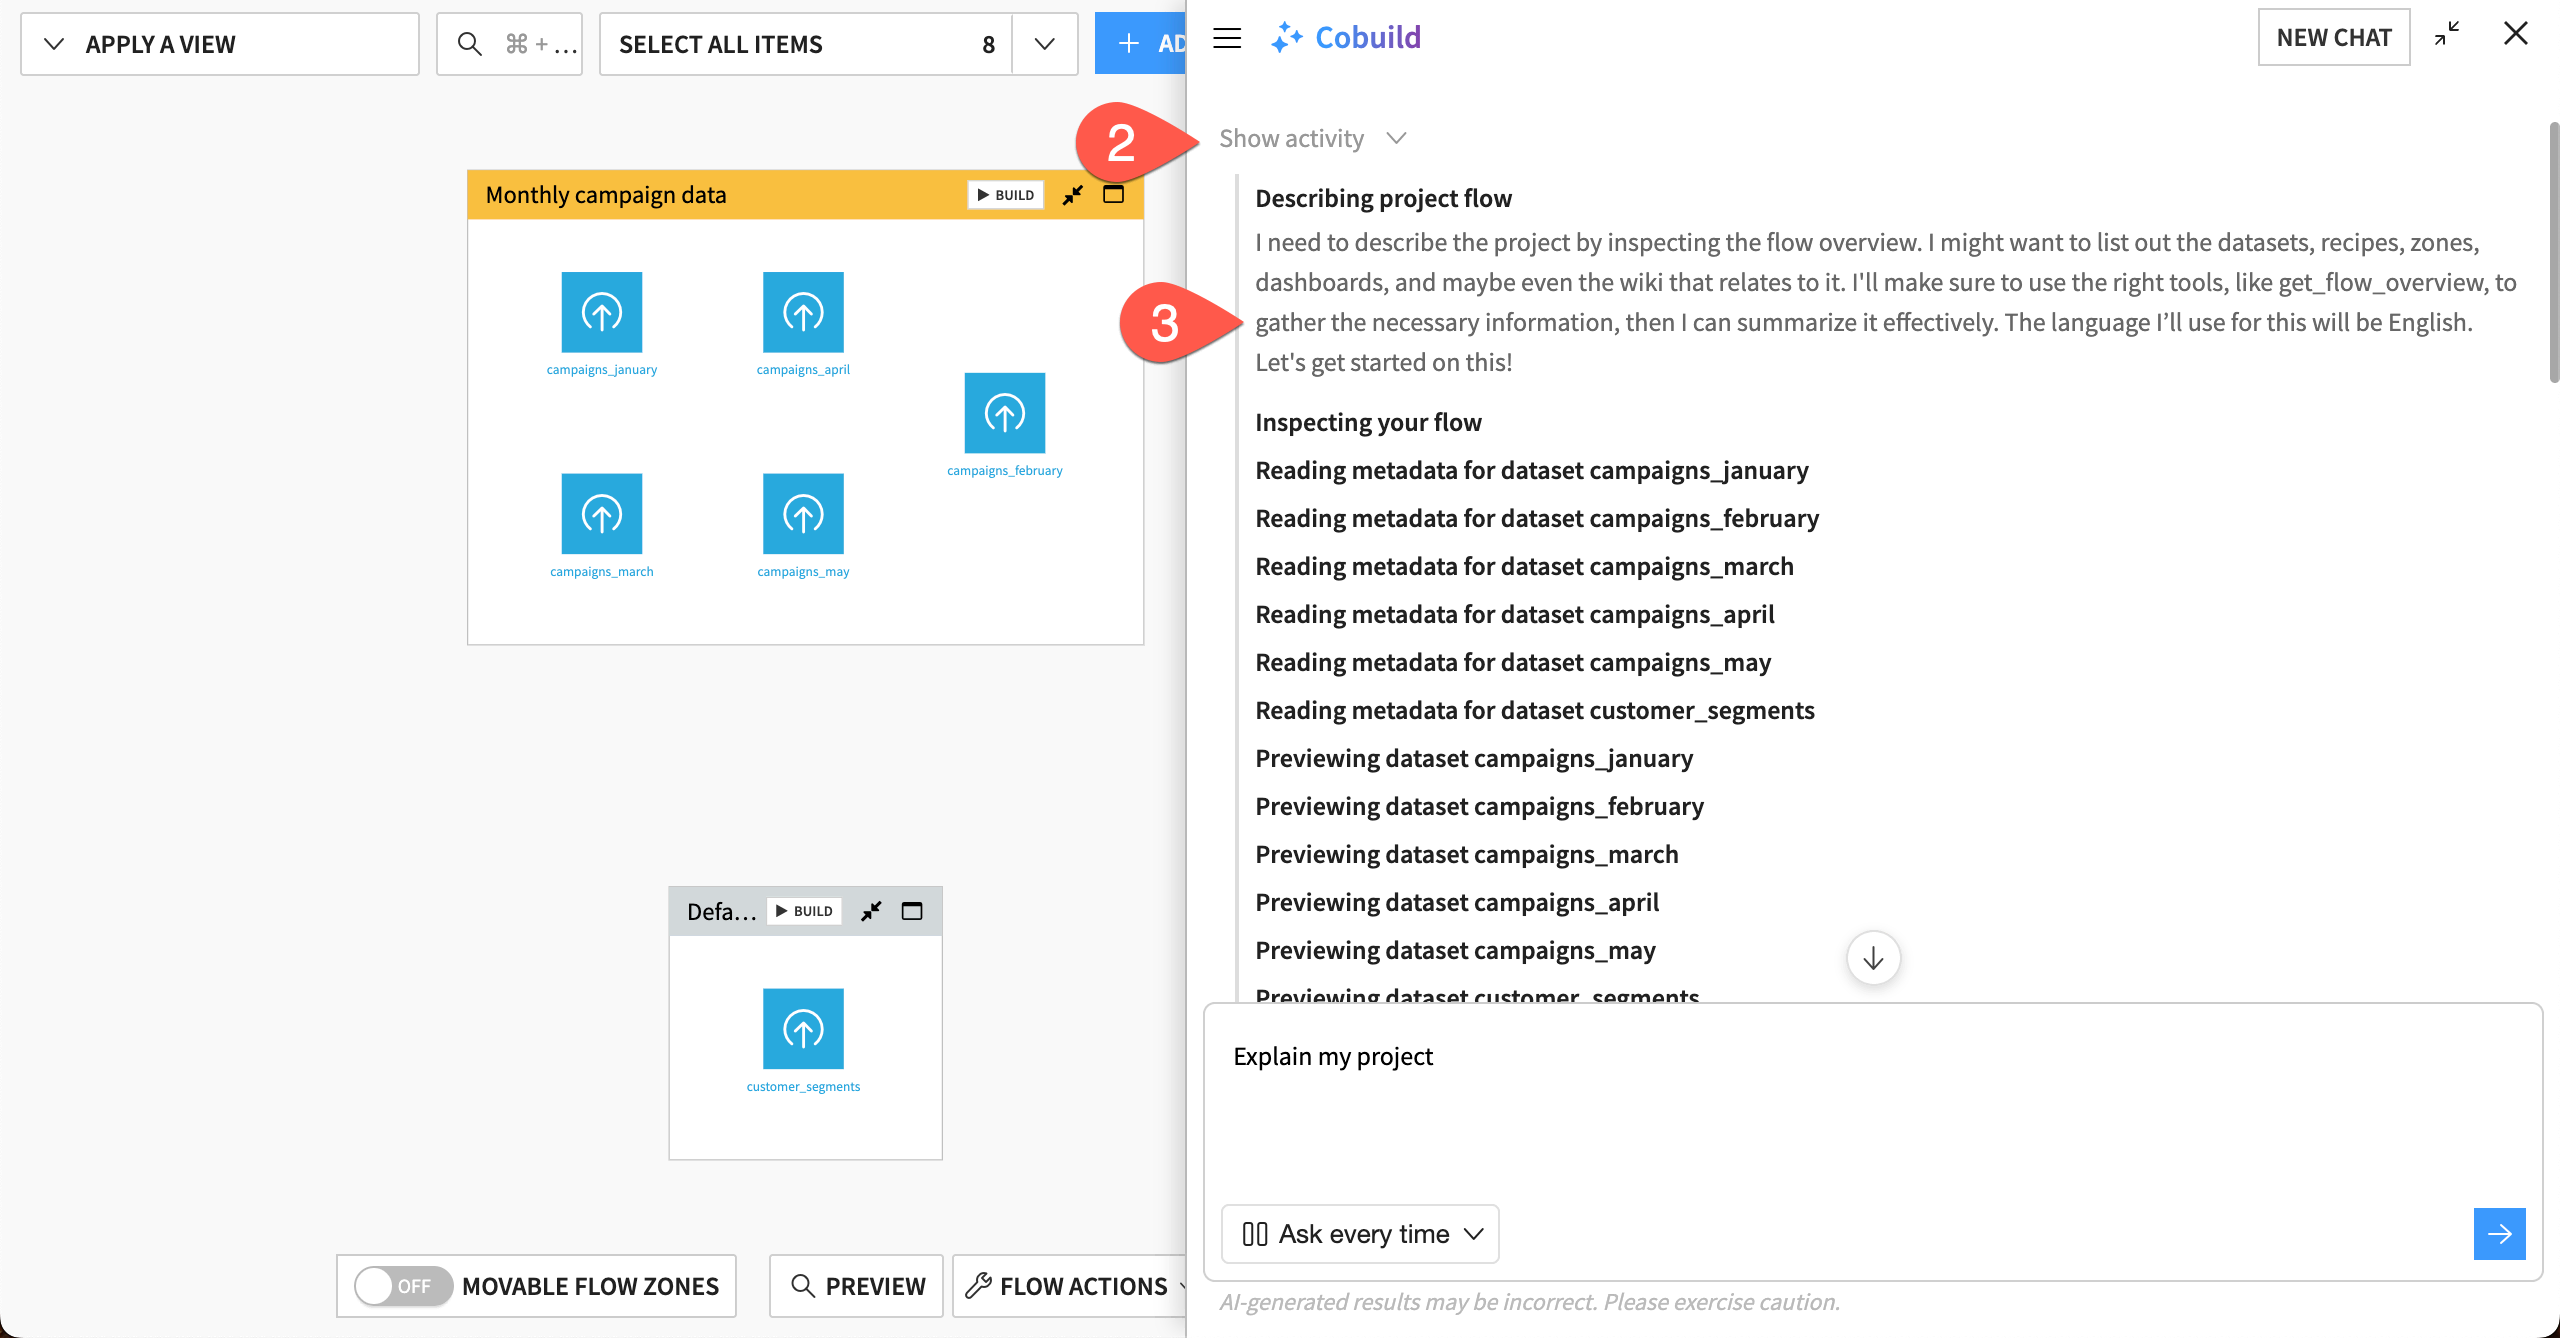
For each response, Cobuild provides a summary of its activities and reasoning, which you can view directly in the chat window.
Scroll to the top of Cobuild’s latest response.
Click on Show activity.
Read the summary, which shows all the steps Cobuild completed to respond to the prompt.
Build the Flow#
After exploring the project and brainstorming some next steps, you can ask Cobuild to build some recipes to prepare the data.
Clean the data#
For data preparation, start a new chat window so you can keep conversations shorter and more organized.
Because this is the first time Cobuild will modify your project, you’ll also need to give it permission to make changes.
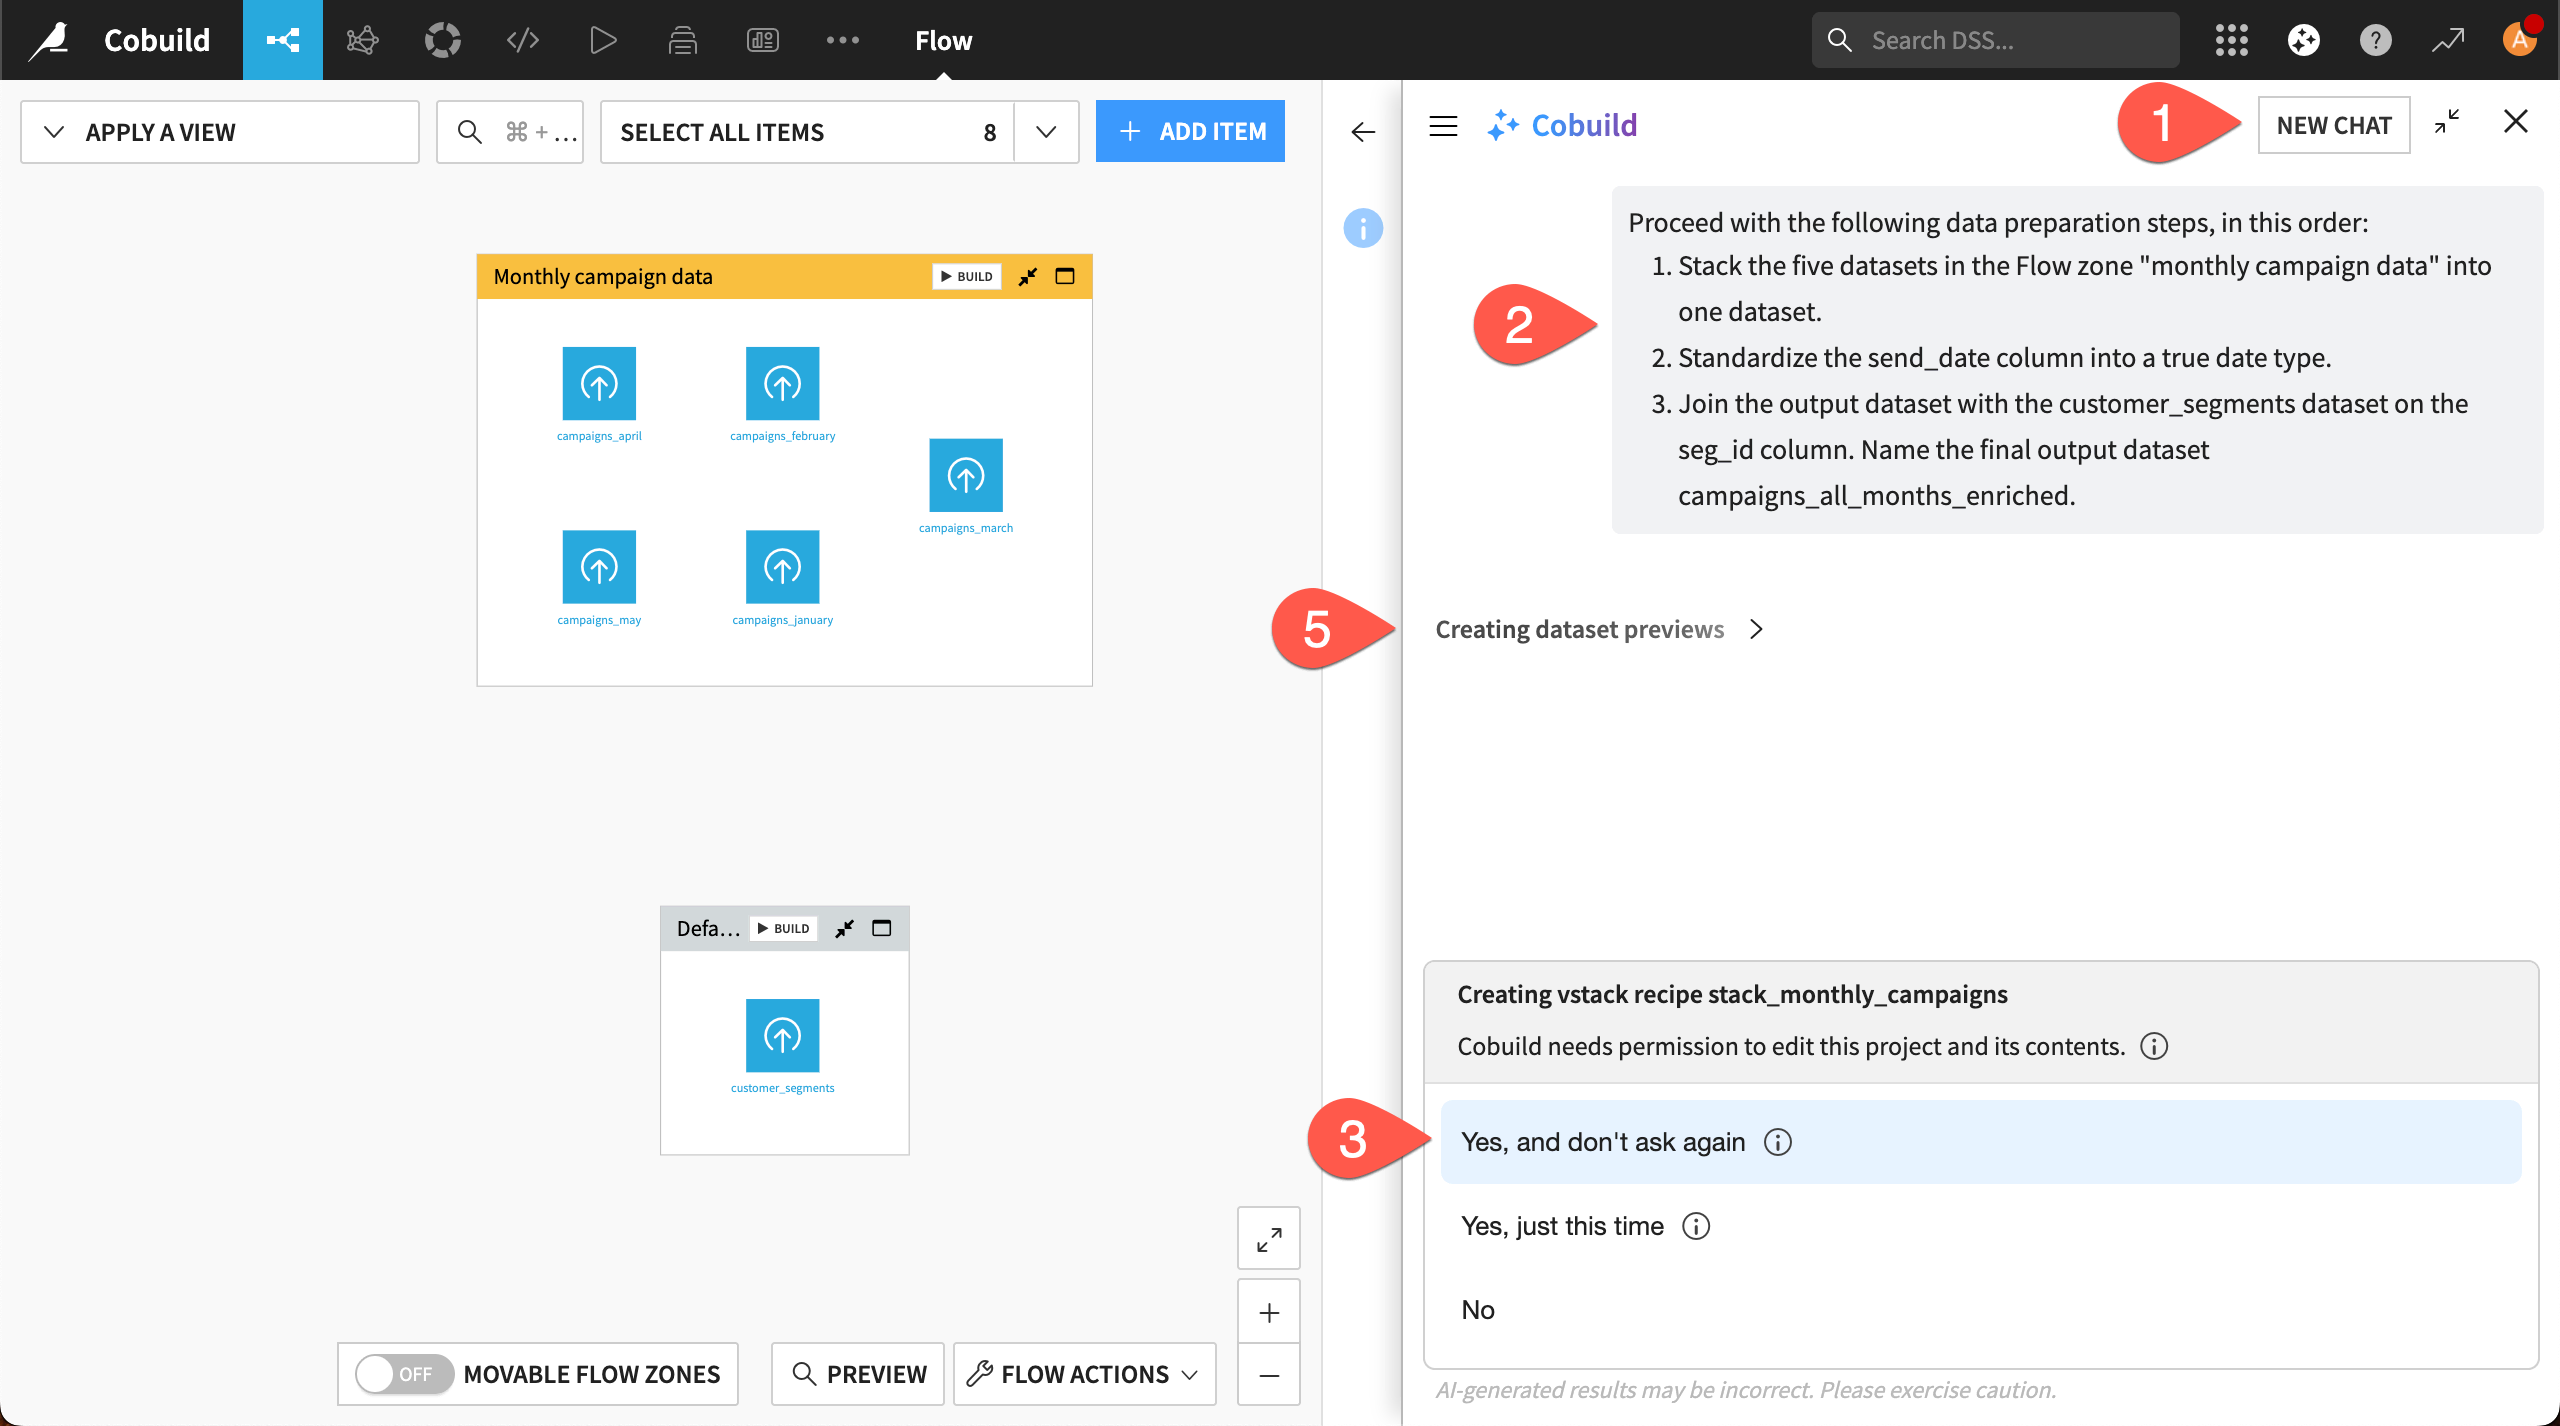
In the Cobuild window, click on New Chat.
Copy and paste this prompt into the chat window, and send it:
Proceed with the following data preparation steps, in this order:
1. Stack the five datasets in the Flow zone @Monthly_campaign_data into one dataset.
2. Standardize the send_date column into a true date type.
3. Join the output dataset with the customer_segments dataset on the seg_id column. Name the final output dataset campaigns_all_months_enriched.
When Cobuild asks for permission to edit the project, respond with Yes, and don’t ask again. This allows automatic execution in the project (though you can change this any time).
If Cobuild asks you any clarifying questions about the prompt, respond appropriately.
As Cobuild works, watch the activities in real time, just above the chat window.
Tip
This tutorial combines the preparation steps into one prompt for brevity. You could also prompt Cobuild to execute each of these preparation steps separately. Or if Cobuild suggested these steps, you can confirm and ask it to proceed.
Check the output#
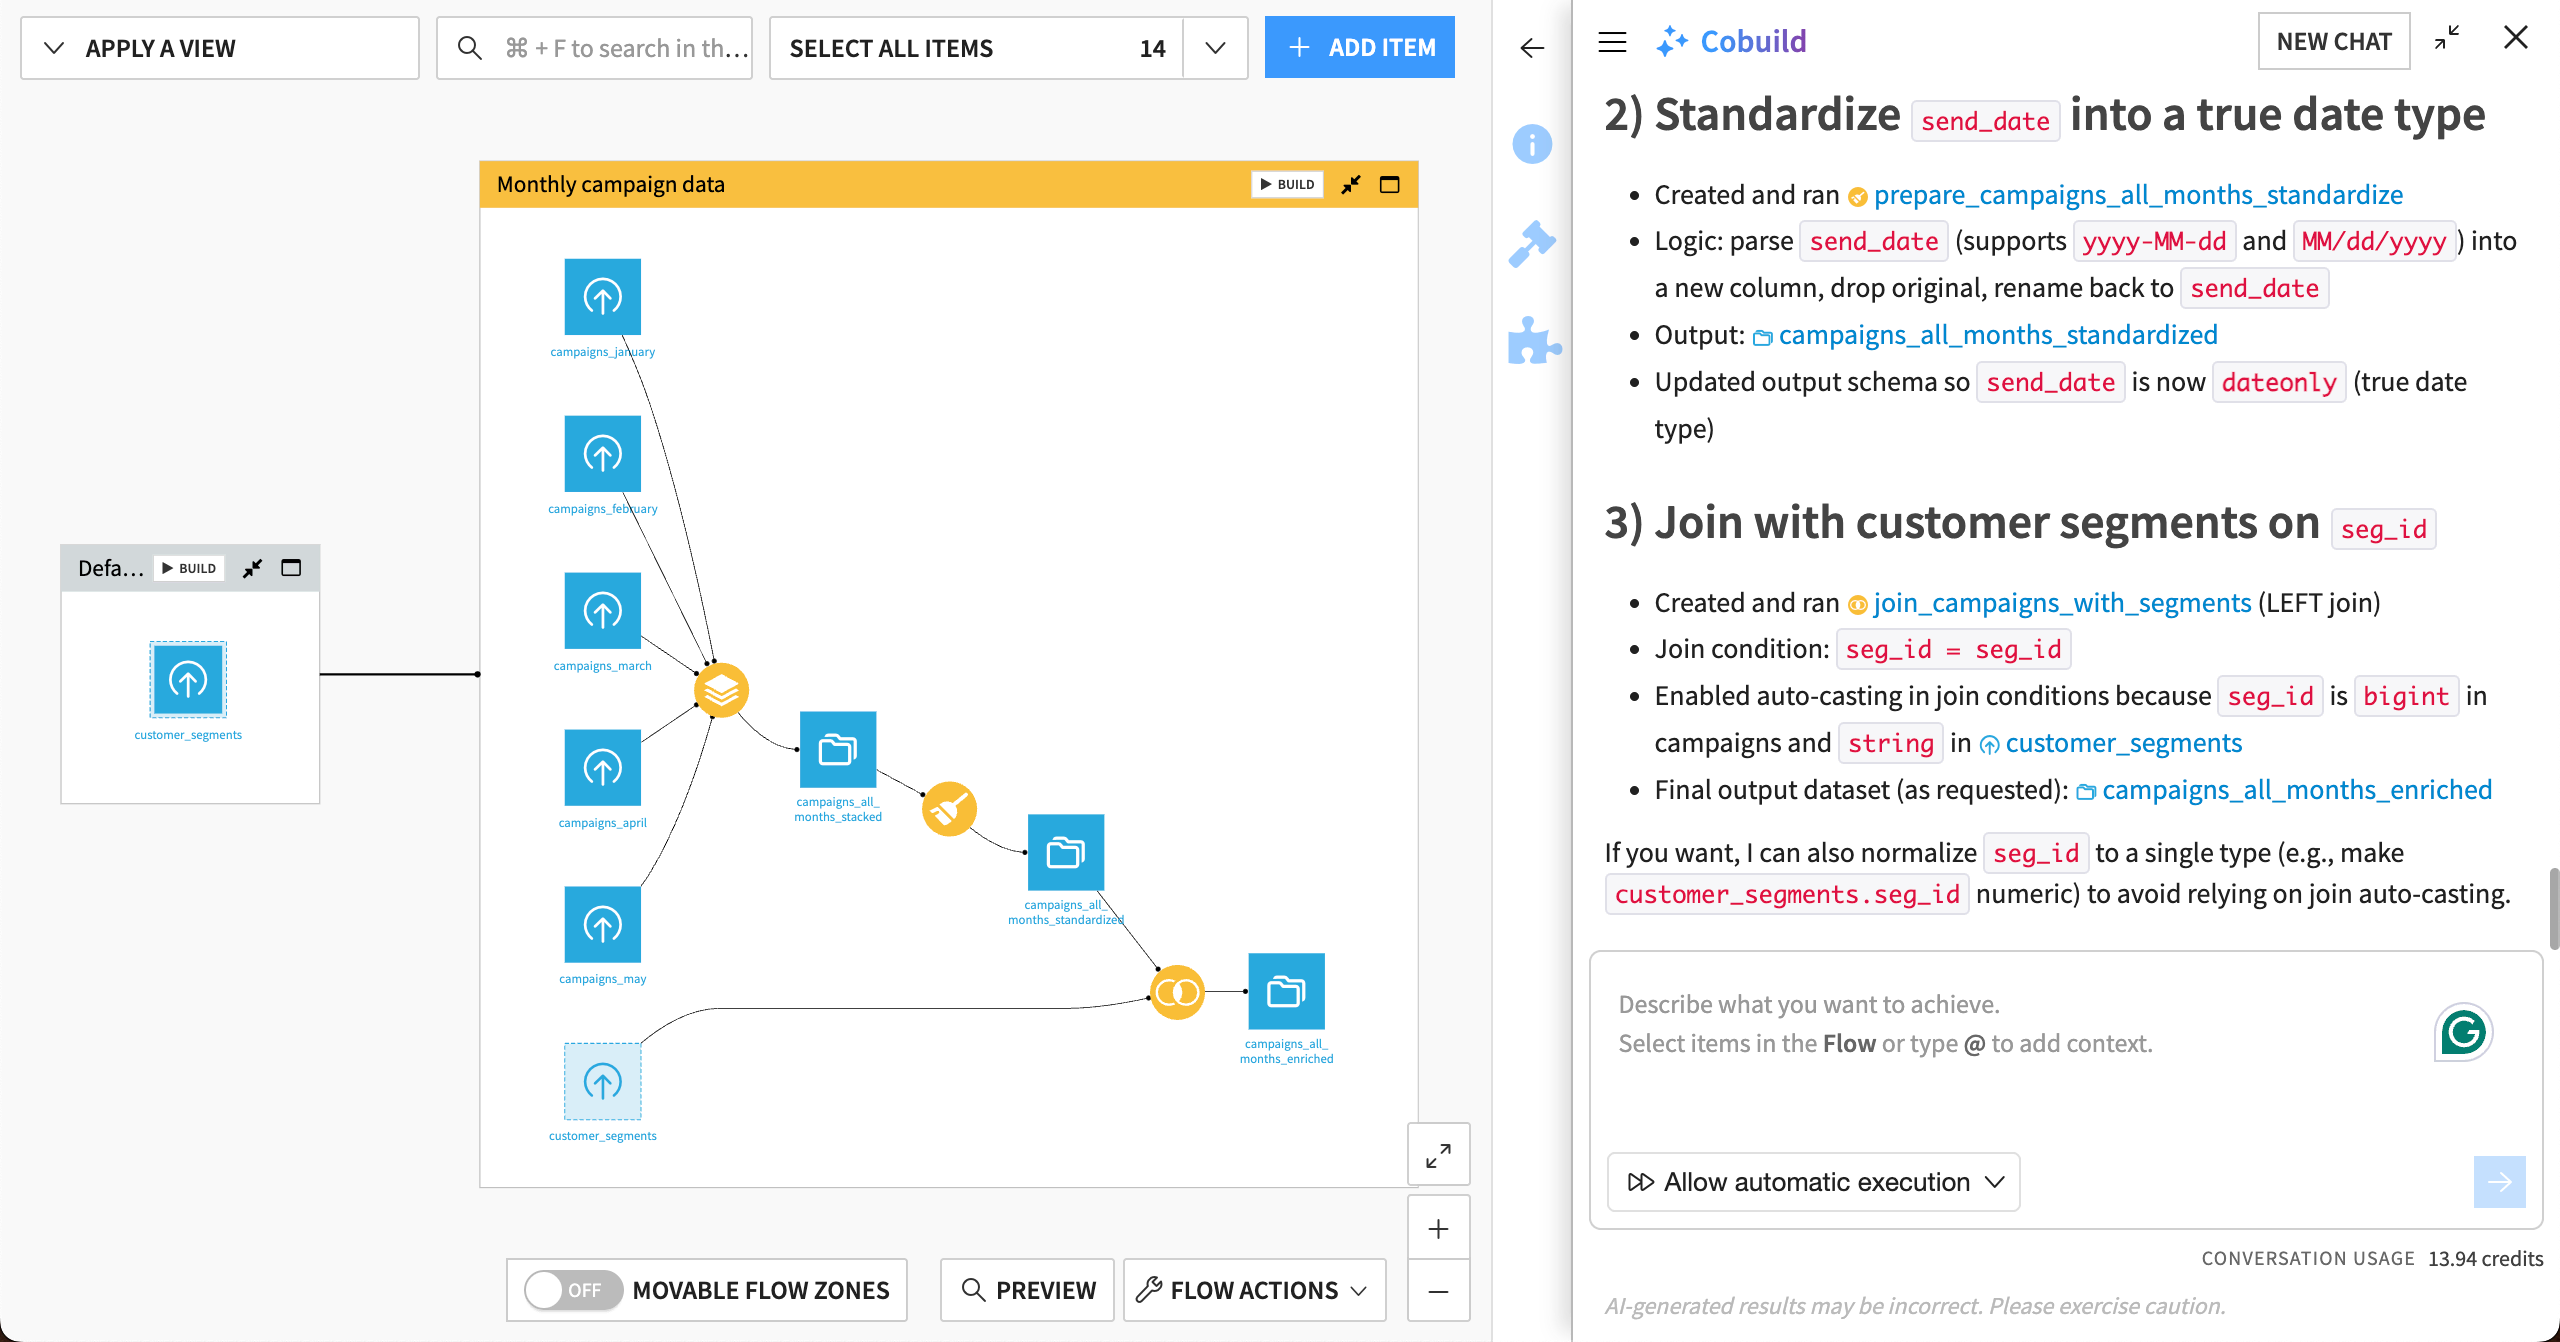
After Cobuild has built the recipes and datasets, check that the output is what you requested. Your Flow likely looks like this, with new Stack, Prepare, and Join visual recipes.
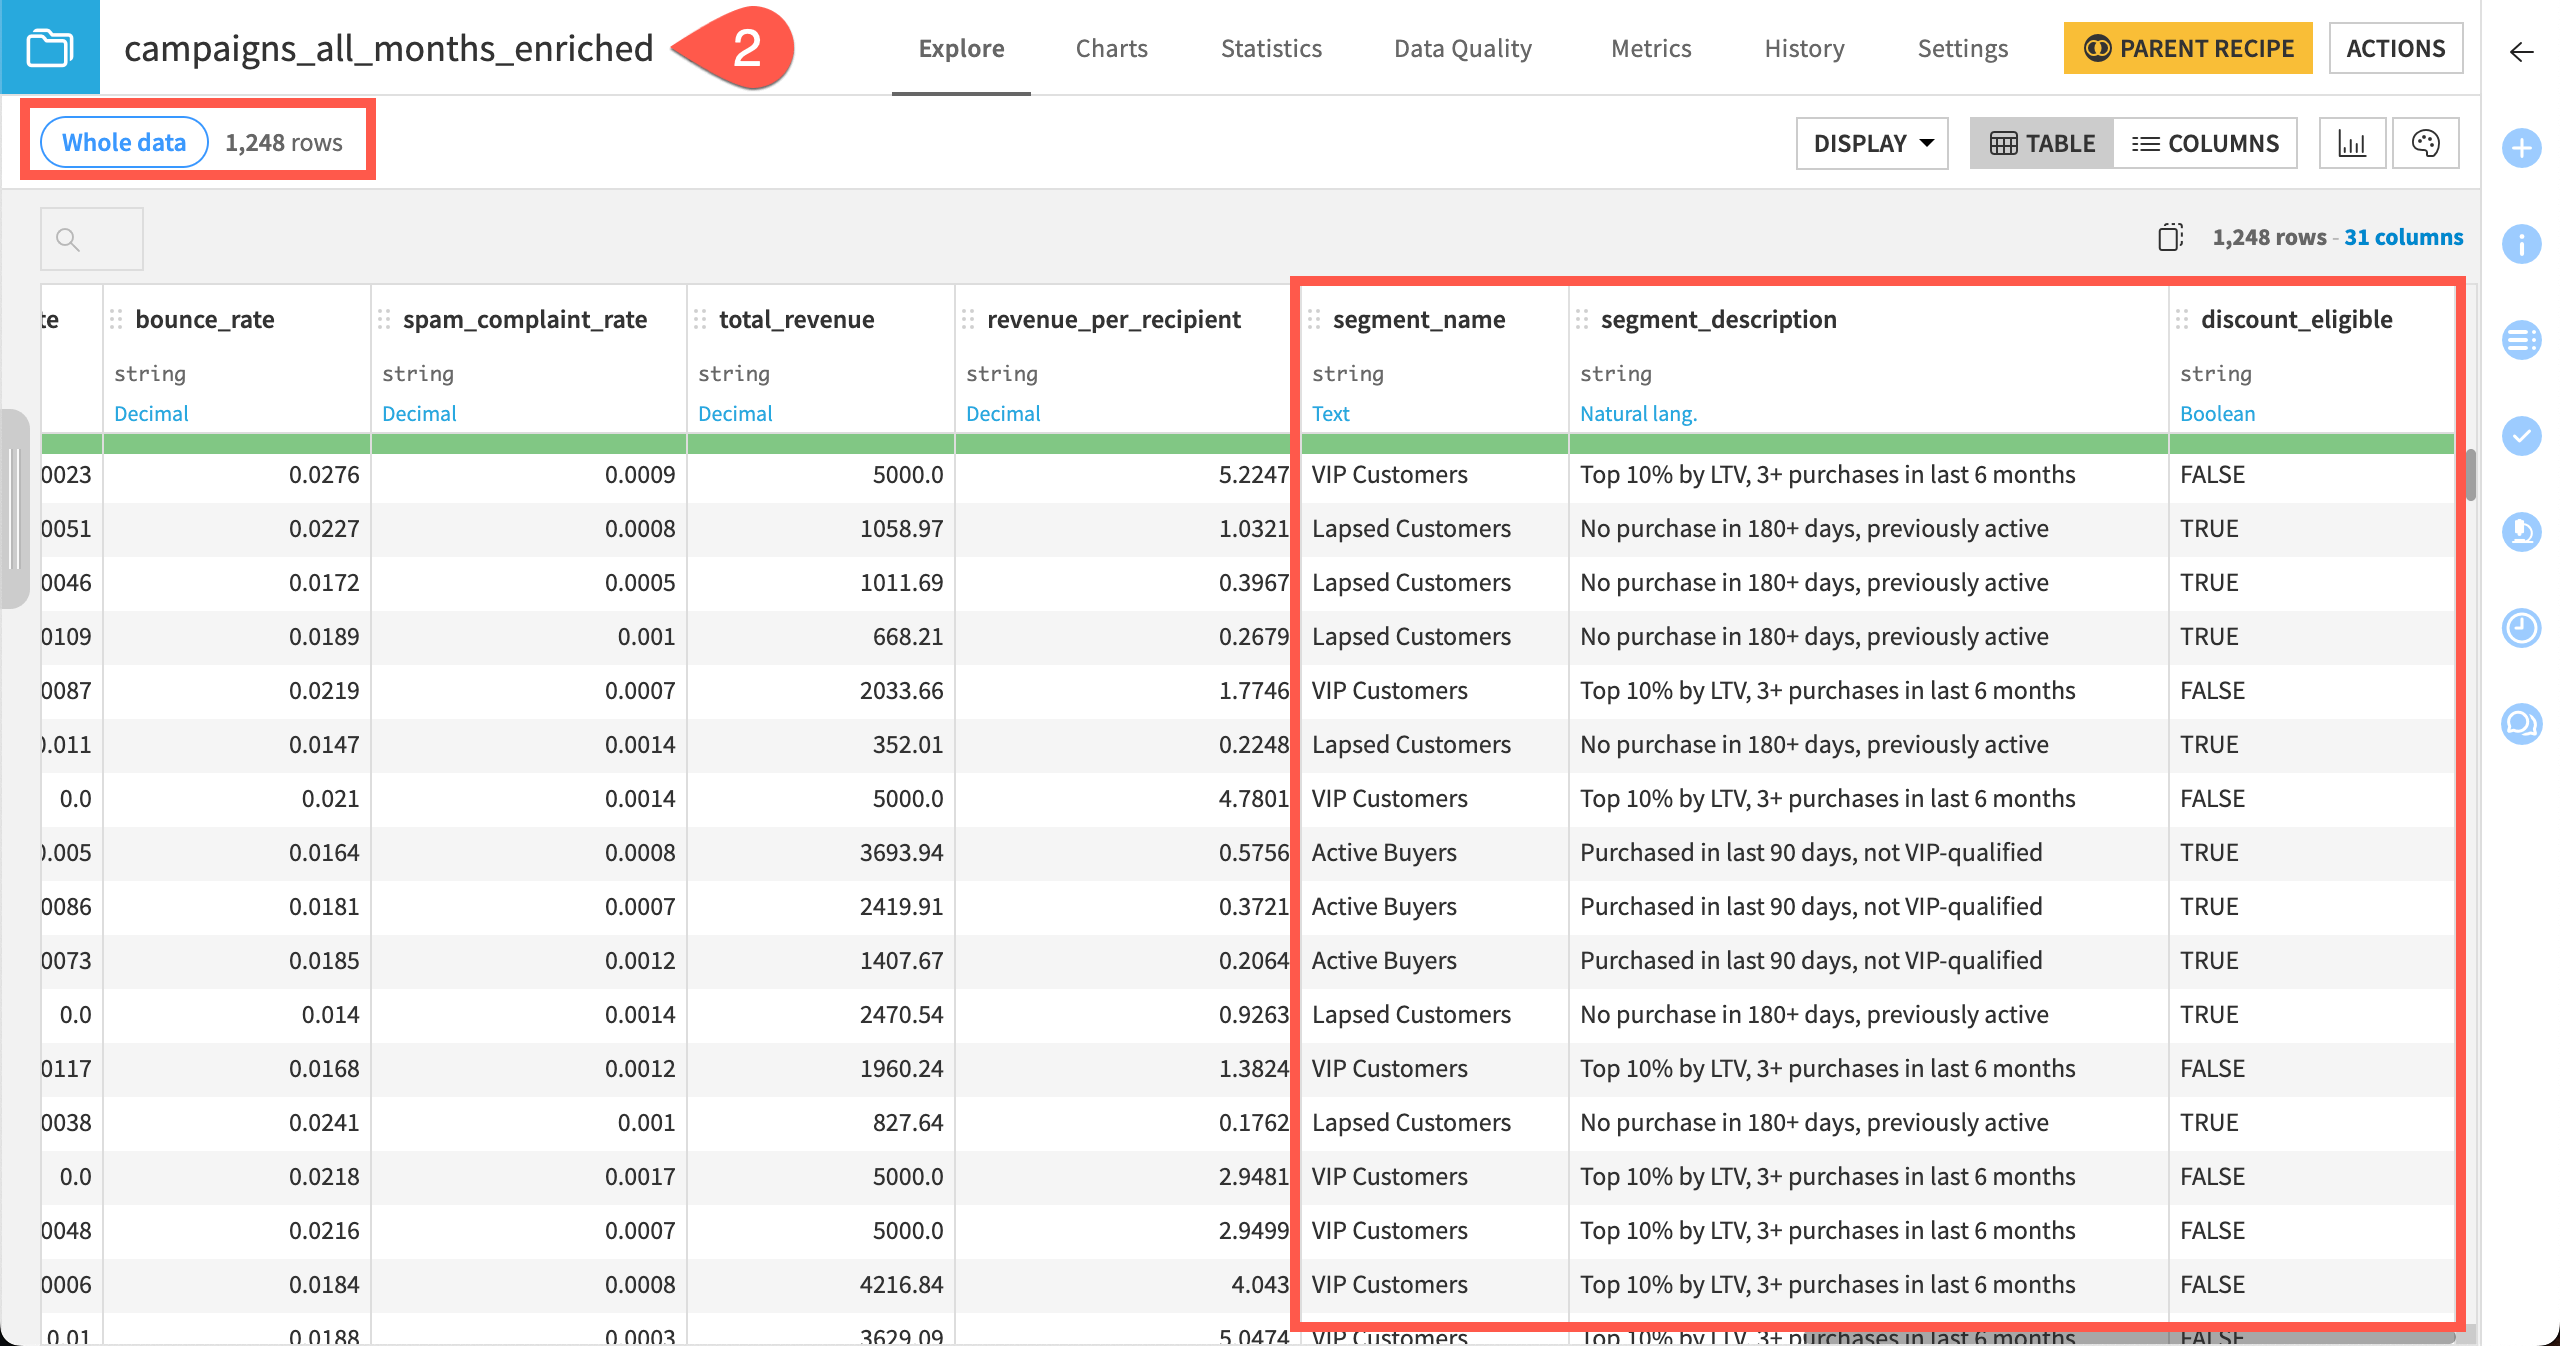
In the Flow, open the final dataset, campaigns_all_months_enriched.
Confirm:
The data has rows from all the monthly datasets.
The email campaign data has been enriched with columns from the customer_segments dataset.
The send_date column has been standardized.
Explore the recipes Cobuild created to build the dataset.
Tip
You can edit any of Cobuild’s output objects as you normally would in the Flow. You can do this manually or by asking Cobuild to change the object.
Make calculations#
Another part of data preparation might be making some calculations to use later in analysis.
This data already contains some key performance indicators for email lists, such as click_rate and revenue_per_recipient, but maybe Cobuild can think of some more!
Click on the dataset campaigns_all_months_enriched in the Flow to highlight it. This gives Cobuild the context that it will work in this dataset.
In the Cobuild window, ask:
What are some KPIs you might build to determine how the email campaigns are performing?
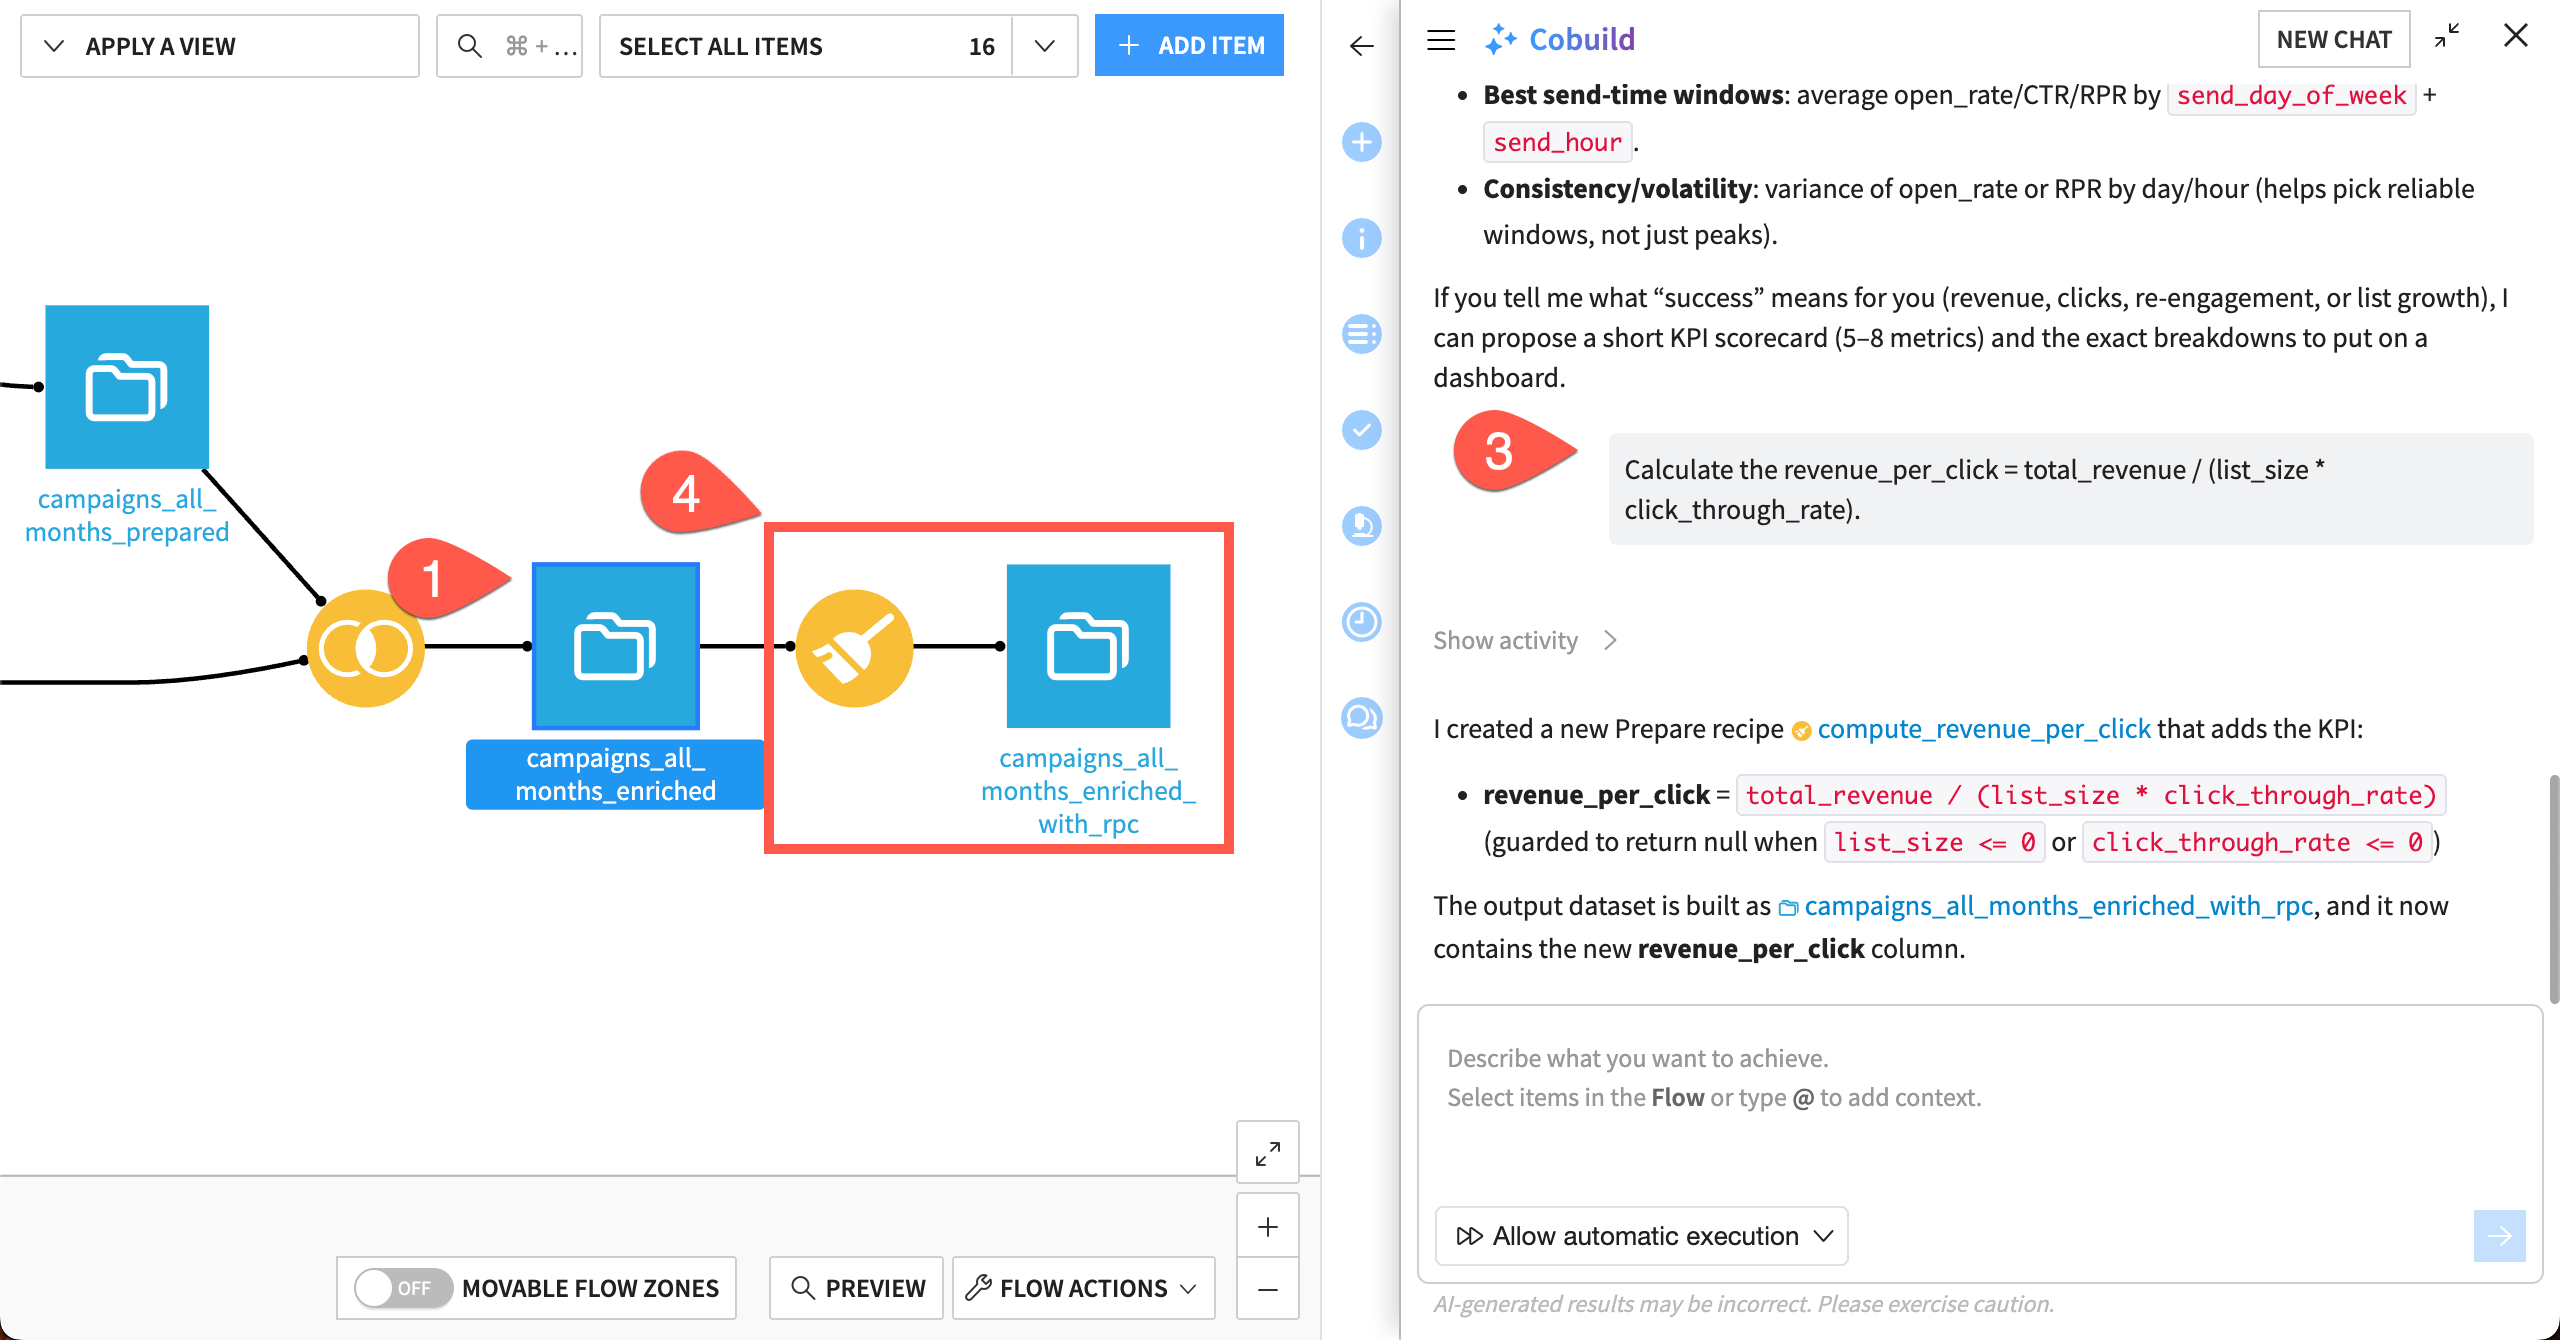
Review the response, then tell Cobuild which KPI to calculate using this prompt:
Calculate the revenue_per_click = total_revenue / (list_size * click_through_rate).
Cobuild might create a new Prepare recipe or modify the previous one. Either way, check the recipe and output dataset to verify the work.
Experiment with analysis#
After the data is prepared, run some quick analysis using Cobuild.
Interpret KPIs#
First, look at the KPI you created, in a new Cobuild chat.
In the Cobuild window, click New Chat.
This time, you’ll give Cobuild the context dataset using the
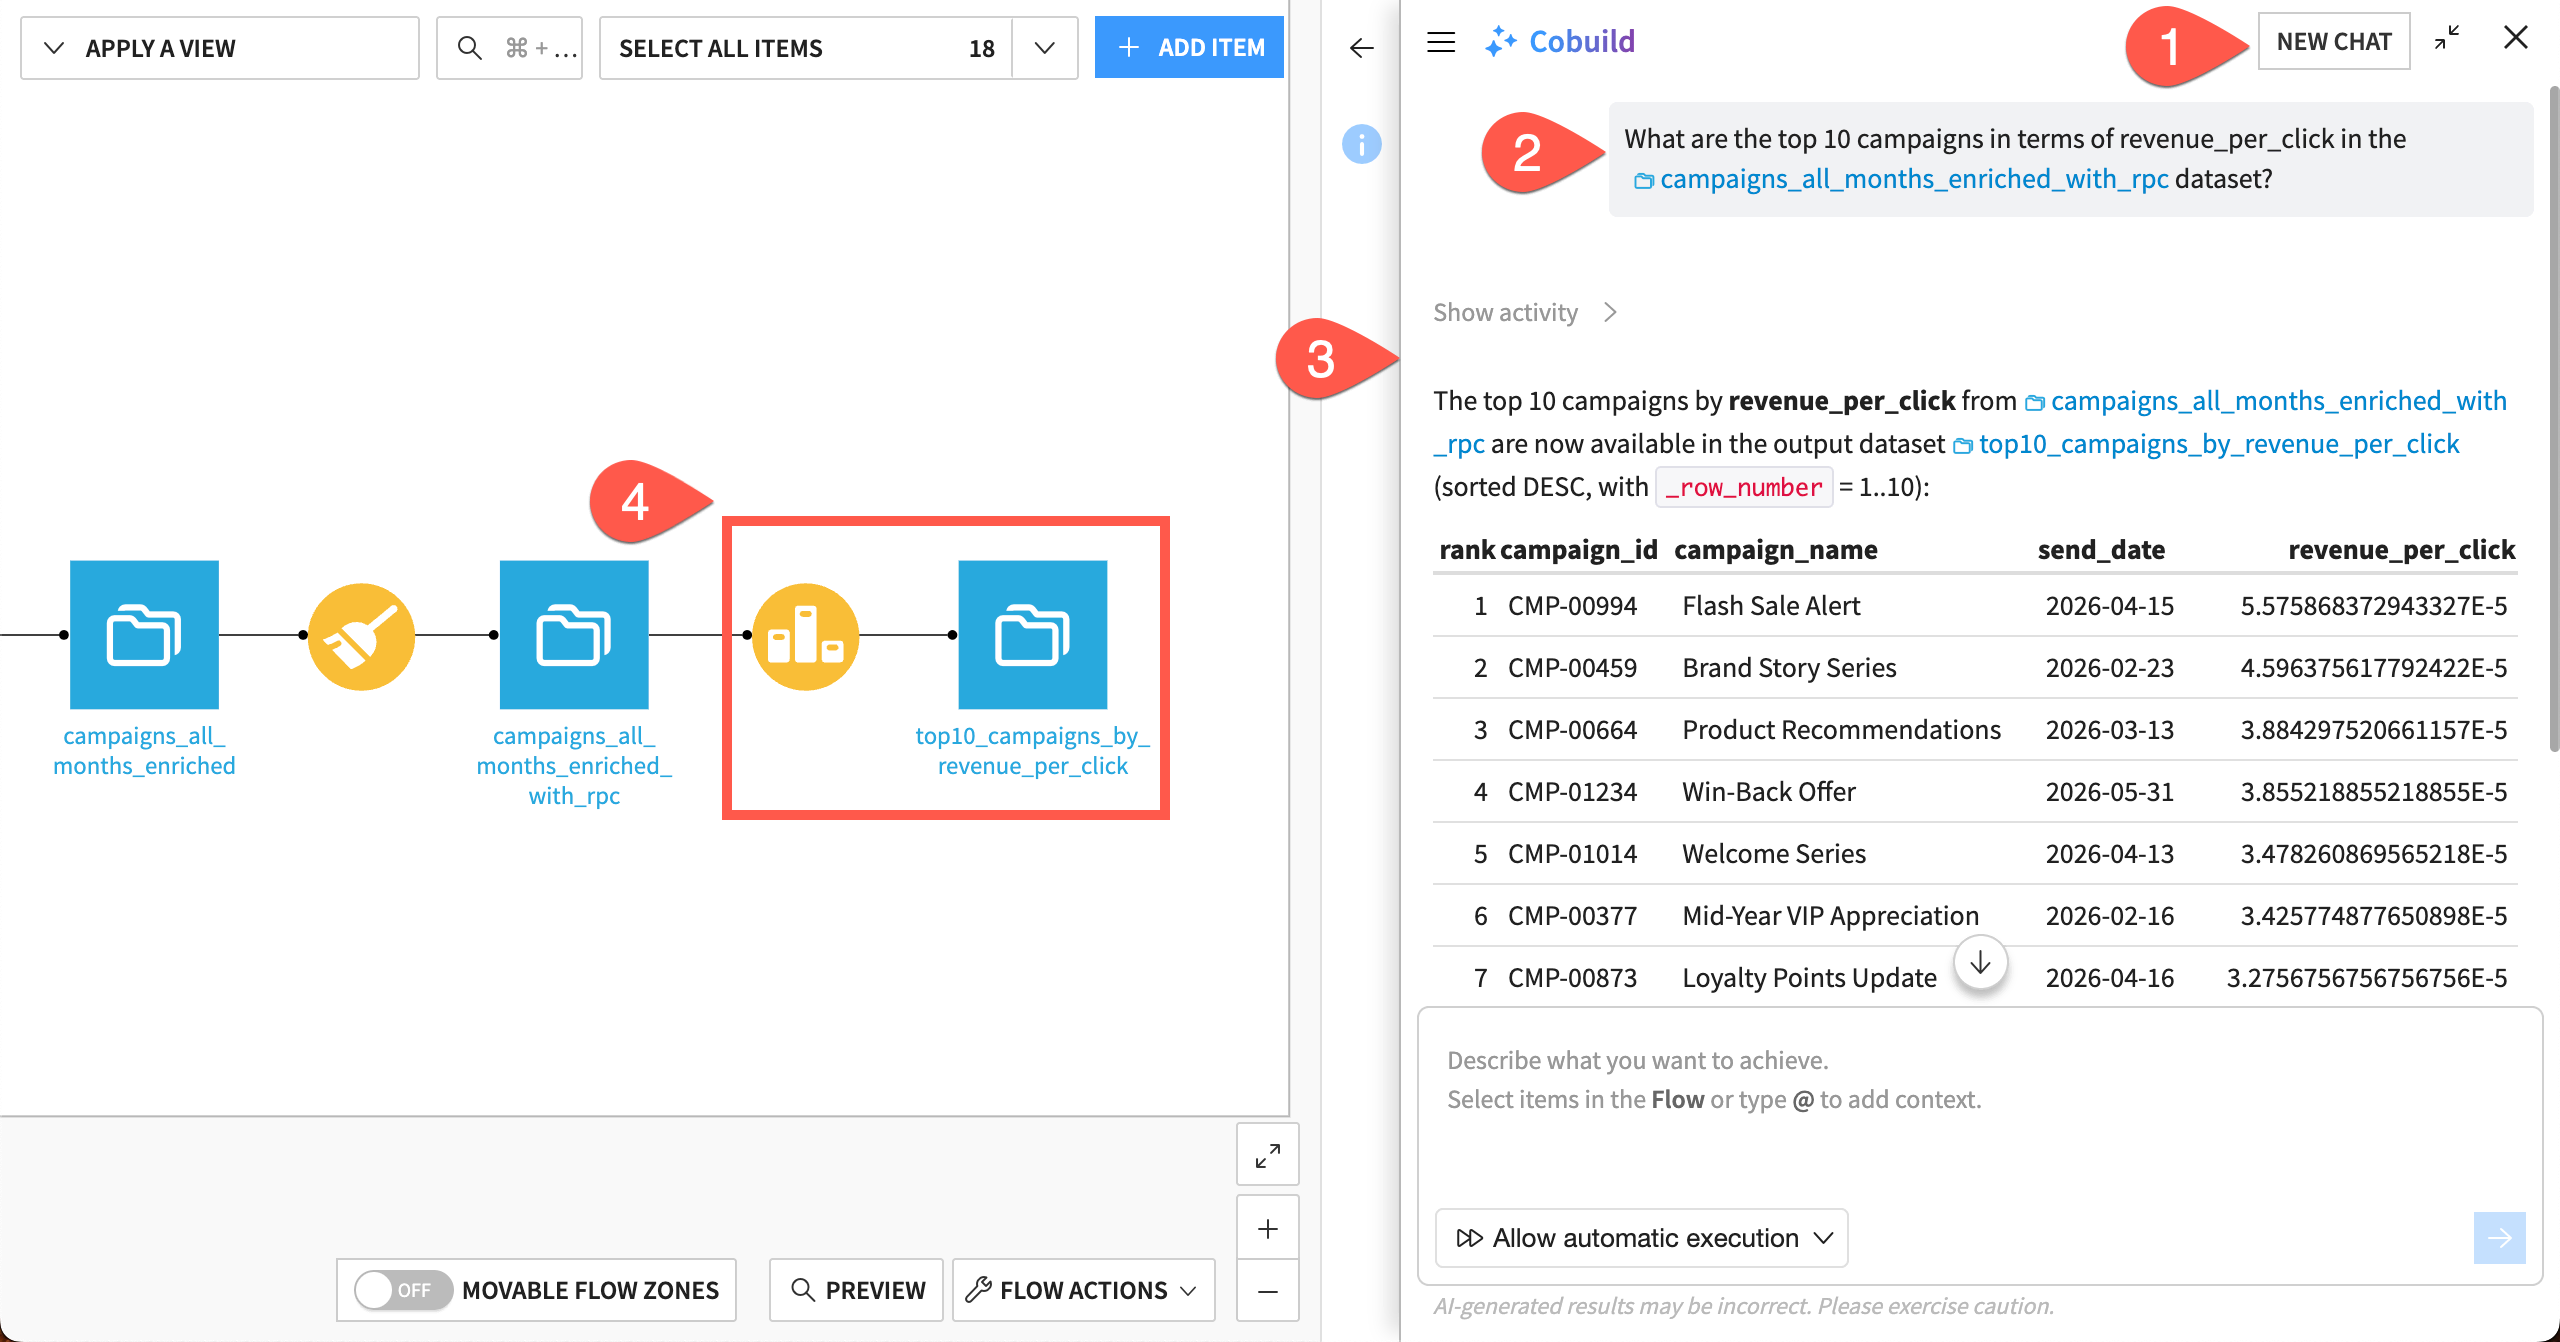
@symbol in the prompt. Copy and paste this prompt (updating the name of the dataset if needed):What are the top 10 campaigns sorted by the highest revenue_per_click in the @campaigns_all_months_enriched_with_rpc dataset?
Review the response and the activity.
In the Flow, explore the new objects Cobuild might have created to make the calculation (which could be a Top N recipe and output dataset).
Note
Depending on the actions Cobuild takes, you might see results of the query without new objects in the Flow.
While it’s interesting to see these top performers, it might be more useful to understand the characteristics of these campaigns.
Ask Cobuild:
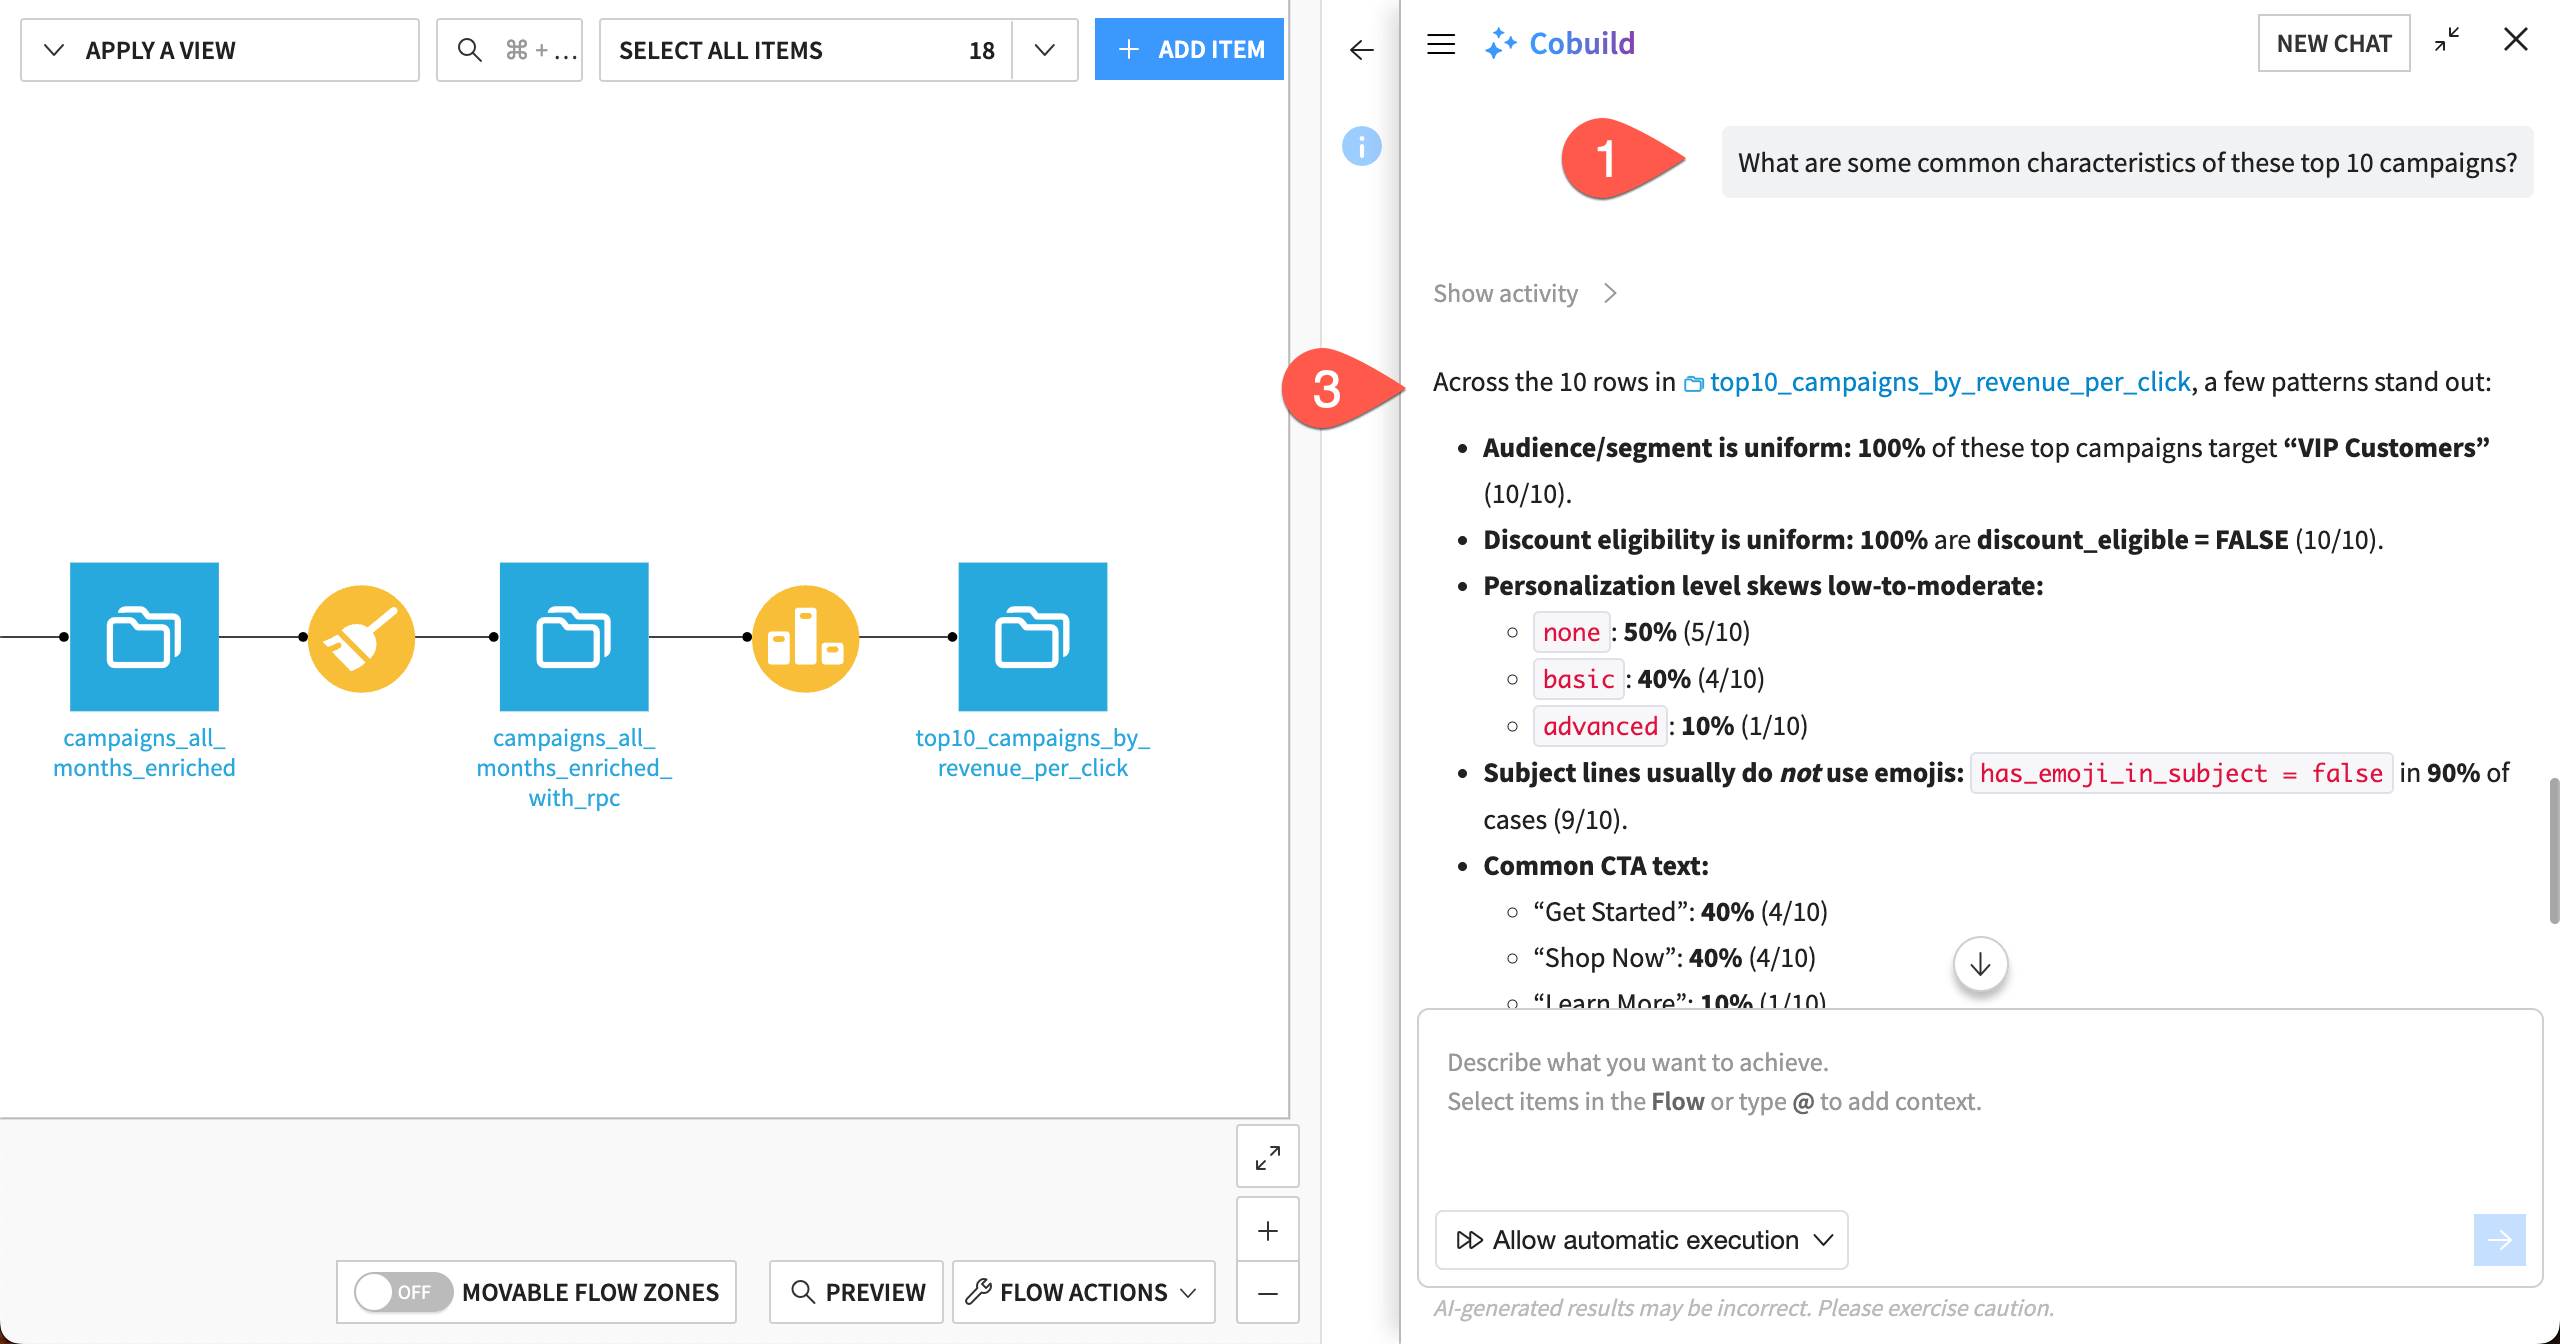
What are some common characteristics of these top 10 campaigns?
Watch the activities as Cobuild works. This query might look simple, but it requires multiple calculations!
Review the response. Cobuild might provide some text or charts to answer the question.
Create a chart#
You might also want to specify some charts for Cobuild to make. You can then save the charts for use later.
Ask Cobuild:
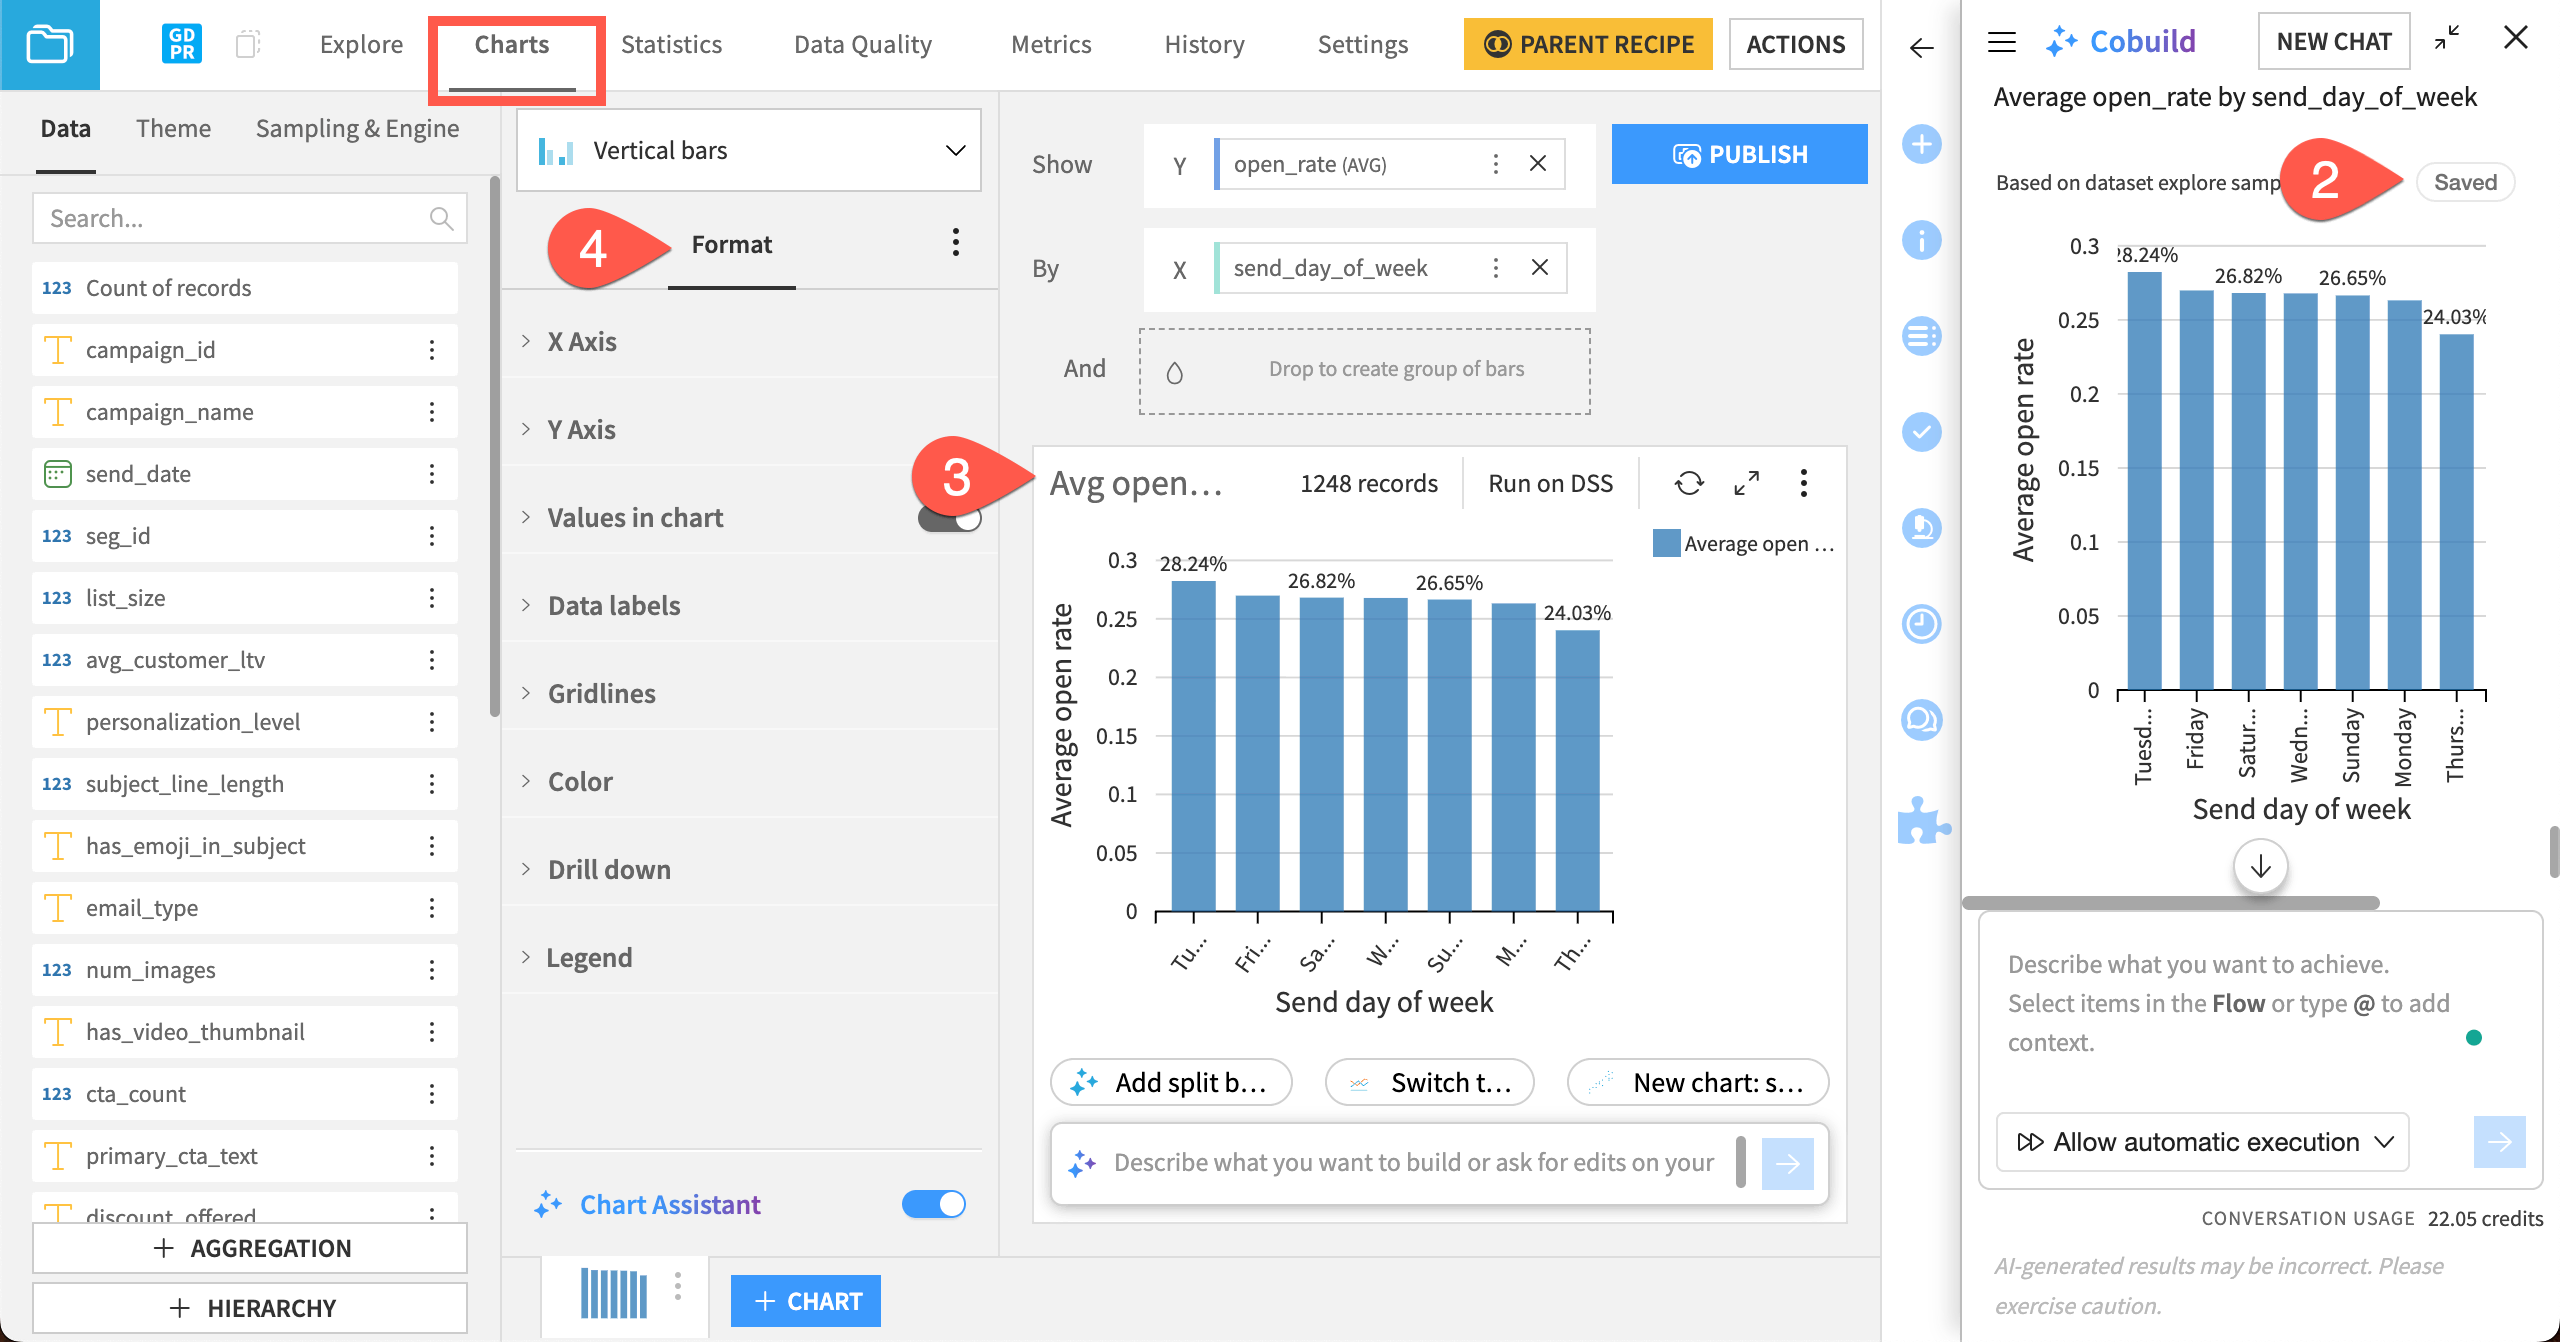
Create a bar chart showing the average open_rate by send_day_of_week in the @campaigns_all_months_enriched dataset.
After it responds, click Save at the top of the bar chart. This brings up the Charts tab of the dataset, where the chart is saved and you can make changes.
In the chart window, double-click on the chart title, and rename it
Avg open rate.Make any other formatting changes you’d like!
Manage the project#
Cobuild can also help you manage, organize, and document your project.
Thus far, Cobuild has created several recipes and output datasets. They’re likely all in the same original Flow zone, Monthly campaign data.
First, create a new Flow zone for the data preparation steps.
Return to the Flow.
In the Cobuild window, click New Chat.
Ask Cobuild:
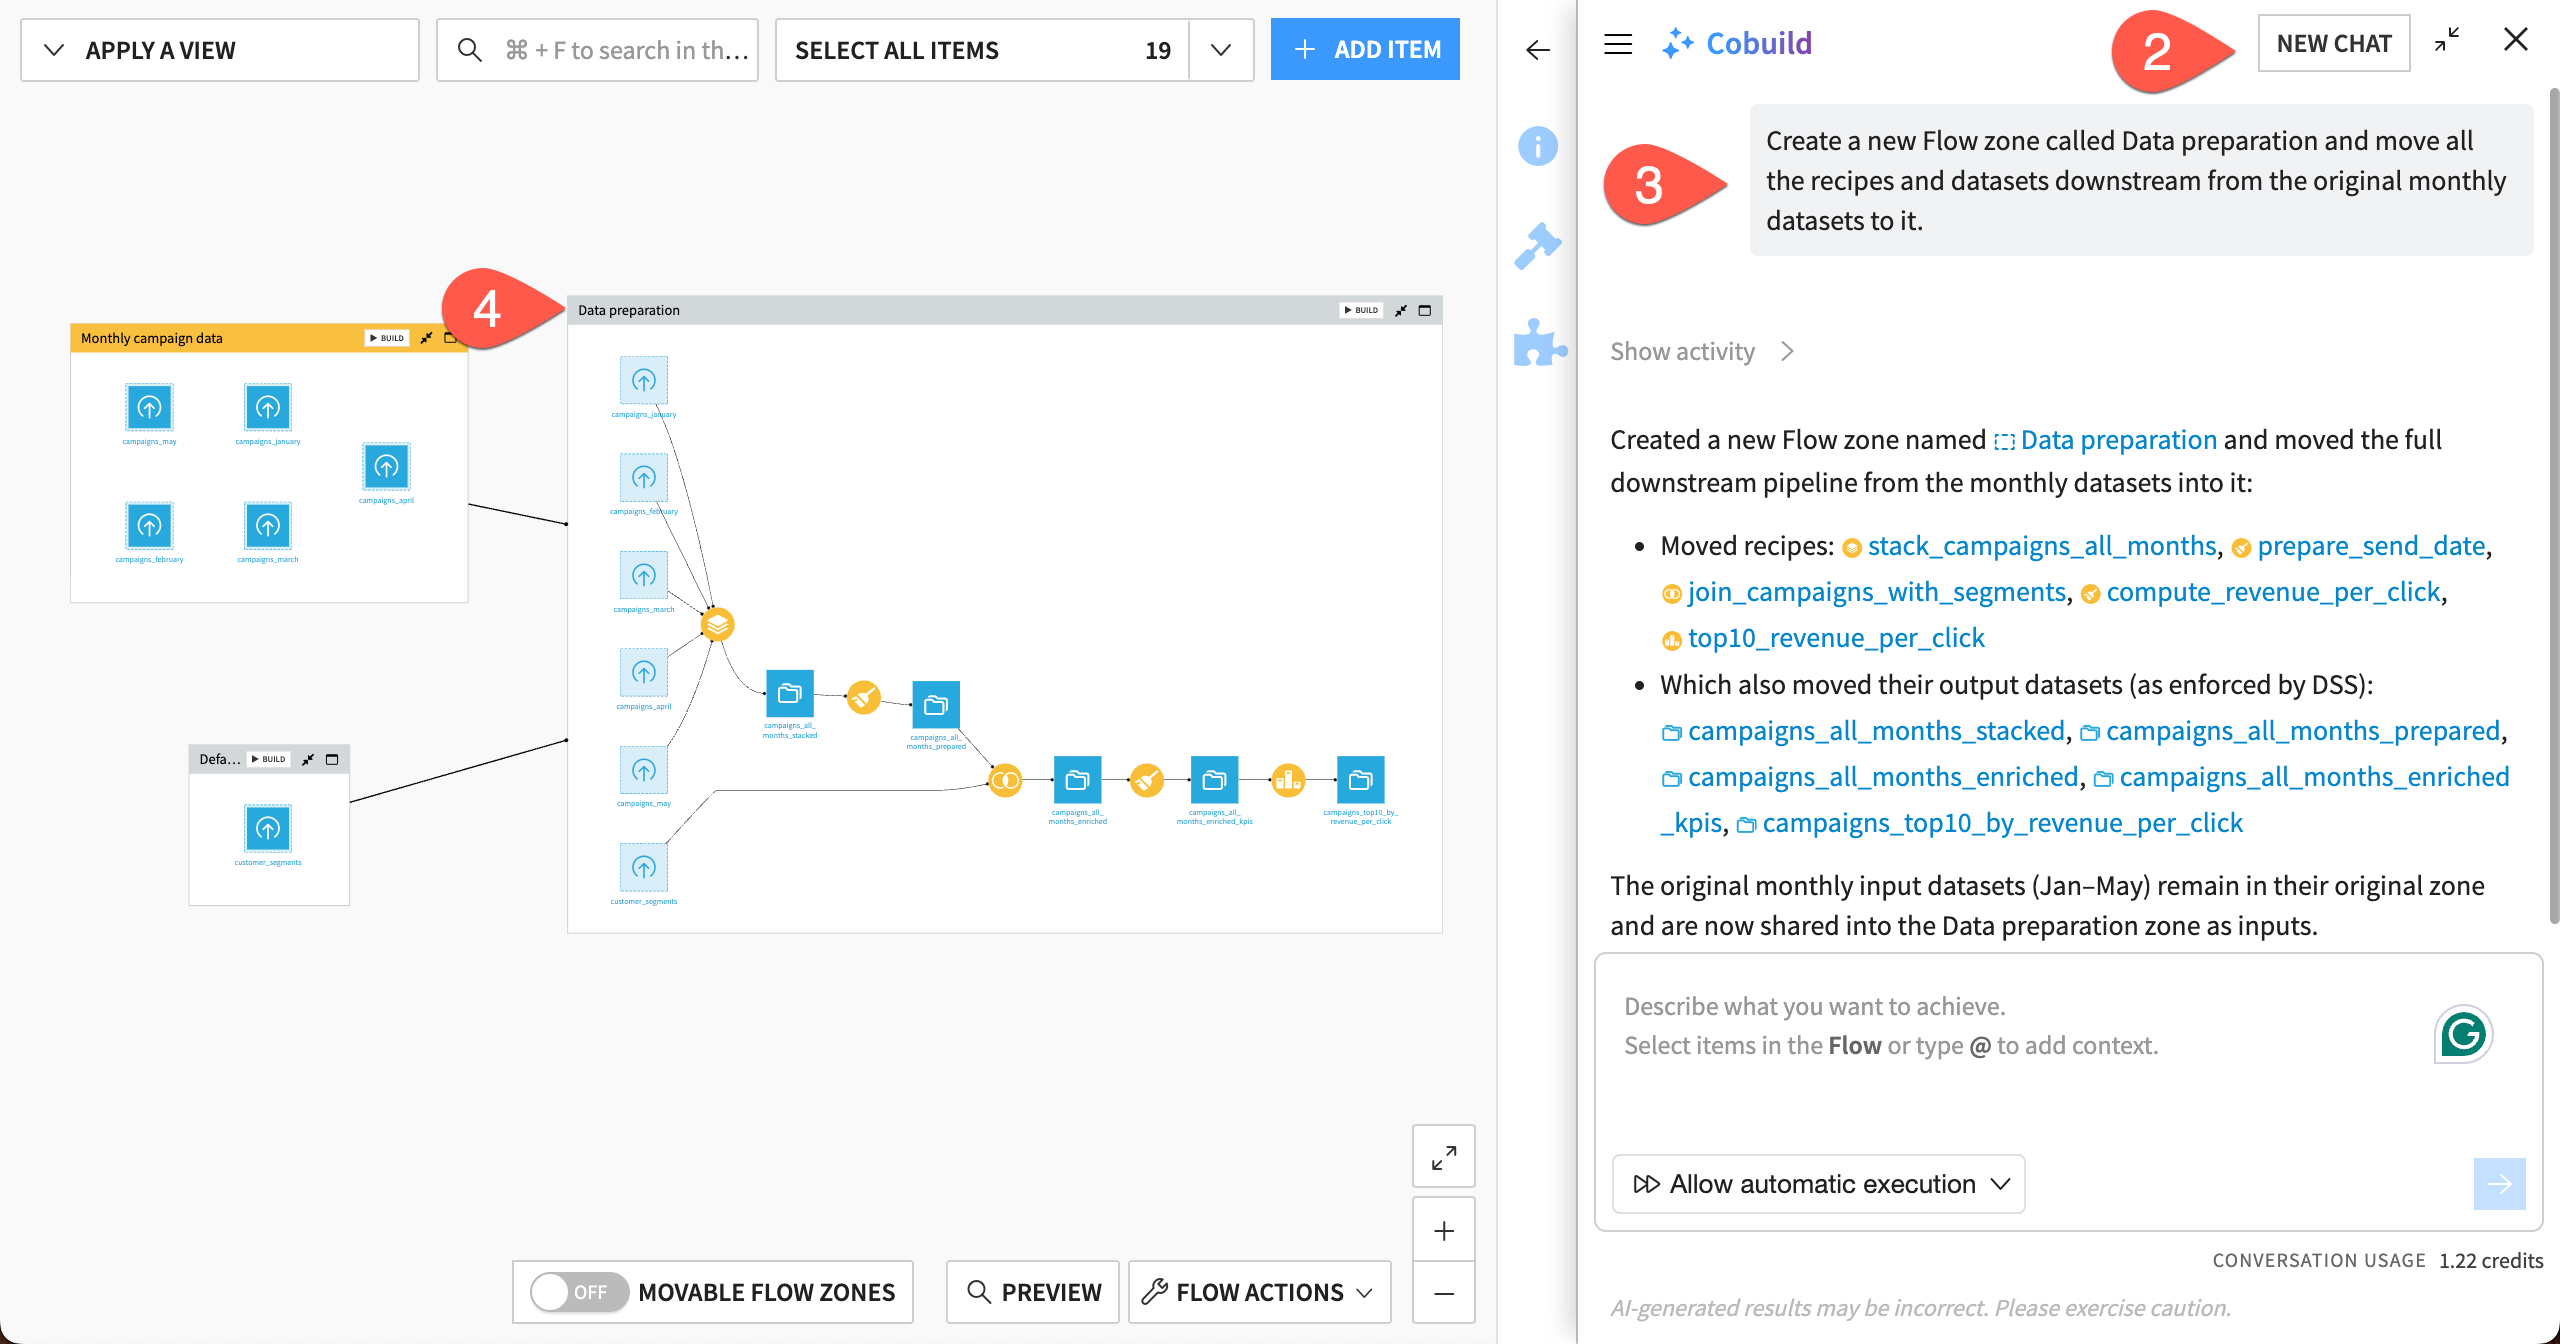
Create a new Flow zone called Data preparation and move all the recipes and datasets downstream from the original monthly datasets to it.
Observe the results. If Cobuild has misplaced any items, you can manually move them to a Flow zone by right clicking on them.
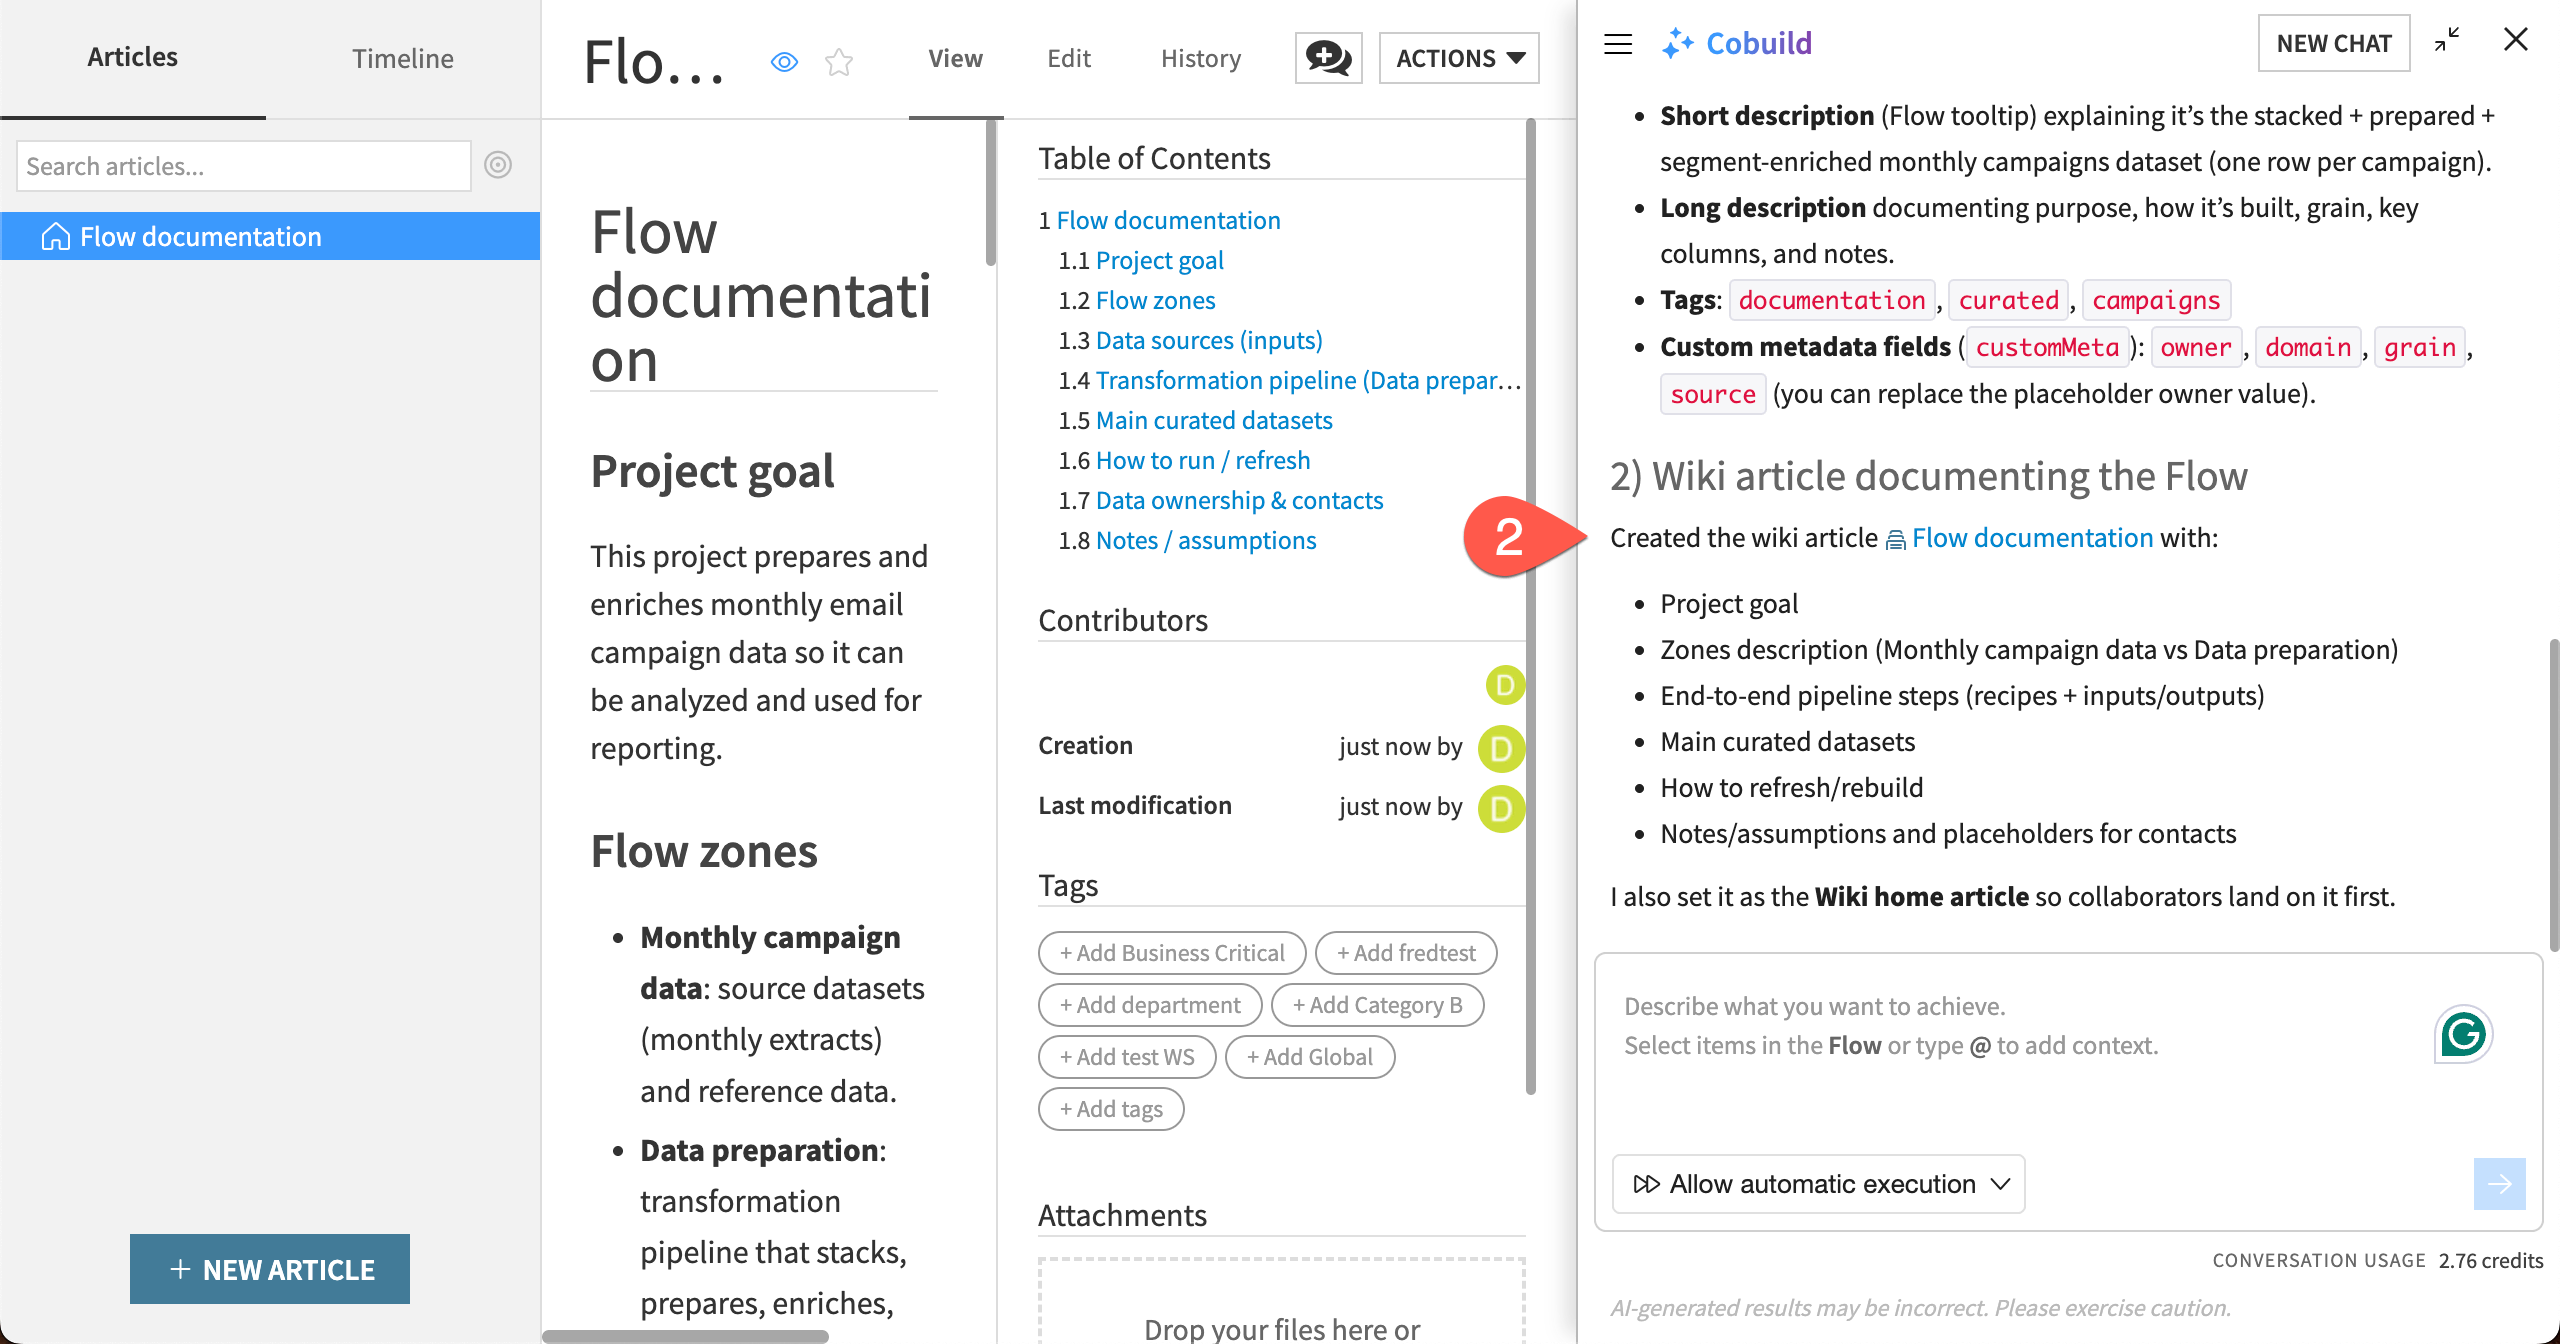
Next, instruct Cobuild to generate documentation for the project.
Ask Cobuild:
I need to create documentation for the project so collaborators can use it.
1. Create metadata for the dataset @campaigns_all_months_enriched.
2. Write a wiki article to document the Flow.
When it’s finished, check the wiki by clicking the link in Cobuild’s response. Or navigate to the Wiki menu (
 ).
).Check the dataset metadata by returning to the Flow, clicking on the dataset campaigns_all_months_enriched and clicking on the Details tab (
 ) of the right panel.
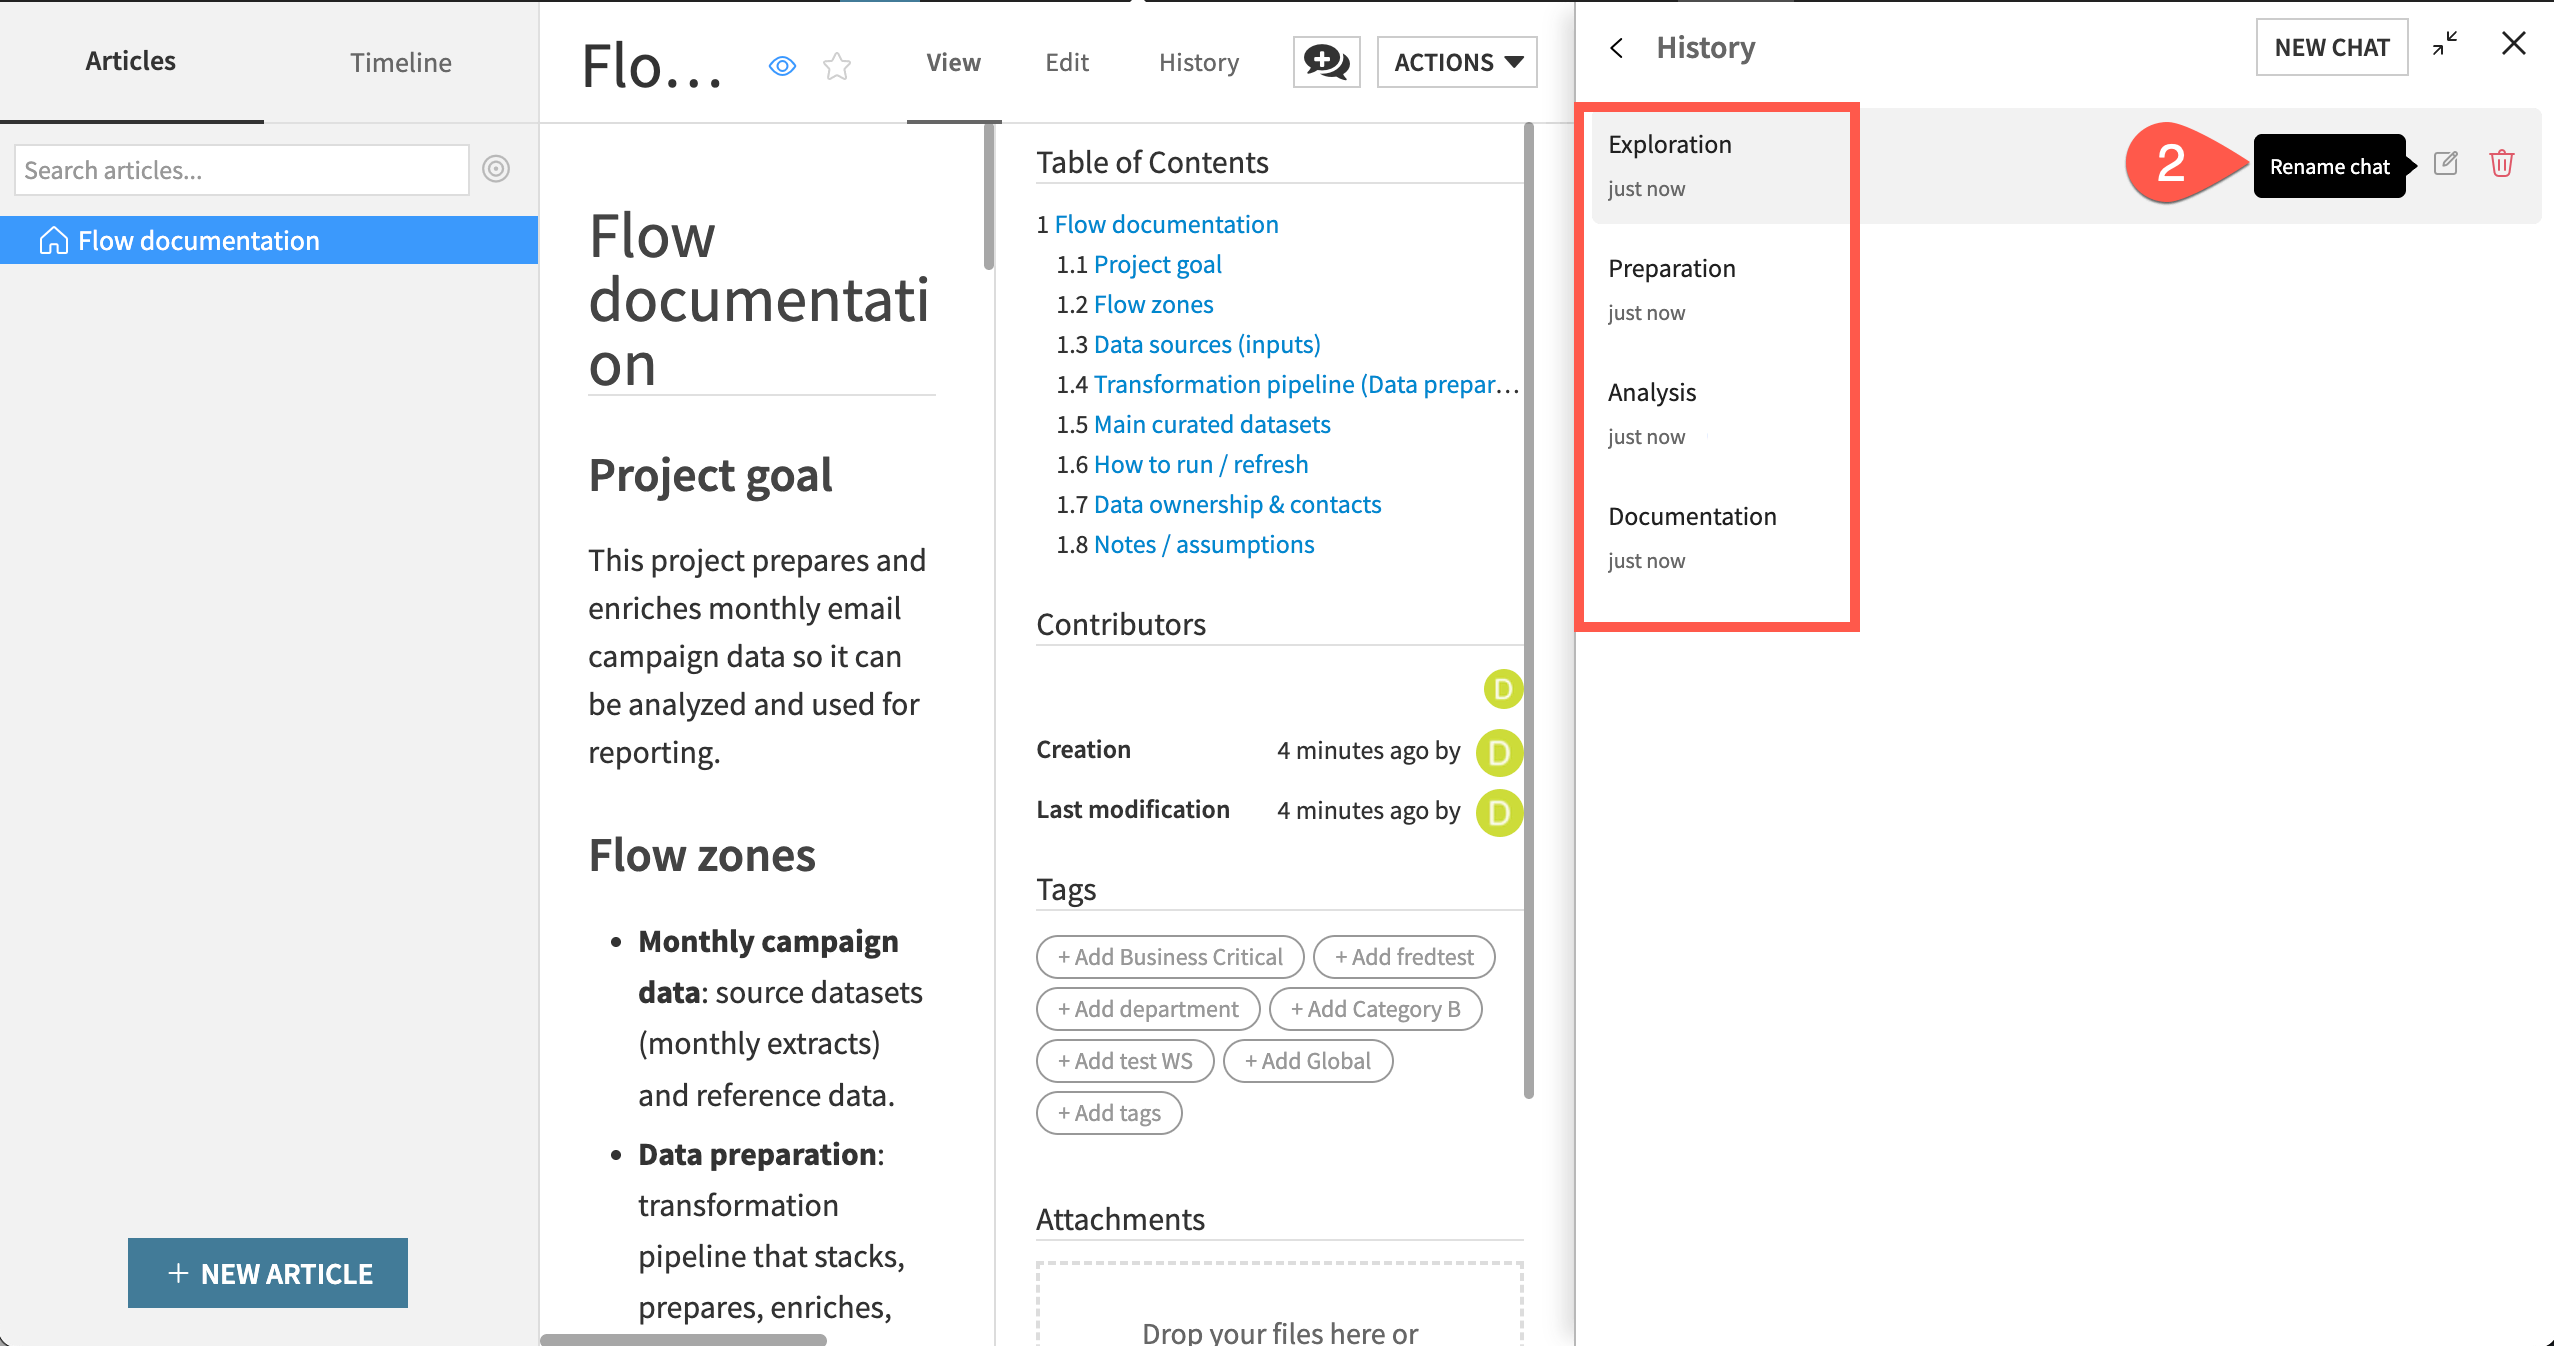
Finally, organize your Cobuild history so you can easily return to conversations later.
In the Cobuild window, click on the list icon (
 ) on the top left.
Rename the chats by hovering over them and clicking the Rename chat icon. From top to bottom, rename them
Documentation,Analysis,Preparation, andExploration.
You now have a full Flow, ready for more analysis and documented for coworkers to use!
Next steps#
This is only the beginning of what you can do with Cobuild! You can continue exploring this project with more analysis.
If your profile allows you to use more Dataiku features, you can also experiment with building machine learning models, code recipes, webapps, or AI agents.