
Tutorial | Python functions in the Prepare recipe#
Get started#
The Prepare recipe contains a library of no-code processors to handle the most common data preparation tasks. However, you can also use the Python function processor to insert custom code into an otherwise visual tool.
Objectives#
In this tutorial, you will:
Insert Python logic into a visual recipe for data preparation.
Understand whether to use cell, row, or rows mode depending on the desired output.
Learn the difference between vectorized and non-vectorized processing within these modes.
Import functions from project libraries into the Prepare recipe.
Create the project#
From the Dataiku Design homepage, click + New Project.
Select Learning projects.
Search for and select Python Functions in the Prepare Recipe.
If needed, change the folder into which the project will be installed, and click Create.
From the project homepage, click Go to Flow (or type
g+f).
Note
You can also download the starter project from this website and import it as a ZIP file.
Use case summary#
For code-based data preparation in Dataiku, a natural pattern is prototyping the transformation in a code notebook and converting it into a code recipe in the Flow.
In many situations however, there’s value in expressing as much of the logic as possible via visual methods. For example, your team may include business users unfamiliar with Python. Or, in a long list of data preparation requirements, perhaps relatively few steps truly require custom code. You may not want to maintain an entire Python recipe for one transformation. In such cases, the Python function processor inside the Prepare recipe may be the right tool for the job.
To explore this processor, the starting data is a fictitious company’s sales data, where one row holds the quarterly sales data per region.
Choose a mode#
To use the Python function processor, the first concept to understand is the three different modes it offers. The different modes cater to what your function will return.
Mode |
Returns |
|---|---|
Cell |
A new cell for each row |
Row |
A row for each row |
Rows |
A list of rows for each row |
Continue the tutorial to work through examples for each mode.
Cell mode#
The Prepare recipe’s processor library includes Dataiku formulas for mathematical, comparison, logical, and conditional operators. The output of these expressions is a new column in the dataset.
The Python function processor’s cell mode is similar. In both cases, you declare one output column. However, instead of a Dataiku formula, you define a Python function to compute the values in that output column.
One value per row#
The basic contract of cell mode is that a process() function receives data and must return one value per row, which Dataiku places into a specified output column.
Start with a simple example:
From the Flow, open the empty Prepare (
 ) recipe.
Click + Add a New Step.
Search for and select
Python function.For the Mode, leave the default cell option.
Name the output column as
max_qtr.For this first example, uncheck the option for Vectorized processing.
Click Edit Python Source Code.
Read the
process()function’s docstring.Observe the preview of the new max_qtr column.
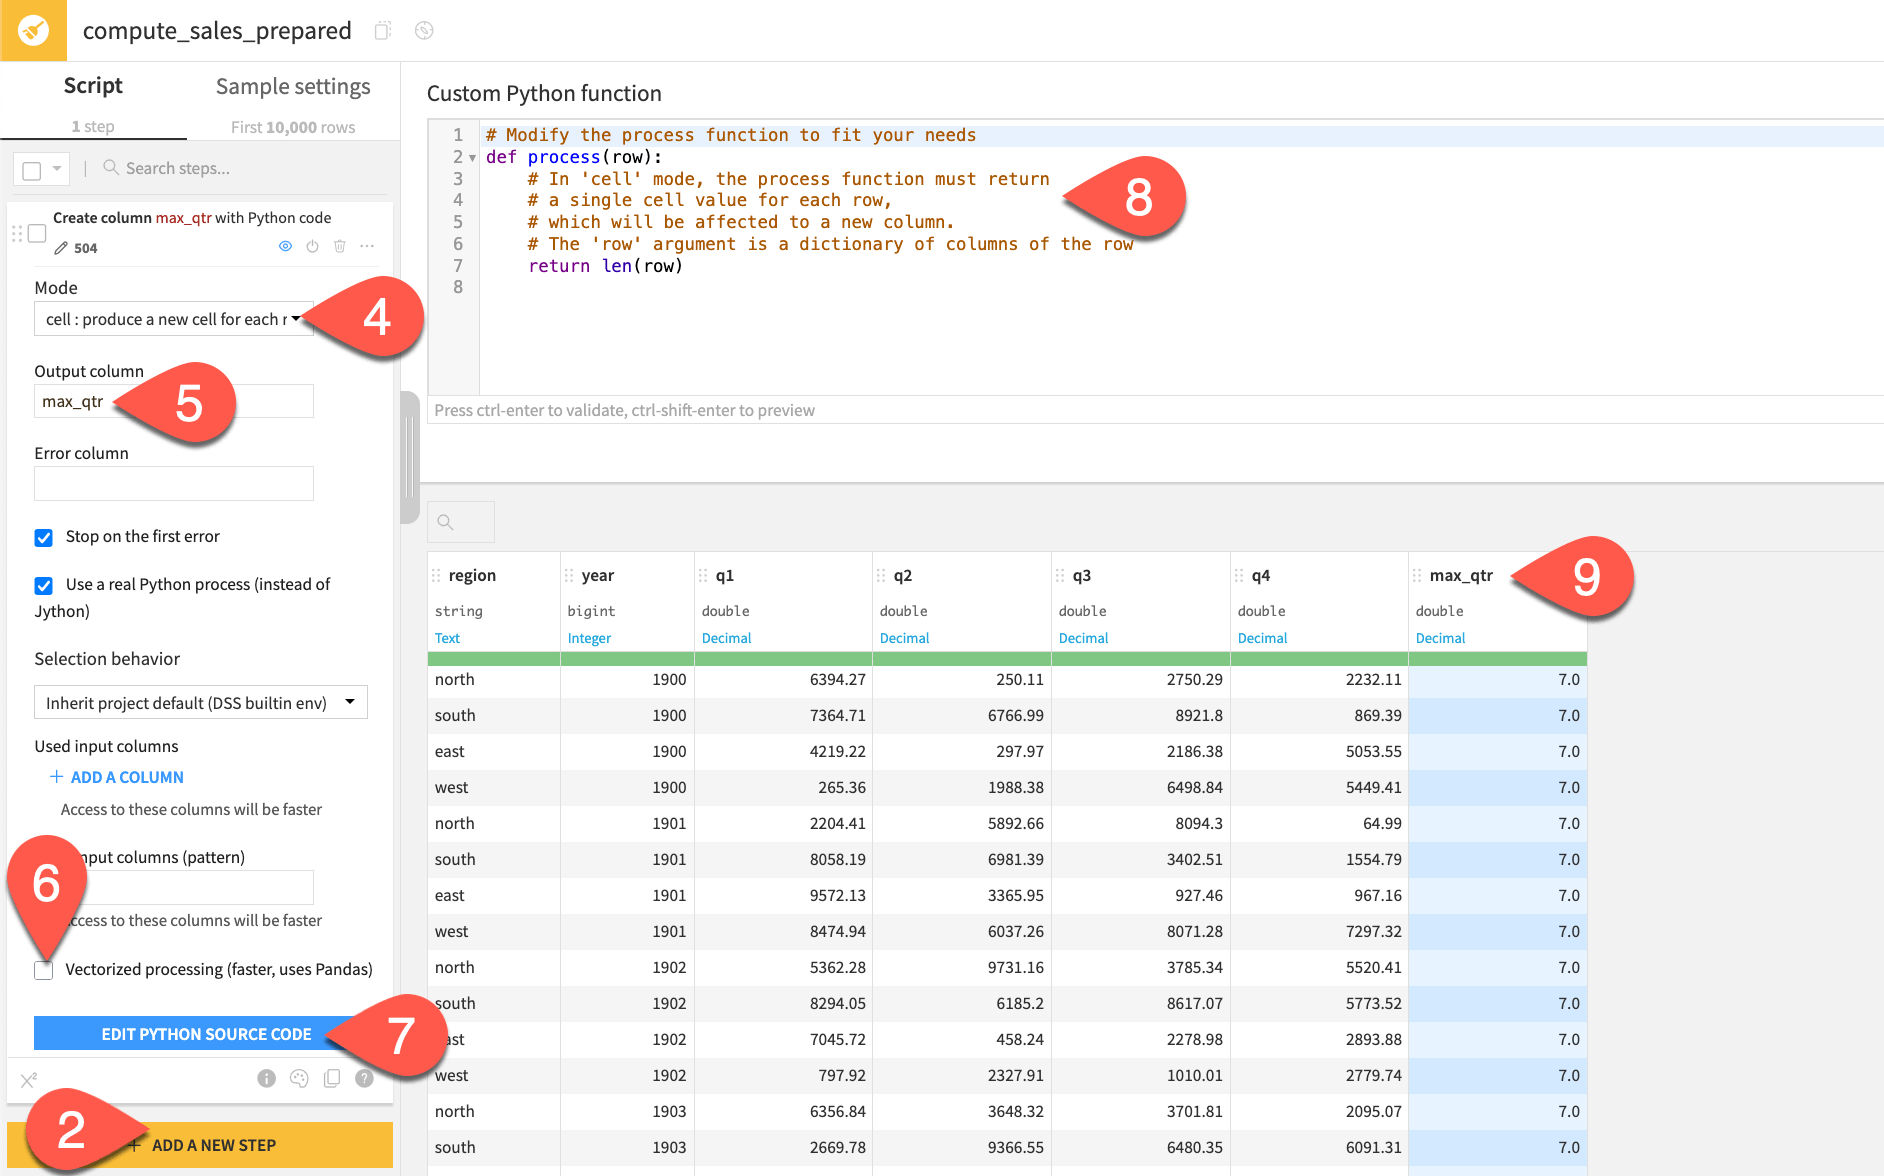
The docstring and the output of the default function reveal important clues about how this step works.
According to the docstring, the input of the process() function is a dictionary of columns of the row. In other words, the columns of the dataset serve as the input dictionary’s keys. The len() function applied to a Python dictionary returns the count of keys. Therefore, for the first row (and every subsequent row), the process() function currently returns the count of the number of columns in the dataset. It writes these values to the max_qtr column.
Now make this function actually return the maximum sales figure for any quarter, per region and year. While a Dataiku formula could do it, Python might be more natural for some.
Replace the
process()function with the following function:import re def process(row): # In 'cell' mode, the process function must return # a single cell value for each row, # which will be affected to a new column. # The 'row' argument is a dictionary of columns of the row q_cols = [col for col in row if re.match(r"^q", col)] max_qtr = max(float(row[col]) for col in q_cols) return max_qtr
Click Preview.
Observe the output in the max_qtr column.
Tip
For closer inspection of the input and outputs throughout this tutorial, try running these examples in a code notebook. From the Code (![]() ) > Code Notebooks page in the top navigation bar, open the Custom Python function test notebook. Run the cells to setup the input data and execute the same functions as the examples here.
) > Code Notebooks page in the top navigation bar, open the Custom Python function test notebook. Run the cells to setup the input data and execute the same functions as the examples here.
Use vectorized processing#
The input dataset to the recipe is only 504 rows. With a non-vectorized function like the one above, that means 504 calls to the process() function. On a dataset this small, executing simple instructions, that’s not a problem. However, if running more computationally intensive logic against a larger dataset, your Python function could be a bottleneck in the Flow.
For greater efficiency, you’ll likely want to vectorize your function. Instead of one row at a time (like a Python loop), you can compute an entire batch (a block of rows) at once.
Try this now:
In the Prepare recipe, add another Python function step.
Name the output column
max_qtr_vectorized.This time, leave Vectorized processing toggled on.
Note the default Vector size (the number of rows bundled together in each function call).
Click Edit Python Source Code.
Note the difference in the docstring and starter code. The input is now
rows(instead ofrow), and the function returns a pandas series instead of a scalar.Note how the preview of the max_qtr_vectorized output remains a count of columns.
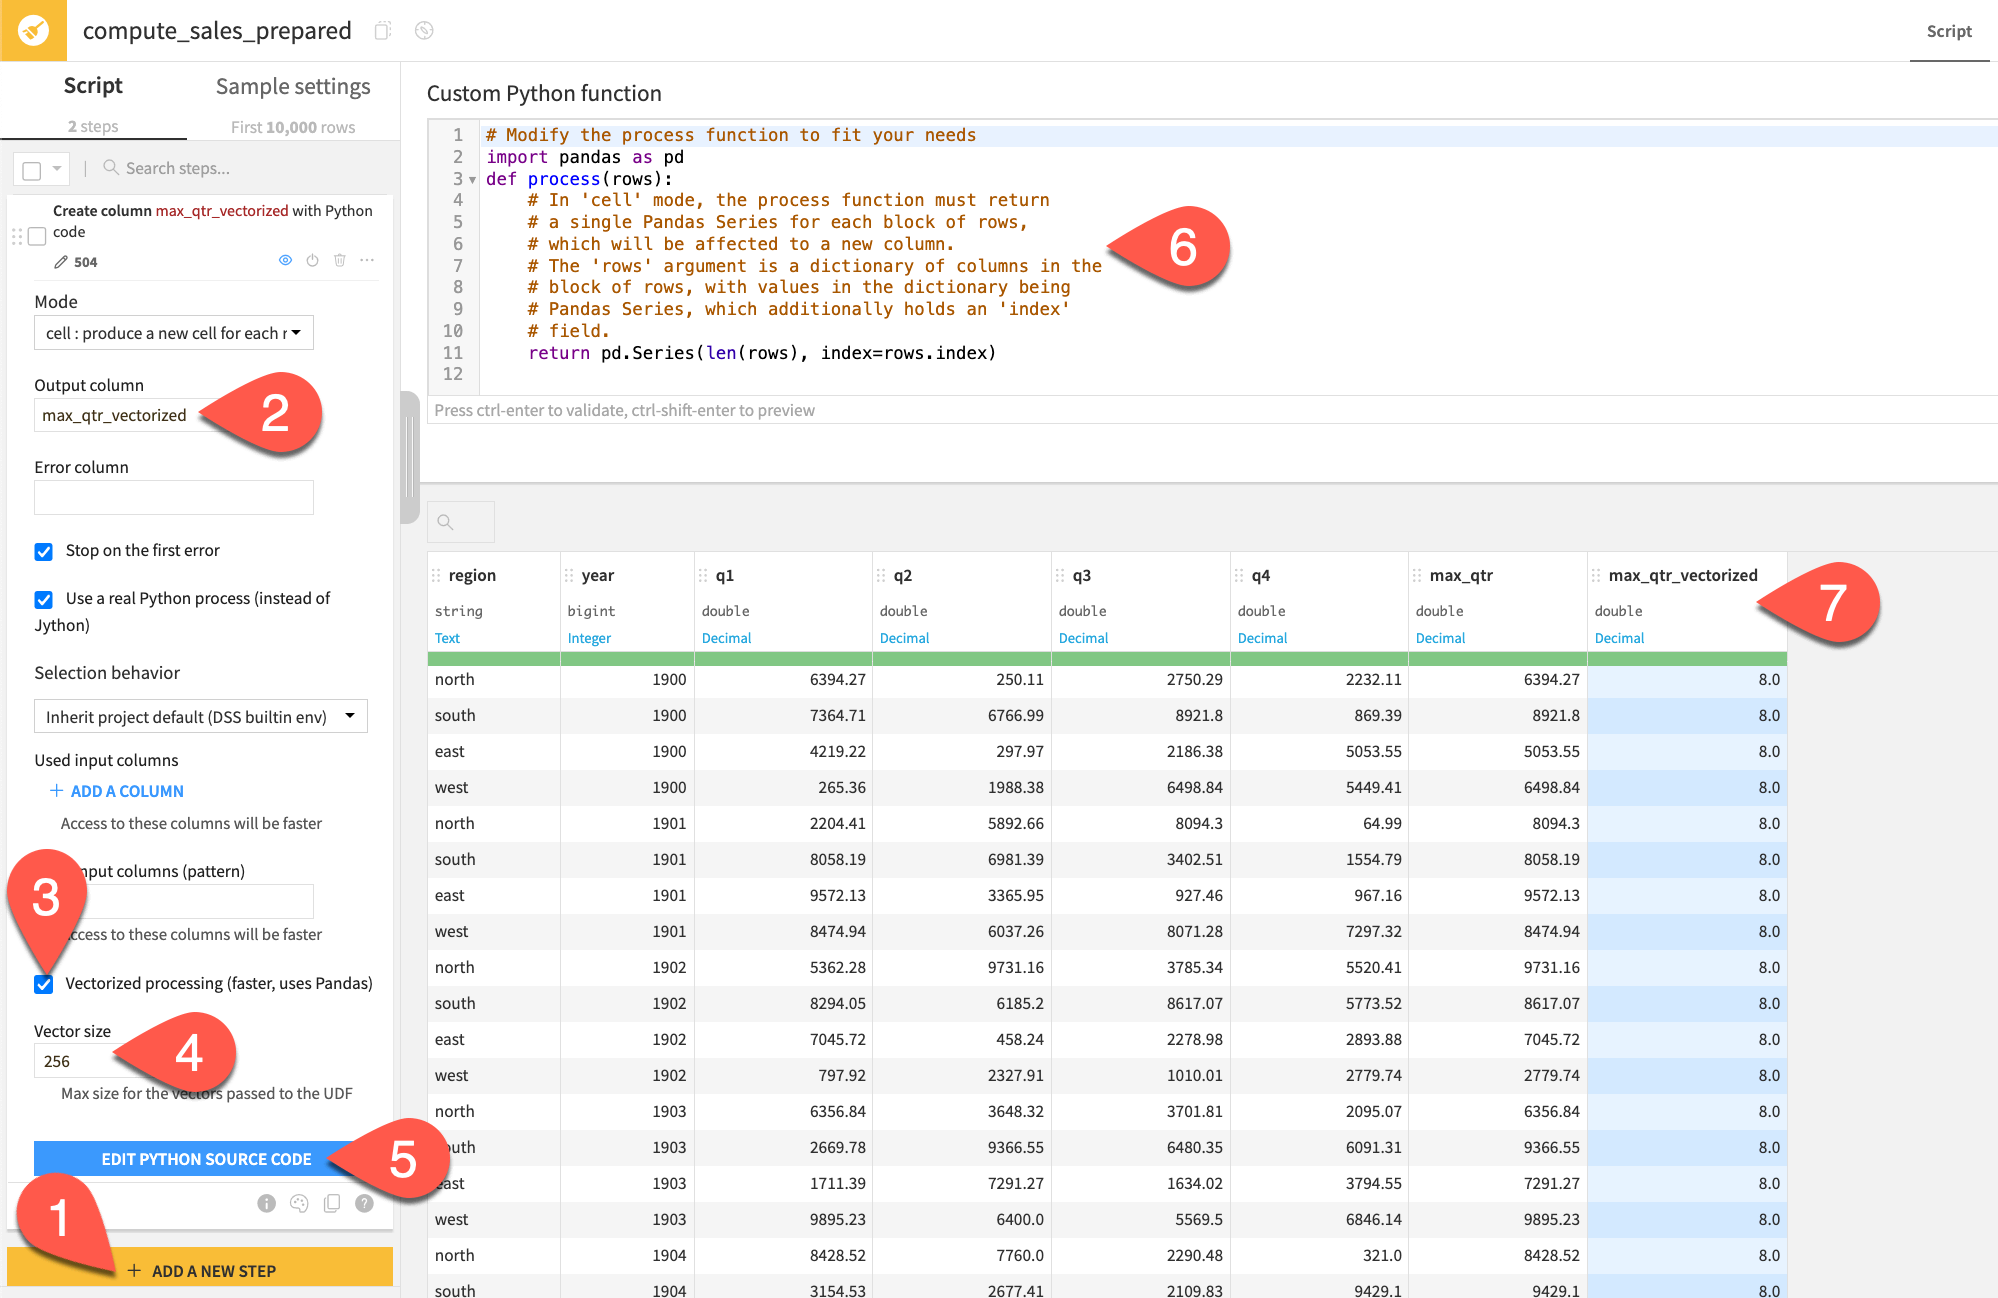
The default non-vectorized function returned len(row), whereas the vectorized version returned pd.Series(len(rows), index=rows.index). The result is the same, but the underlying differences are important:
Non-vectorized |
Vectorized |
|
|---|---|---|
|
once per row |
once per block of rows |
Input dictionary |
|
|
Write |
standard Python (loops) |
pandas operations |
For large datasets |
slower |
faster |
Now try a vectorized version of the same function for finding the maximum sales figure.
In the second Python function step, replace the
process()function with the one below.import pandas as pd import re def process(rows): # In 'cell' mode, the process function must return # a single Pandas Series for each block of rows, # which will be affected to a new column. # The 'rows' argument is a dictionary of columns in the # block of rows, with values in the dictionary being # Pandas Series, which additionally holds an 'index' # field. q_cols = [rows[col] for col in rows if re.match(r"^q", col)] max_qtr = pd.concat(q_cols, axis=1).max(axis=1) return max_qtr
Click Preview.
Observe how the output in the max_qtr_vectorized column matches that in the max_qtr column.
Tip
For even greater efficiency, add the input columns found in your function to the Used input columns field of the processor.
Import from project libraries#
You may find it difficult to write and maintain code directly within the Prepare recipe step. Project libraries are a key space for maintaining and sharing code within Dataiku. The starter project includes a file for the same function above. Instead of writing code in the editor, you can import code into the step.
In the top navigation bar, go to Code (
 ) > Libraries (or
 g+l).Find the file
/python/my_process_functions.py, and confirm it’s the same vectorized cell mode function.Return to the Prepare recipe.
In the step creating the max_qtr_vectorized column, click Edit Python Source Code.
Replace the code with the import statement below:
from my_process_functions import process_max_qtr
Click Preview.
Confirm the code returns the same output.
See also
Instead of a file in a project library, the code could also come from a Git repository or another Dataiku project. Start with Concept | Shared code to learn more.
Row mode#
Cell mode returns one value per row in one output column. You might however want to create multiple new columns at once. You might also need to modify existing columns, performing many operations in place. Row mode allows you to replace an entire row of the dataset with one new row.
In the same Python recipe, add another Python function step.
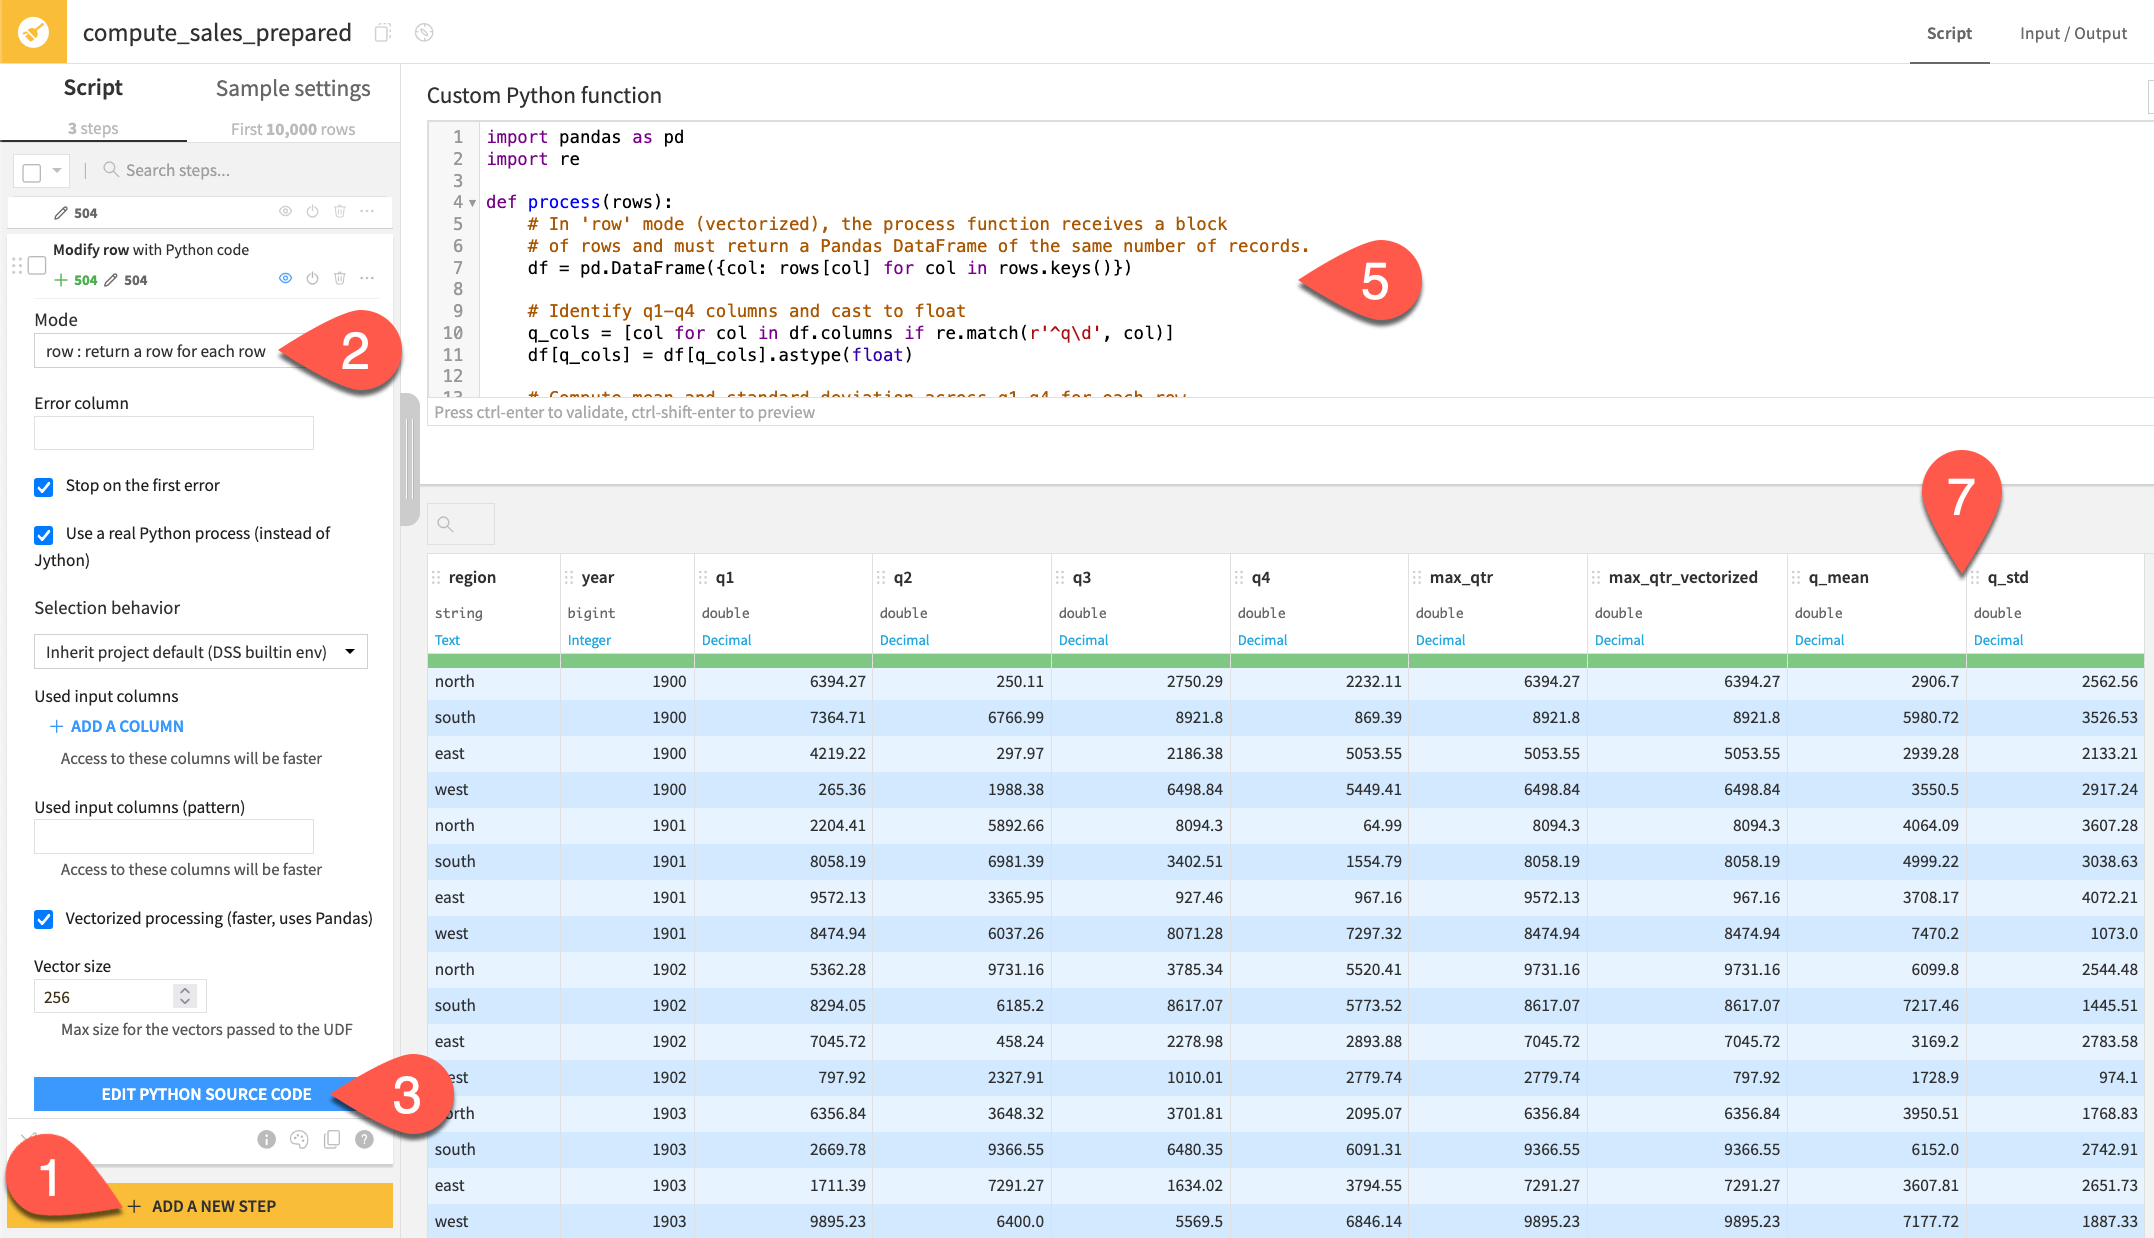
Switch the Mode to row : return a row for each row, noting the removal of the output column field from the processor options.
Click Edit Python Source Code.
Read the docstring and default function, and observe the new columns.
Replace the default code with the function below to compute the mean and standard deviation of any quarterly sales columns:
import pandas as pd
import re

def process(rows):
    # In 'row' mode (vectorized), the process function receives a block
    # of rows and must return a Pandas DataFrame of the same number of records.
    df = pd.DataFrame({col: rows[col] for col in rows.keys()})

    # Identify q1-q4 columns and cast to float
    q_cols = [col for col in df.columns if re.match(r'^q\d', col)]
    df[q_cols] = df[q_cols].astype(float)

    # Compute mean and standard deviation across q1-q4 for each row.
    df['q_mean'] = df[q_cols].mean(axis=1).round(2)
    df['q_std'] = df[q_cols].std(axis=1).round(2)

    return df
Click Preview.
Since the function replaces the entire row, note how the output preview highlights all columns in blue (not only the additions of q_mean and q_std).
Rows mode#
The most complex mode is rows mode. In this mode, you replace an existing row with one or more rows as output. This is especially useful when you need to transform your data from wide to long format.
In the same Python recipe, add another Python function step.
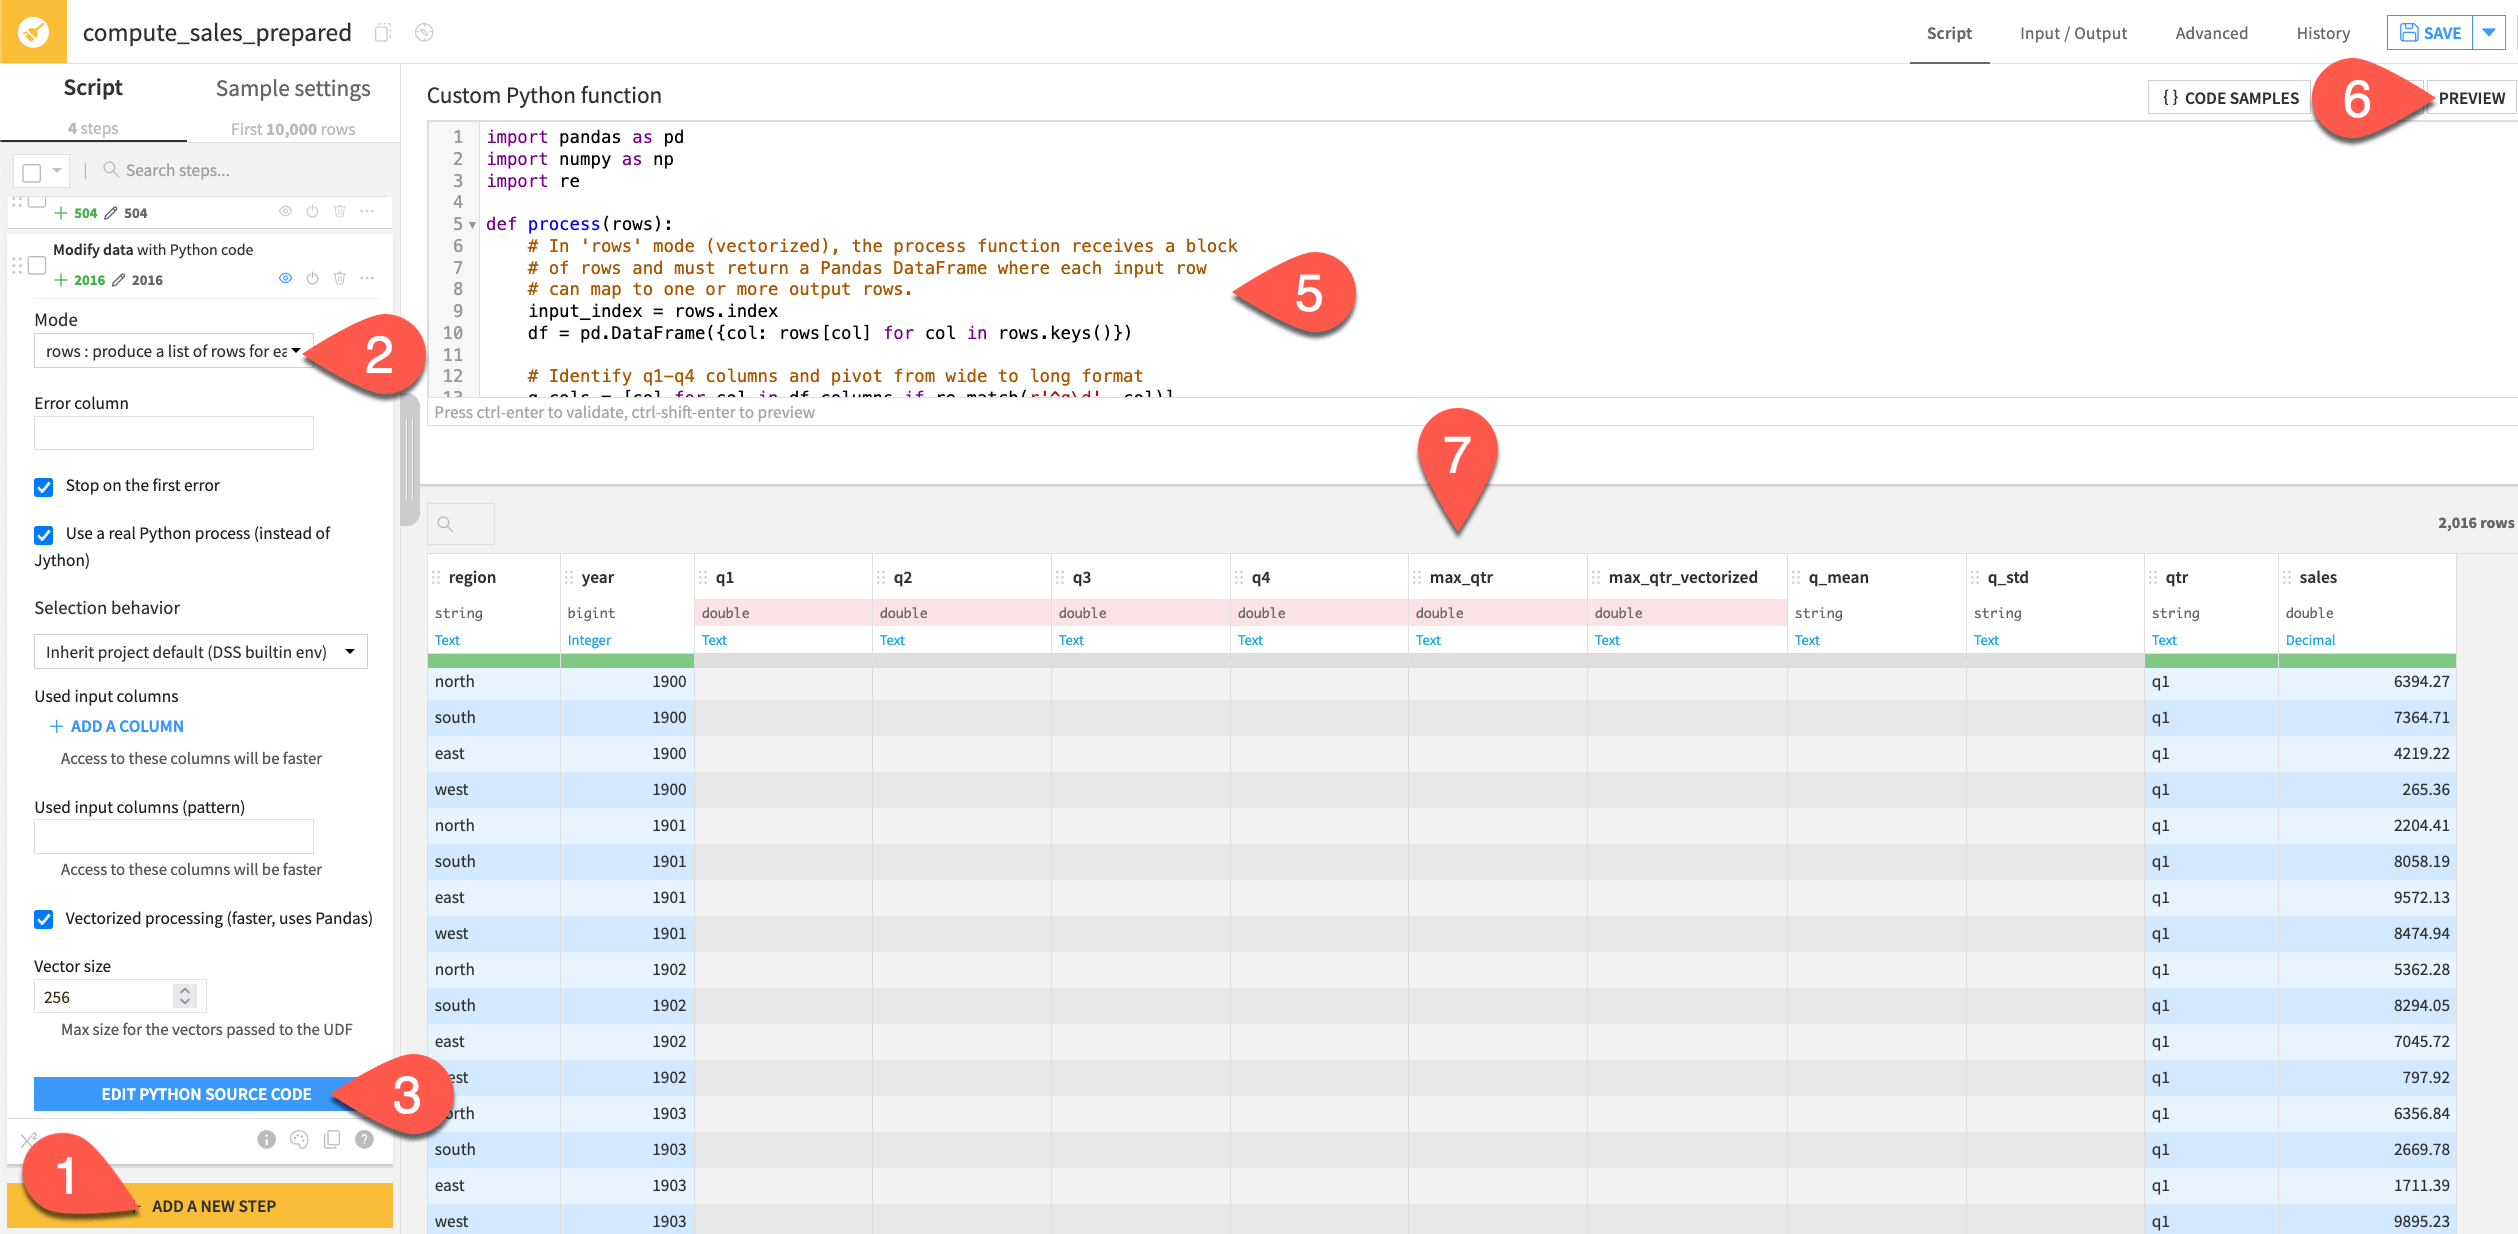
Switch the Mode to rows : produce a list of rows for each row.
Click Edit Python Source Code.
Read the docstring and default function, and observe the new columns.
Replace the default code with the function below:
import pandas as pd
import numpy as np
import re

def process(rows):
    # In 'rows' mode (vectorized), the process function receives a block
    # of rows and must return a Pandas DataFrame where each input row
    # can map to one or more output rows.
    input_index = rows.index
    df = pd.DataFrame({col: rows[col] for col in rows.keys()})

    # Identify q1-q4 columns and pivot from wide to long format
    q_cols = [col for col in df.columns if re.match(r'^q\d', col)]
    result = df[['region', 'year'] + q_cols].melt(
        id_vars=['region', 'year'],
        value_vars=q_cols,
        var_name='qtr',
        value_name='sales'
    )
    result['sales'] = result['sales'].astype(float)

    # Each input row maps to len(q_cols) output rows
    result.index = np.repeat(input_index, len(q_cols))

    return result
Click Preview.
Review the new long format dataset.
See also
For no-code wide to long transformations, try a Pivot recipe.
Next steps#
Congratulations on taking your first step toward using Python inside a Prepare recipe—a powerful combination of code and no-code tools!
See also
For more information, see the reference documentation on the Python function processor.