
Solution | Churn Prediction#
Overview#
Business case#
Customer acquisition is costly, yet disengagement is silent and frequent. Companies often lose customers not through explicit product cancellations, but through inactivity—unused products, zero balances, or stopped revenue streams.
Identifying customers or products at the highest risk of churn enables proactive retention strategies, safeguarding both customer lifetime value and brand trust.
Installation#
From the Design homepage of a Dataiku instance connected to the internet, click + Dataiku Solutions.
Search for and select Churn Prediction.
If needed, change the folder into which the Solution will be installed, and click Install.
Follow the modal to either install the technical prerequisites below or request an admin to do it for you.
Note
Alternatively, download the Solution’s .zip project file, and import it to your Dataiku instance as a new project.
Technical requirements#
To use this Solution, you must meet the following requirement:
Have access to a Dataiku 14.0+* instance.
Data requirements#
The Solution is shipped with synthetically generated data relevant to a Retail Banking use case.
The input data has five already prepared datasets covering 16 months of historical banking data that include:
Dataset |
Description |
|---|---|
revenues |
Includes the revenues generated by each product per customer over time. |
product_holdings |
Includes product information and duration period of each product held by customers. |
customers |
Includes customers’ static information. You can add optional columns to this dataset. |
balances |
Includes balance amounts of each product per customer over time. |
additional_information |
Includes optional additional columns. |
Workflow overview#
You can follow along with the Solution in the Dataiku gallery.
The project has the following high-level steps:
Prepare your dataset in the same data model format as mentioned, ensuring that mandatory column names match exactly, and connecting your data as input.
Explore the Flow, and if needed, adjust the churn definition to fit your business case.
Predict churn at both product level and customer level.
Visualize customers and products that are at Risk in the Churn dashboards.
Walkthrough#
Note
In addition to reading this document, it’s recommended to read the wiki of the project before beginning to get a deeper technical understanding of how this Solution was created and more detailed explanations of Solution-specific vocabulary.
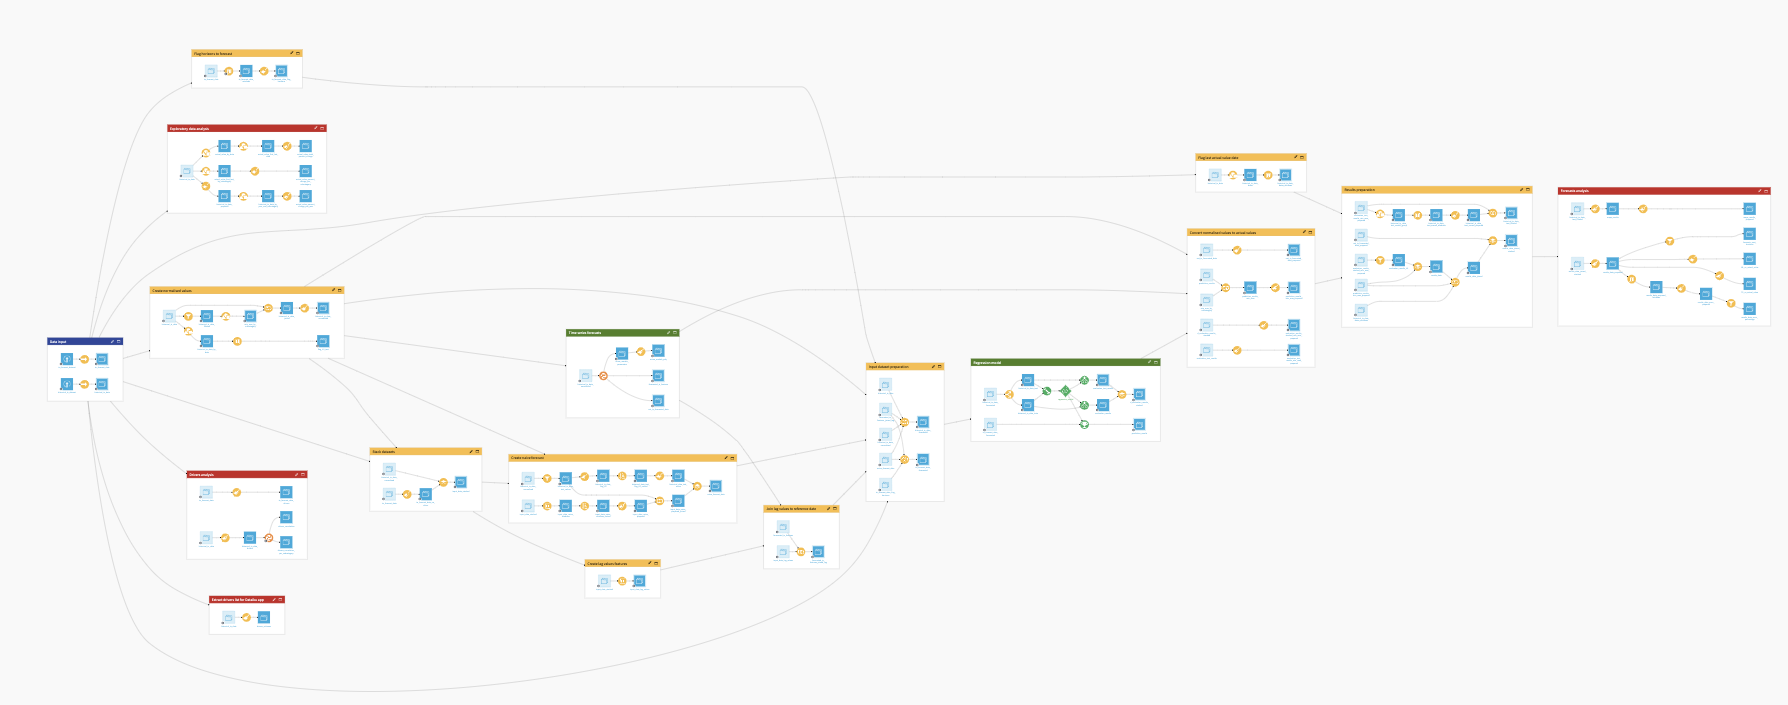
The Flow is organized into 9 modular zones:
Data Ingestion
Customer-Product Mapping
Combined Data
Data Preparation & Feature Generation
Churn Definition
Model Input Data Preparation
Churn Prediction
Predicted Churn Visualization
Historical Churn Visualization
Prepare and plug your data#
This Solution follows a template-based approach: data must first be prepared externally to match the expected input schema, then loaded into the project Flow. The Flow is divided into multiple Flow zones, each dedicated to a specific stage of the churn pipeline. Detailed explanations for each Flow zone can be found in the project wiki. Below is a high-level overview of the major tasks.
Clean and prepare historical data#
The Solution organizes data preparation into dedicated Flow zones to ensure properly structured inputs and avoid data leakage:
Customer-Product-Month Timeline—Builds a longitudinal view of every customer’s product usage month by month.
Feature Enrichment—Creates rolling averages, lags, and leads to capture customer behavior patterns that signal churn.
Churn Label Definition—Applies business rules to define backward-looking (actual) and forward-looking (predicted) churn labels.
Leakage Prevention—Removes records after churn events to ensure the model only learns from valid, pre-churn history.
Each dataset row represents a unique customer-product-date combination, enabling the Solution to track relationship endings and label churn accurately over time.
Following model training, testing, and scoring, final data preparation Flow zones generate churn risk indicators. These outputs are structured to directly power the dashboards, surfacing churn probabilities, at-risk revenue, and customer insights for business action.
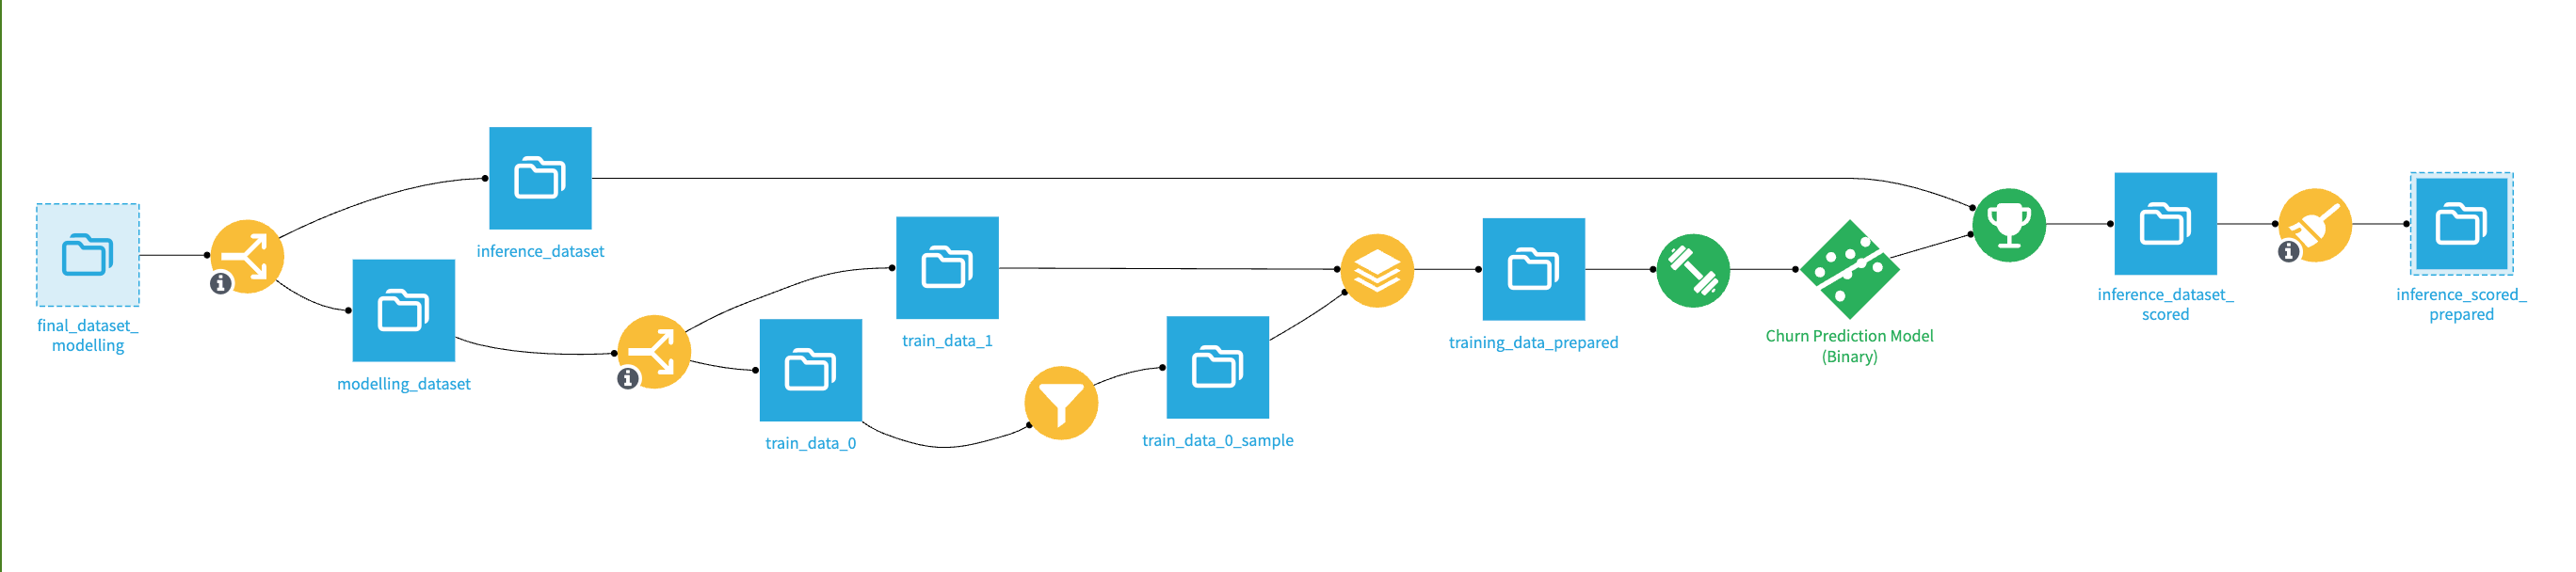
Predict probability of churn#
The Churn Prediction zone generates churn probability at the product level, which is then aggregated at the customer level.
The binary classification model is trained on a consolidated dataset where each row corresponds to a (customer_id, product_id, date) tuple enriched with revenue, balance, and product usage features. To preserve temporal structure, the dataset is ordered by the date column: the first 80% of the timeline is used for training, and the remaining 20% is used for validation. This ensures that predictions are forward-looking.
The Score recipe applies the trained model to the scoring dataset (inference_data) and outputs a churn probability between 0 and 1 for each active customer-product record. These probabilities are then aggregated at the customer level to highlight accounts with the highest overall churn risk.
A classification model predicts churn probability with the following characteristics:
Class imbalance handled through re-weighting or sampling
Hyperparameters optimized with ROC AUC as the primary metric
Prediction threshold tuned using a cost matrix to reflect business impact
Churn dashboards#
The Churn dashboards provide two complementary views:
Page |
Description |
|---|---|
Customer Level Churn Analysis |
Predicts customers likely to churn completely, showing revenue at risk and ranking at-risk customers. |
Product Level Churn Analysis |
Highlights product-level churn risk—that is, customers leaving specific products. A single customer may discontinue one or several products. The dashboard consists of revenue at risk, product insights and at-risk customer-product table. |
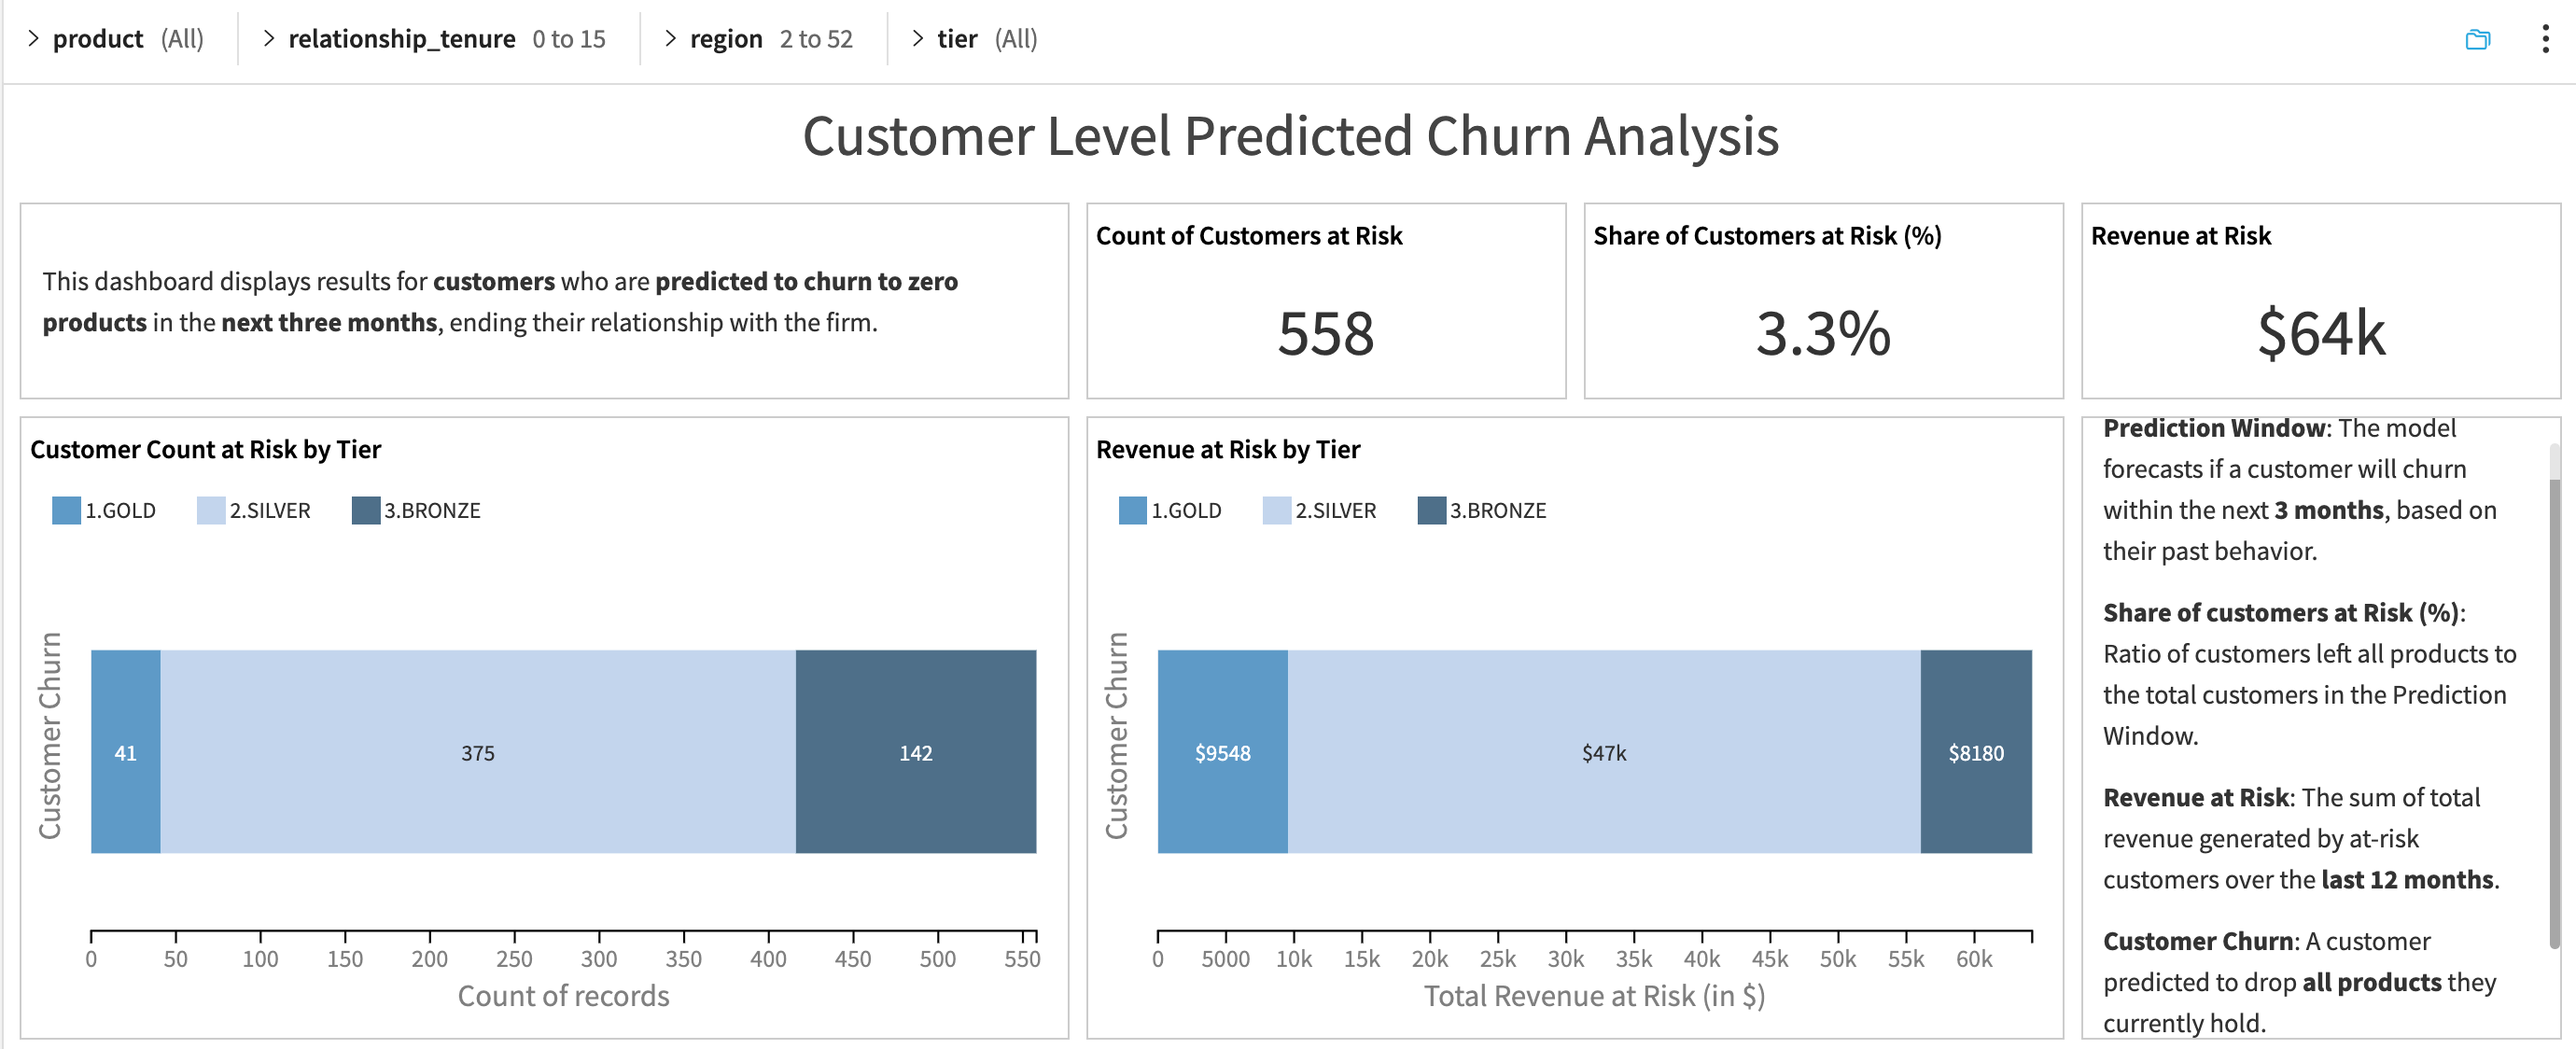
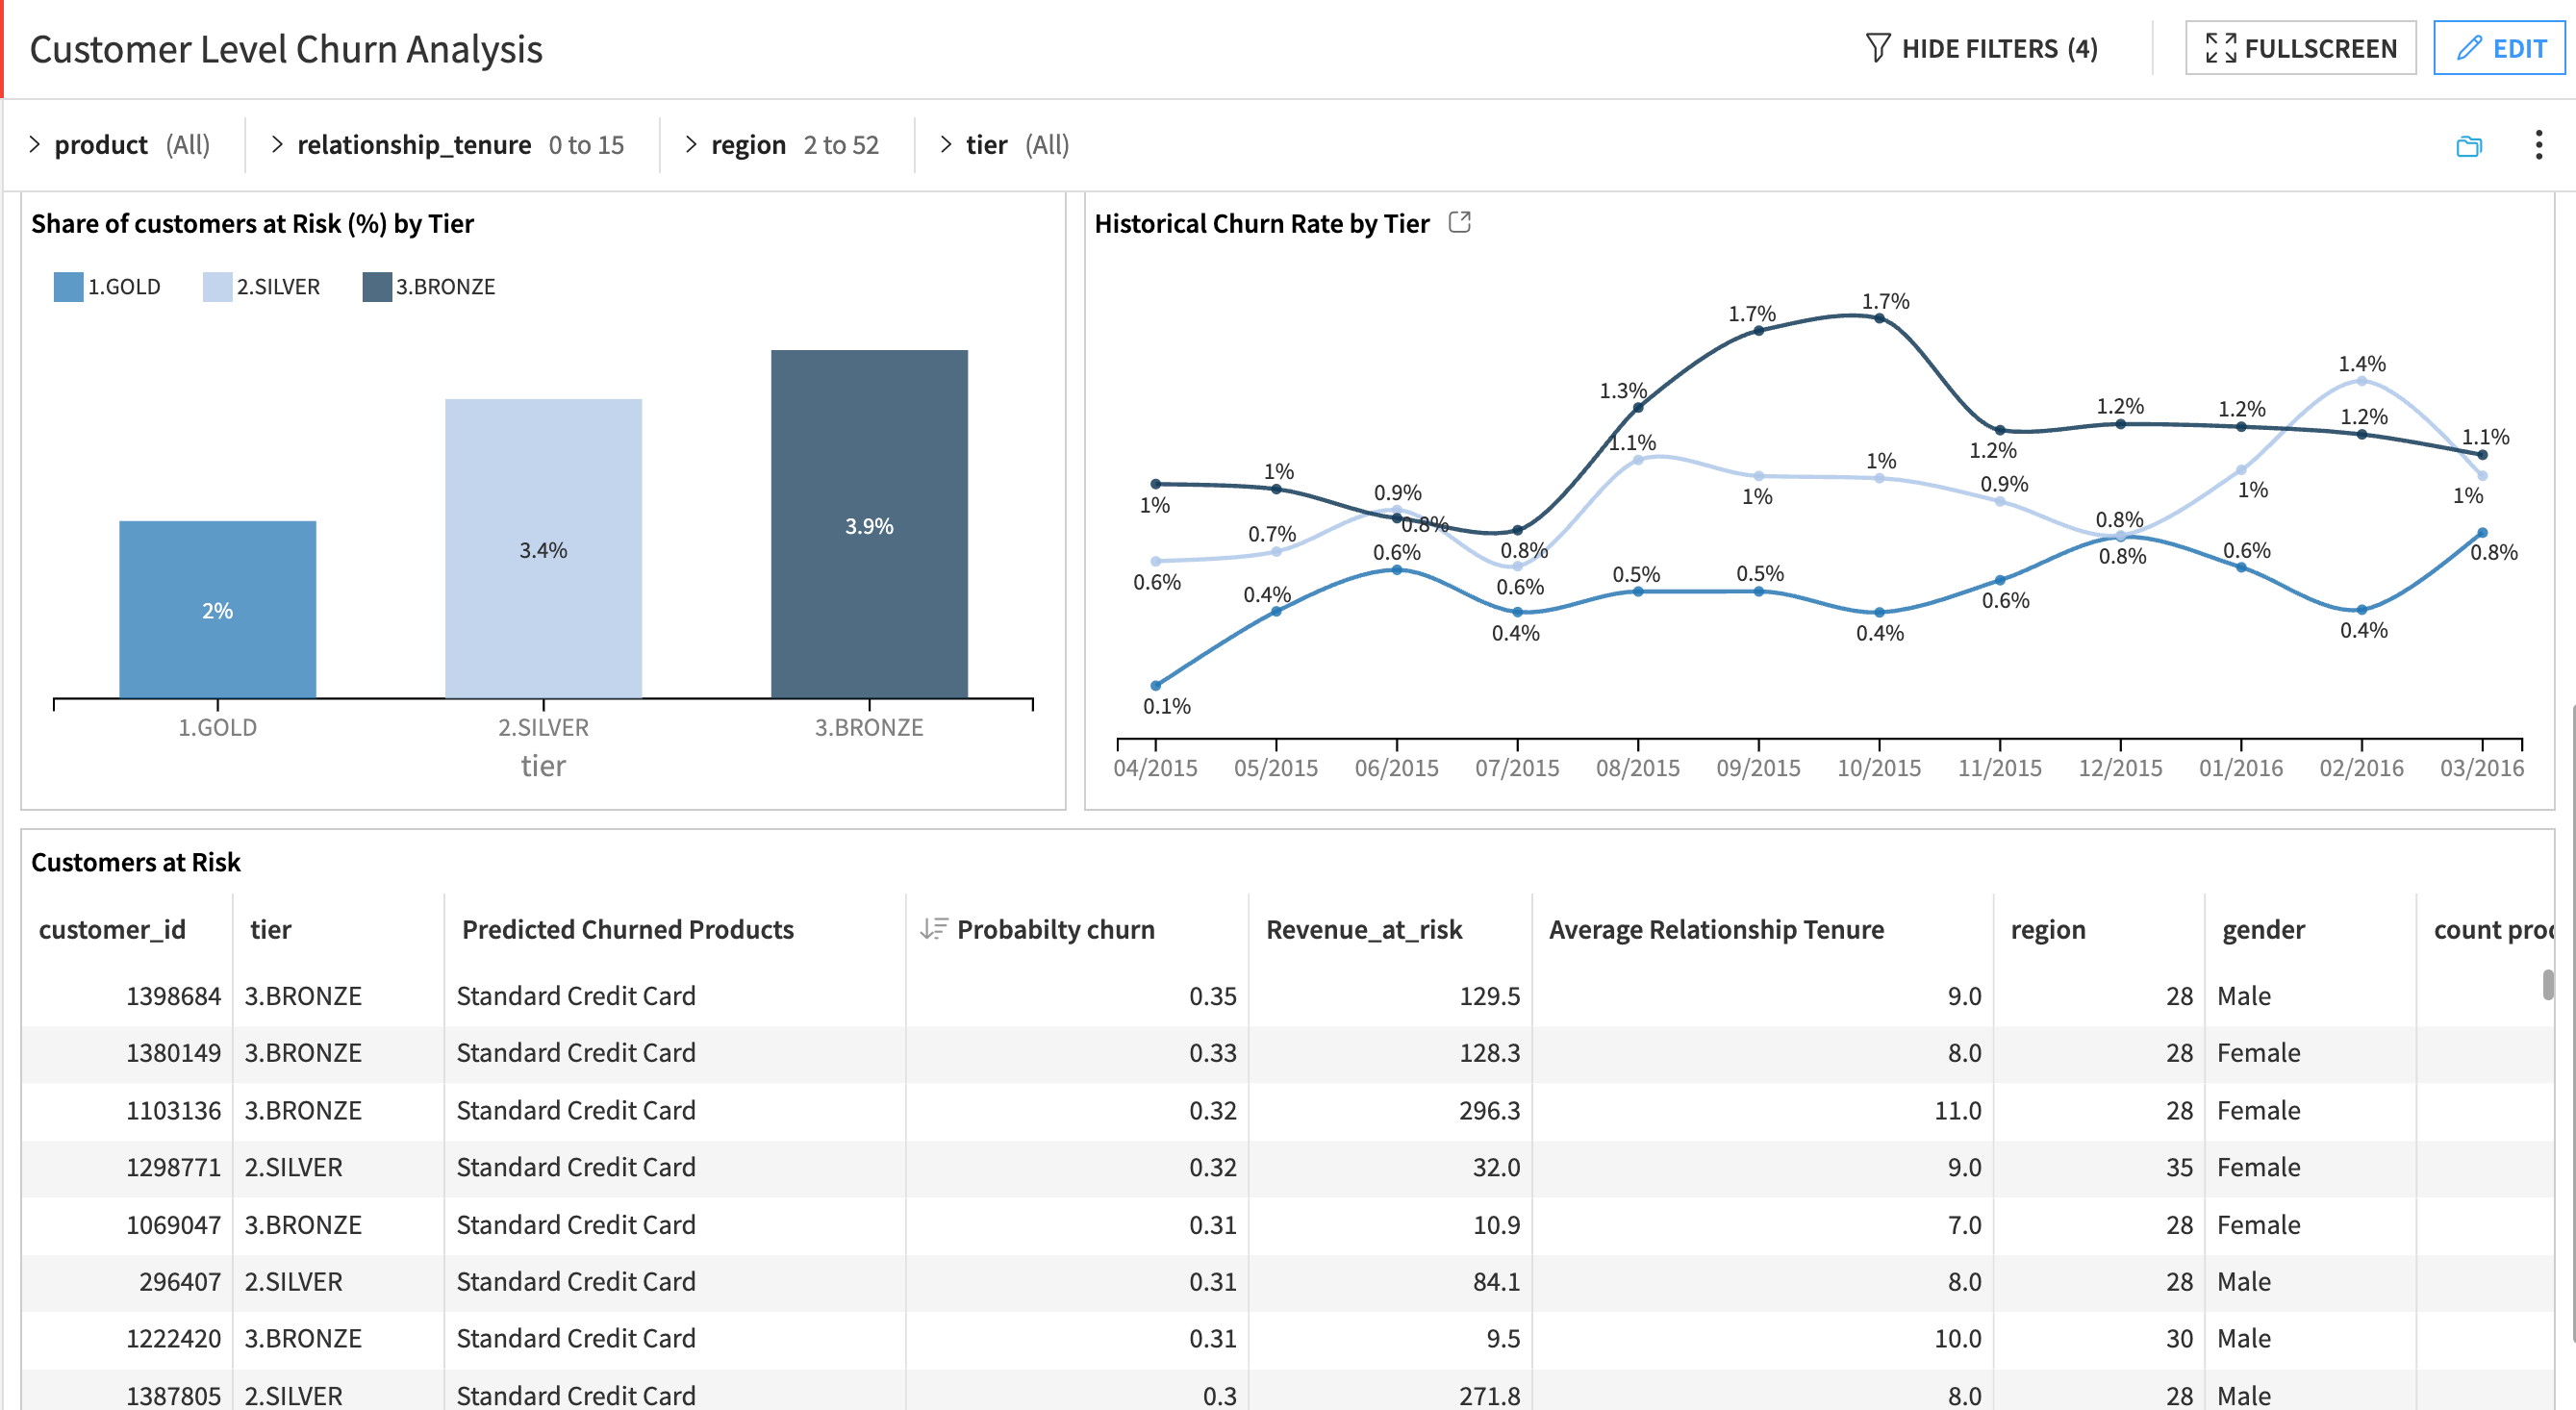
Customer Level Churn Analysis dashboard#
This dashboard provides a client-centric view of predicted churn. It focuses on identifying customers likely to exit their entire product relationship with the bank within the next 3 months. These insights support targeted retention and prioritization by customer value (for example, revenue or tier).
This dashboard shows:
Customers who are forecasted to churn completely
Predicted churn rate vs. historical churn trends
Revenue at risk if predicted churners leave
Churn segmentation by tier and customer profile
A ranked list of individual at-risk customers
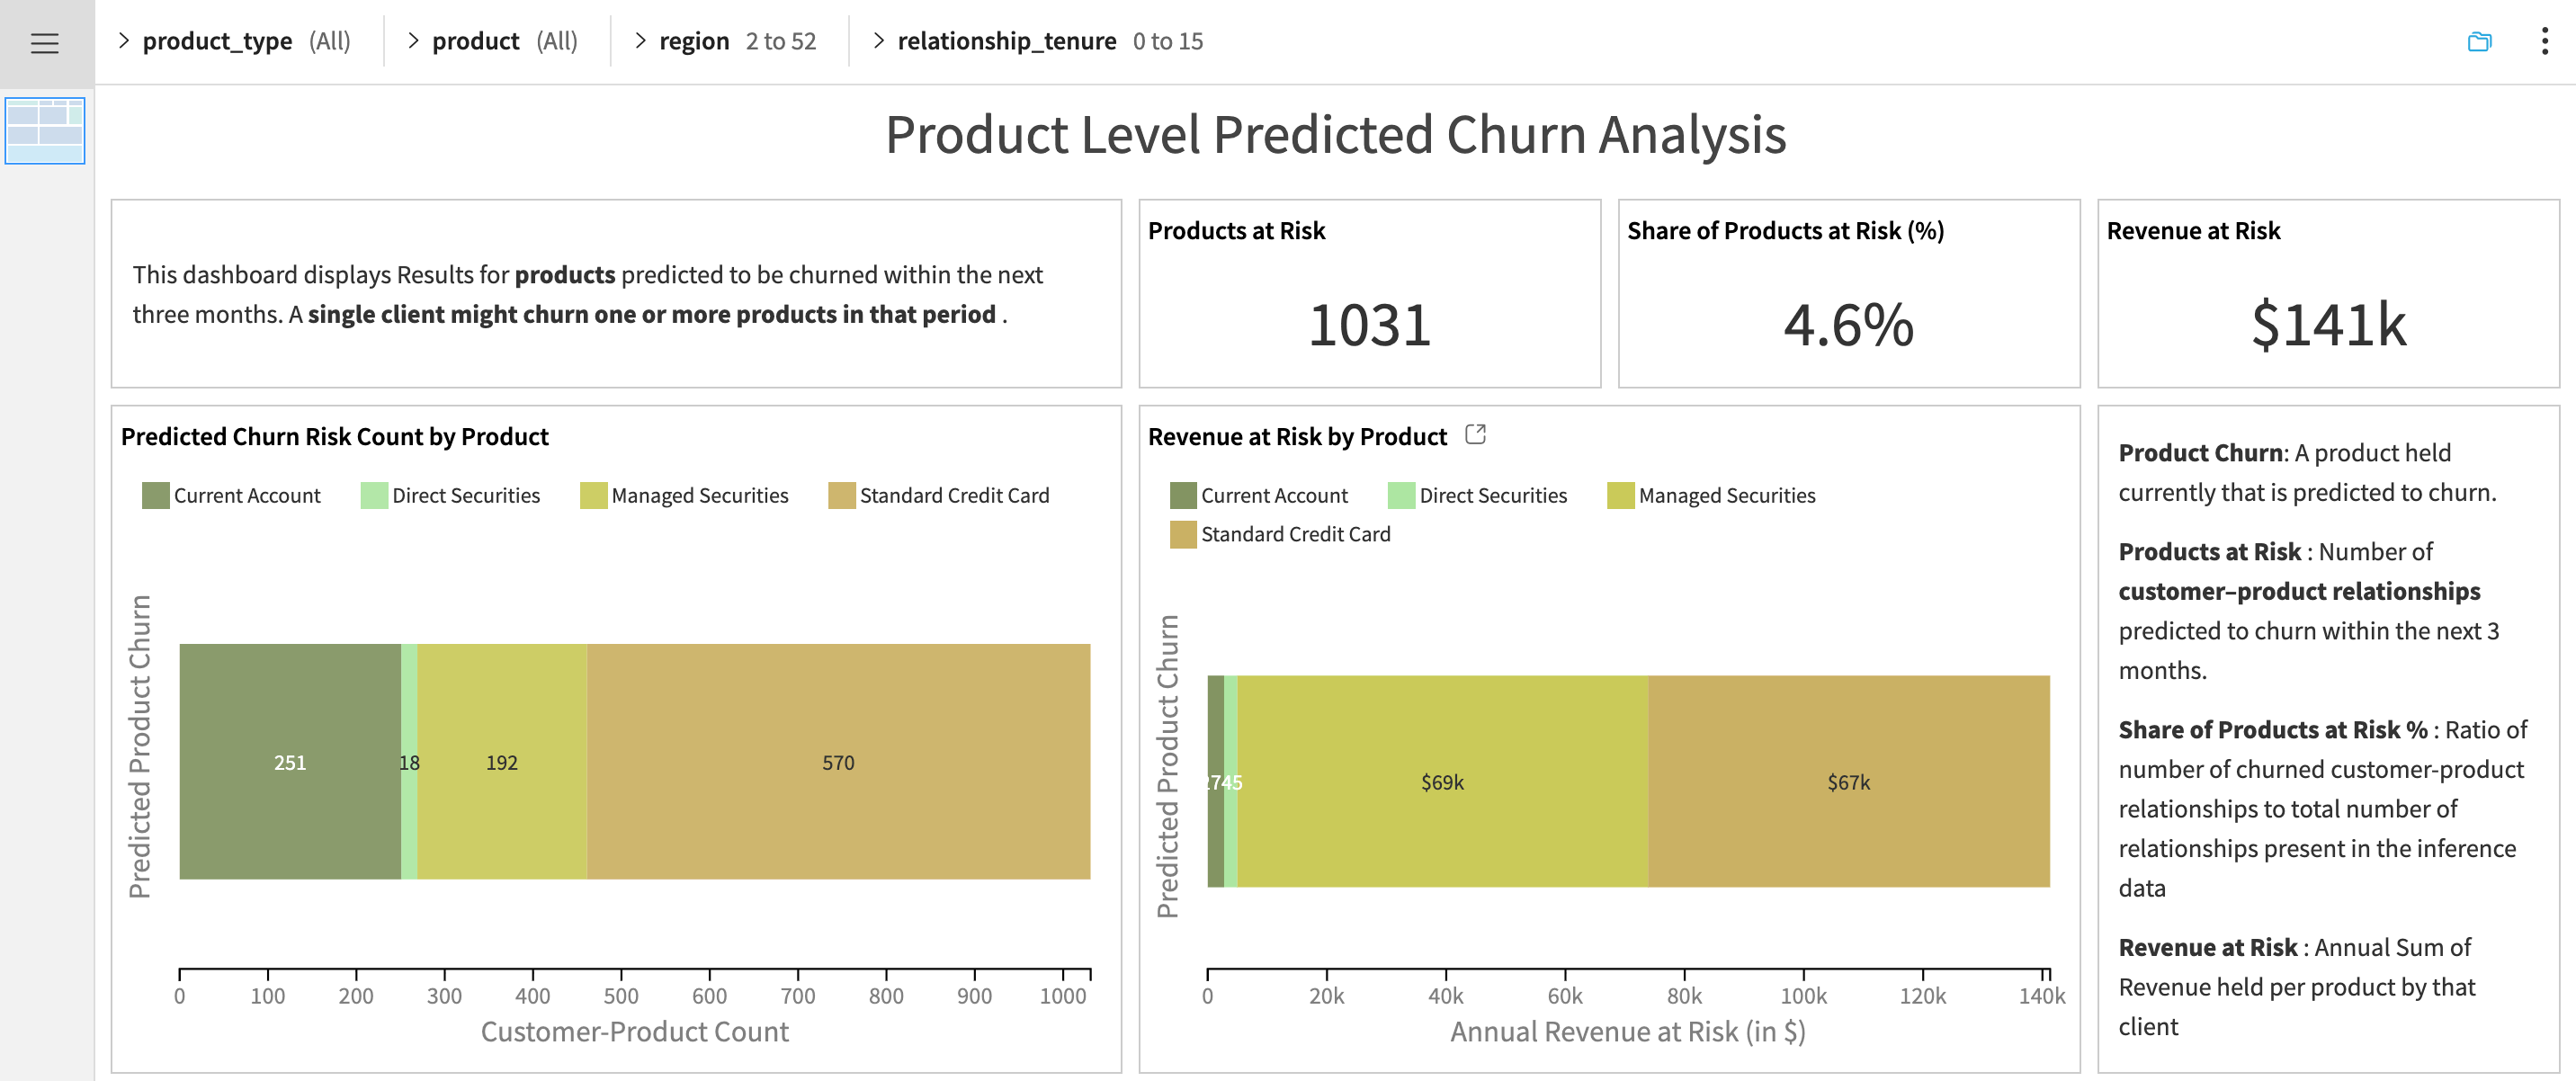
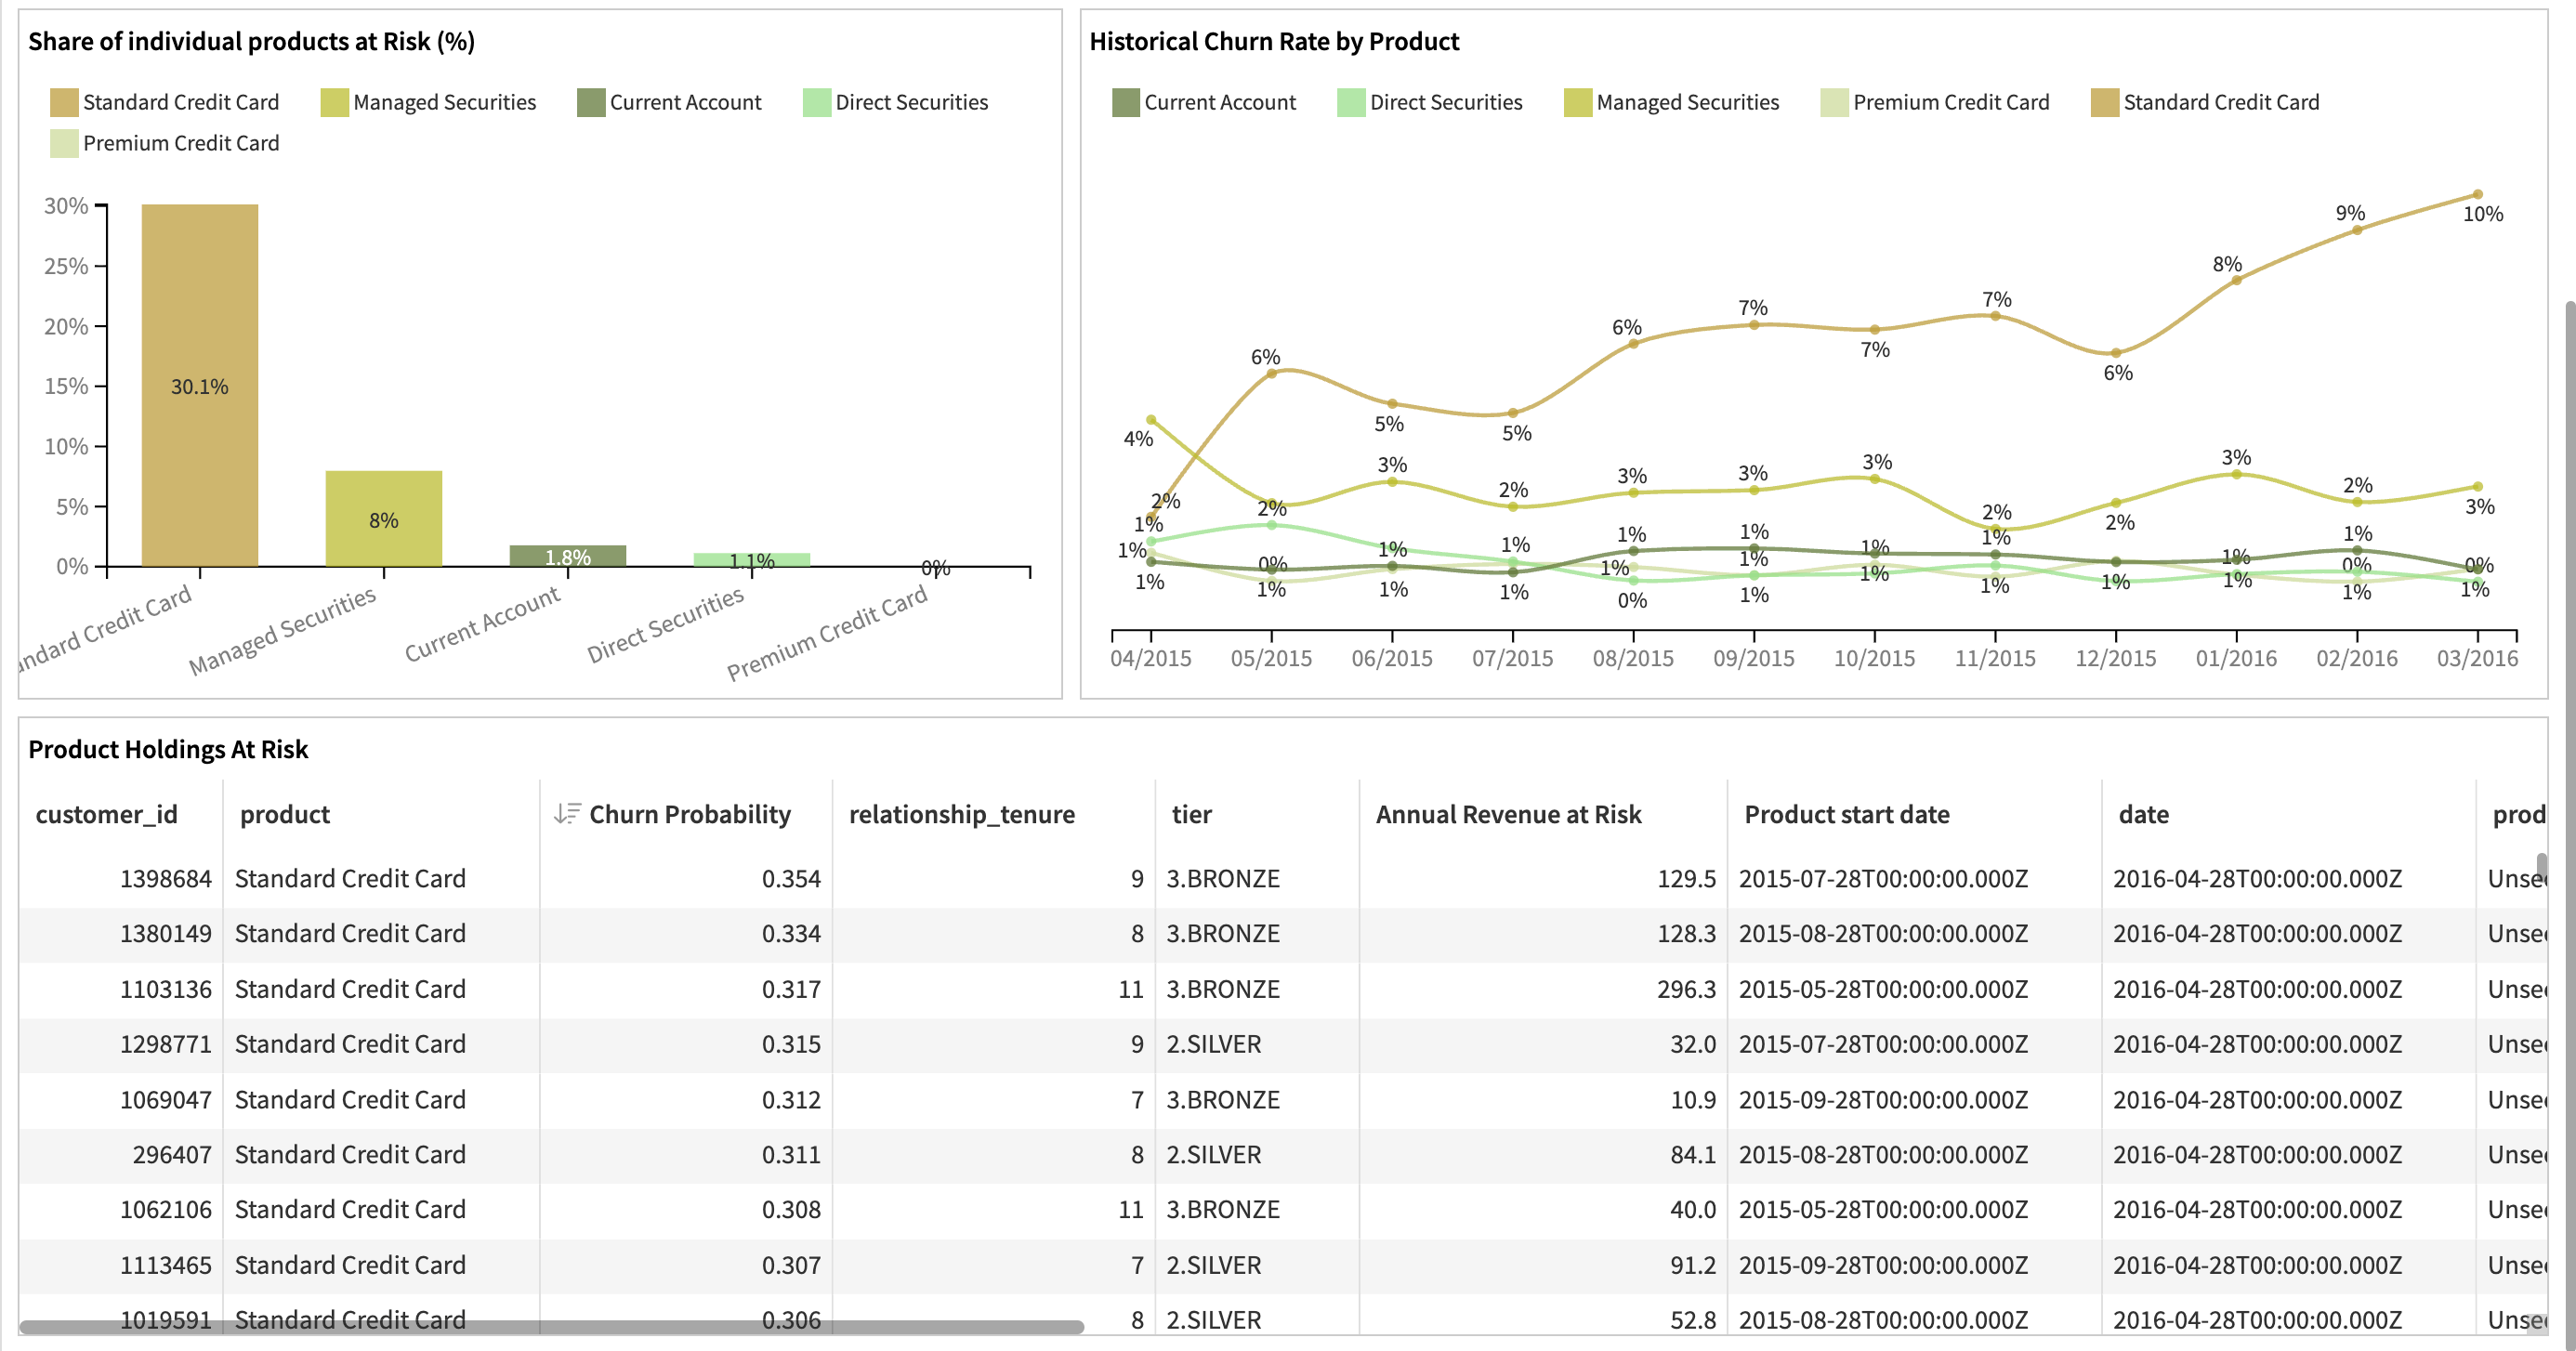
Product Level Churn Analysis dashboard#
Product Level Churn Analysis dashboard provides a granular view of churn risk across individual products held by customers. It highlights which products are most at risk, how churn is distributed by type and tier, and helps prioritize product-specific retention actions.
This dashboard shows:
Churn predictions at the customer-product-month level
Top products with the highest churn probability
Product-wise revenue at risk
Segmented churn rates by tier and product
A detailed list of at-risk customer-product pairs
Adaptability across industries#
The Churn Prediction Solution is data-model agnostic, built around a simple structure of customer-product-time. This makes it possible to adapt to multiple industries by only remapping inputs, for example:
Telecom: Product = plan/service, revenue = bills or ARPU, balance = prepaid/unpaid amounts.
Insurance: Product = policy, revenue = premiums, balance = claims or reserves.
Subscriptions (OTT, SaaS, retail memberships): Product = subscription, revenue = fees, optional = logins or consumption.
The recipes and pipelines remain unchanged; only the data mapping and churn rules shift as per business requirements, allowing the framework to serve as a flexible churn engine across industries.
Reproduce with minimal effort for your data#
This Solution helps users identify and prioritize customer churn risk in Dataiku—from data preparation to classification and visualization.
This guide outlines multiple ways to derive value. The “best” setup depends on your data and goals. To adapt this project to your organization’s specific needs, Dataiku offers roll-out and customization services upon request.