Solution | Real-World Data: Cohort Discovery#
Overview#
Business case#
Real-world data (RWD) refers to health-related information collected outside of controlled clinical trials, often gathered from electronic health records, insurance claims, and patient registries. Using RWD to assess real-world evidence (RWE) is one of the top priority applications for AI initiatives in healthcare (payer/provider/public or federal health systems) and life science companies.
However, a complex ETL process involves collecting, normalizing, and harmonizing patient data from heterogeneous sources (for example patient registry, electronic health record systems, insurance claims) even within one healthcare organization. A few global common data models provide a framework to standardize these complex ETL processes.
This Solution provides a centralized repository to store and manage cohorts (clinical electronic phenotyping) from real-world data (for example, electronic health records, medical claims data). It adopts the Observational Medical Outcomes Partnership Common Data Model (OMOP CDM).
This Solution turns complex cohort SQL scripts into generalizable and reusable clinical electronic phenotyping for future advanced analytics. It also offers a quick dashboard to review the descriptive statistics and clinical characterizations of a given cohort.
Key beneficiaries include:
Biomedical informaticists who ingest and manage cohorts (clinical electronic phenotyping).
Clinical researchers who review and validate cohorts.
Epidemiologists and health outcomes researchers who derive insights from the cohorts and extend their use for further advanced statistical or machine learning outcomes analysis (for example, in real-world evidence studies).
Installation#
From the Design homepage of a Dataiku instance connected to the internet, click + Dataiku Solutions.
Search for and select RWD Cohort Discovery.
If needed, change the folder into which the Solution will be installed, and click Install.
Follow the modal to either install the technical prerequisites below or request an admin to do it for you.
Note
Alternatively, download the Solution’s .zip project file, and import it to your Dataiku instance as a new project.
Technical requirements#
To use this Solution, you must meet the following requirements:
Have access to a Dataiku 13.5+* instance.
Snowflake, Databricks, or Redshift connection.
Data model#
This Solution requires that the database assumes OMOP CDM v5.3 or a later version.
We recommend that users conduct data preparation and feature engineering steps in a separate project to match the expected format of the input datasets. In most situations, date and datetime values require parsing via a Prepare recipe on the Dataiku instance.
The Solution translates the OMOP CDM schema into a Dataiku instance-compatible schema. You can find it in the Solution library repository (python/solution/utils/cdm_schema.py).
This Solution requires a minimum subset of OMOP CDM tables:
person
observation_period
visit_occurrence
condition_occurrence
drug_exposure
death
location
condition_era
concept
concept_ancestor
See also
Please review the Solution wiki [Data Model] for more information regarding the data model and required files.
Required files#
Please read the Solution wiki [Required Files] for more details about the OMOP CDM table name mapping file.
OMOP CDM table name mapping (optional)#
This Solution requires an OMOP table name mapping JSON file if the cohort scripts use custom table names other than the standard OMOP table names. This Solution pre-packages a mapping JSON for cohort scripts exported from the Atlas tool.
Cohort SQL scripts#
The Solution also requires one or more SQL scripts to construct cohorts. A cohort SQL script is valid as long as it follows the naming convention of OMOP CDM. In OMOP CDM, cohort is sometimes interchangeable with clinical phenotype. Therefore, a cohort SQL script can produce a cohort representing all anti-hypertensive prescriptions.
A more complicated cohort SQL script can represent eligibility criteria for a clinical research question like a cohort with hypertension on first-time monotherapy of angiotensin-converting enzyme inhibitors (ACEIs).
Users can also facilitate cohort construction with the accessible tool Atlas, which provides a no-code user interface for building and exporting cohort SQL scripts in the language of choice.
Cohort metadata#
The cohort metadata file provides a list of cohorts and metadata to indicate which cohorts should be uploaded or revised to the cohort table and cohort_definition OMOP table.
Workflow overview#
You can follow the Solution in the Dataiku gallery.
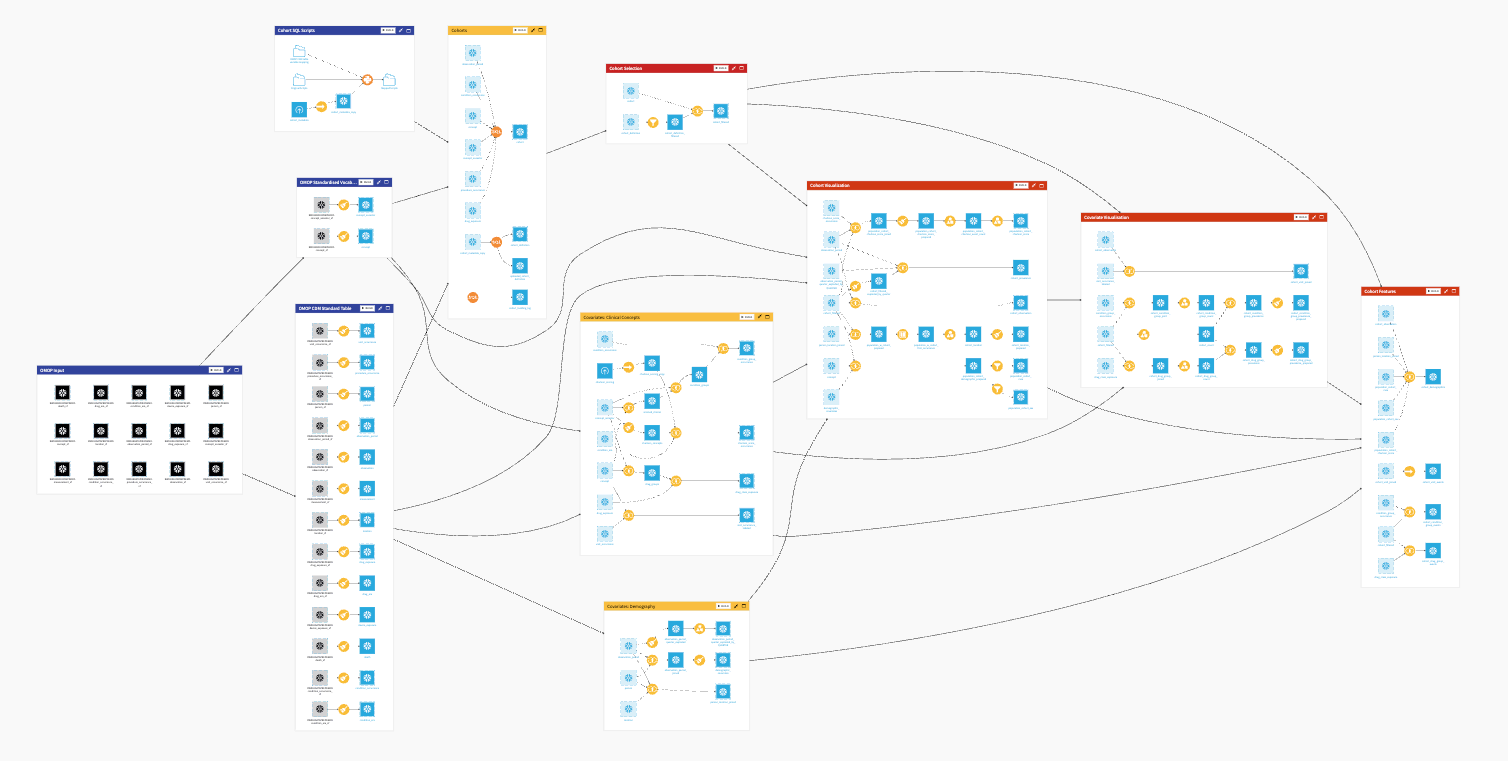
The project has the following high-level steps:
Establish an OMOP data ETL pipeline.
Upload cohort SQL scripts and cohort metadata for ingestion.
Select a cohort from the OMOP tables cohort and cohort_definition for visualization.
Walkthrough#
This Solution has two main components: project setup and dashboard. The project setup configures the cohort ingestion pipeline. The dashboard provides a quick visualization of cohort statistics and characteristics.
Note
In addition to reading this document, it’s recommended to read the wiki of the project before beginning to get a deeper technical understanding of how this Solution was created and more detailed explanations of Solution-specific vocabulary.
Project setup#
The project setup consists of three components: pipeline configuration, cohort ingestion, and dashboard creation.
Pipeline configuration#
This part consists of a one-time configuration to establish the data ETL pipeline. Users should select the connections for the project, connect OMOP CDM tables from the source project, and provide an OMOP custom table name mapping file if needed.
Connection configuration#
The Solution defaults to the filesystem once installed on the Dataiku instance. However, users must change the connection this Solution supports during the project setup.
Important
The Solution requires an SQL connection for the datasets and another one for the project folders. It must be one of the supported connections (Snowflake, Redshift, or Databricks).

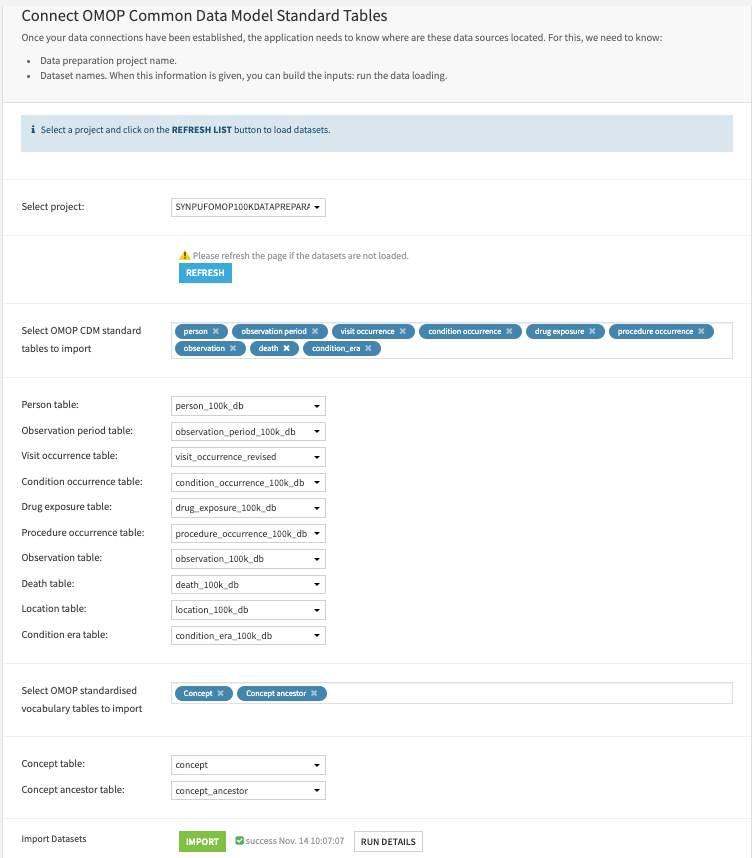
Connect OMOP common data model standard tables#
The Solution requires a minimal subset of OMOP CDM source datasets as inputs. First, select the source project where users have all the required OMOP CDM datasets. Second, select all the OMOP tables required for the cohort SQL scripts for the Solution to run correctly.
Important
The source input datasets must use the same SQL connection as selected in the project setup and must respect the OMOP CDM v5.3 schema. The following OMOP tables are mandatory for the Solution: person, observation_period, visit_occurrence, condition_occurrence, drug_exposure, death, location, condition_era, concept, concept_ancestor.
OMOP CDM custom table name mapping (optional)#
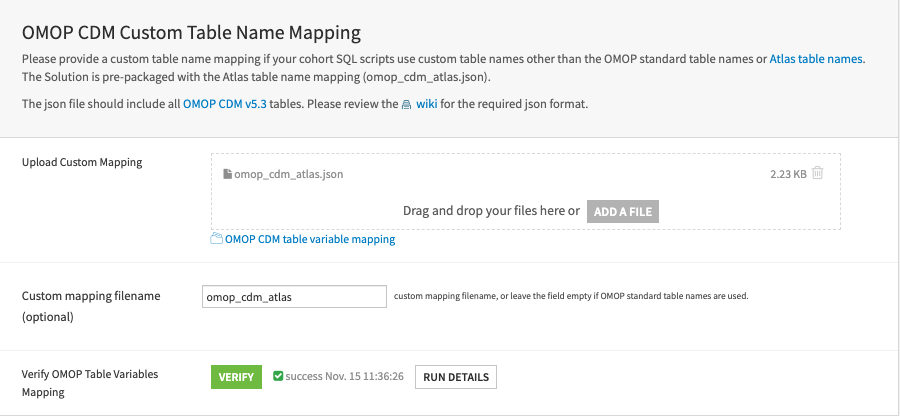
This Solution requires an OMOP custom table name mapping JSON file if users’ cohort scripts use custom table names other than the standard OMOP table names. This Solution pre-packages a mapping JSON for cohort scripts exported from the Atlas tool. Skip this step if cohort SQL scripts follow OMOP naming conventions.
First, upload a text file containing a key-value pair, including tables from OMOP CDM v5.3. Skip this step if custom mapping isn’t required.
Then, indicate the filename to be used. The field is empty by default. Skip this step if cohort SQL scripts use the standard OMOP naming conventions. Fill in
omop_cdm_atlasif users use the cohort scripts exported from the Atlas tool.
Cohort ingestion#
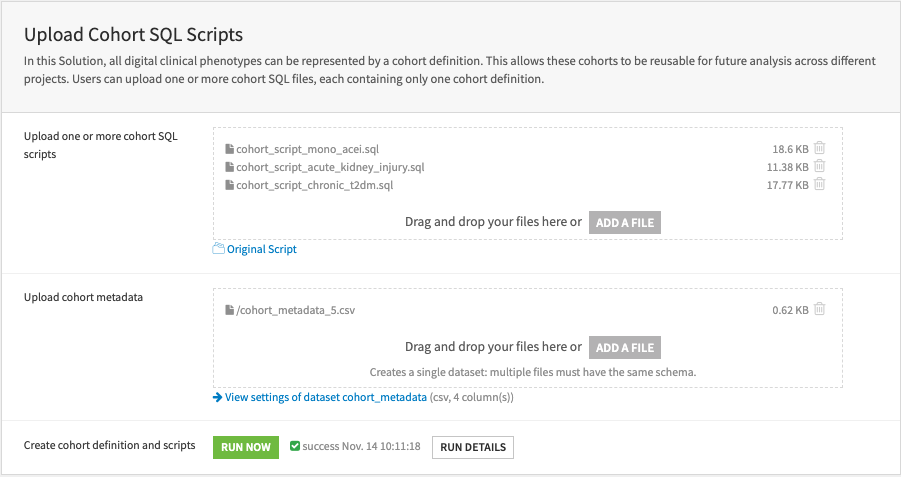
Once you have completed the pipeline configuration, you can start ingesting cohorts with their cohort SQL scripts. This process is repeatable. However, you must execute the two steps Upload Cohort SQL Scripts & Cohort Metadata and Write Cohort in sequence for each ingestion.
Upload cohort SQL scripts & cohort metadata#
The Solution requires cohort SQL scripts and cohort metadata to write data into OMOP tables cohort and cohort_definition. The cohort SQL scripts define the SQL recipe for writing cohorts into the two OMOP tables, whereas the cohort metadata indicates which cohorts to be batch-processed.
First, upload and store multiple SQL scripts. Second, upload a cohort metadata file that lists the cohorts to be batch-processed. It must contain four columns: cohort_definition_id, cohort_definition_name, cohort_definition_description, cohort_sql_script_filename.
Please read the Solution wiki [Required Files] for information on the required schema.
Write cohort#
Once the cohort scripts and the cohort metadata are in place, users can write the cohorts into the OMOP tables cohort and cohort_definition.

Create cohort dashboard#
The cohort dashboard gives a quick review of the results from a cohort query to facilitate cohort validation. Users can regenerate the dashboard with this part.

Dashboard: Cohort Discovery Insights#
In OMOP, a cohort can represent an electronic clinical phenotype. Therefore, a patient can meet the cohort criteria several times in a given observation period and thus be counted multiple times in a cohort.
Cohort descriptive statistics#
The first part of the dashboard provides general statistics of a selected cohort: incidence and prevalence, demographics, and disease burden.
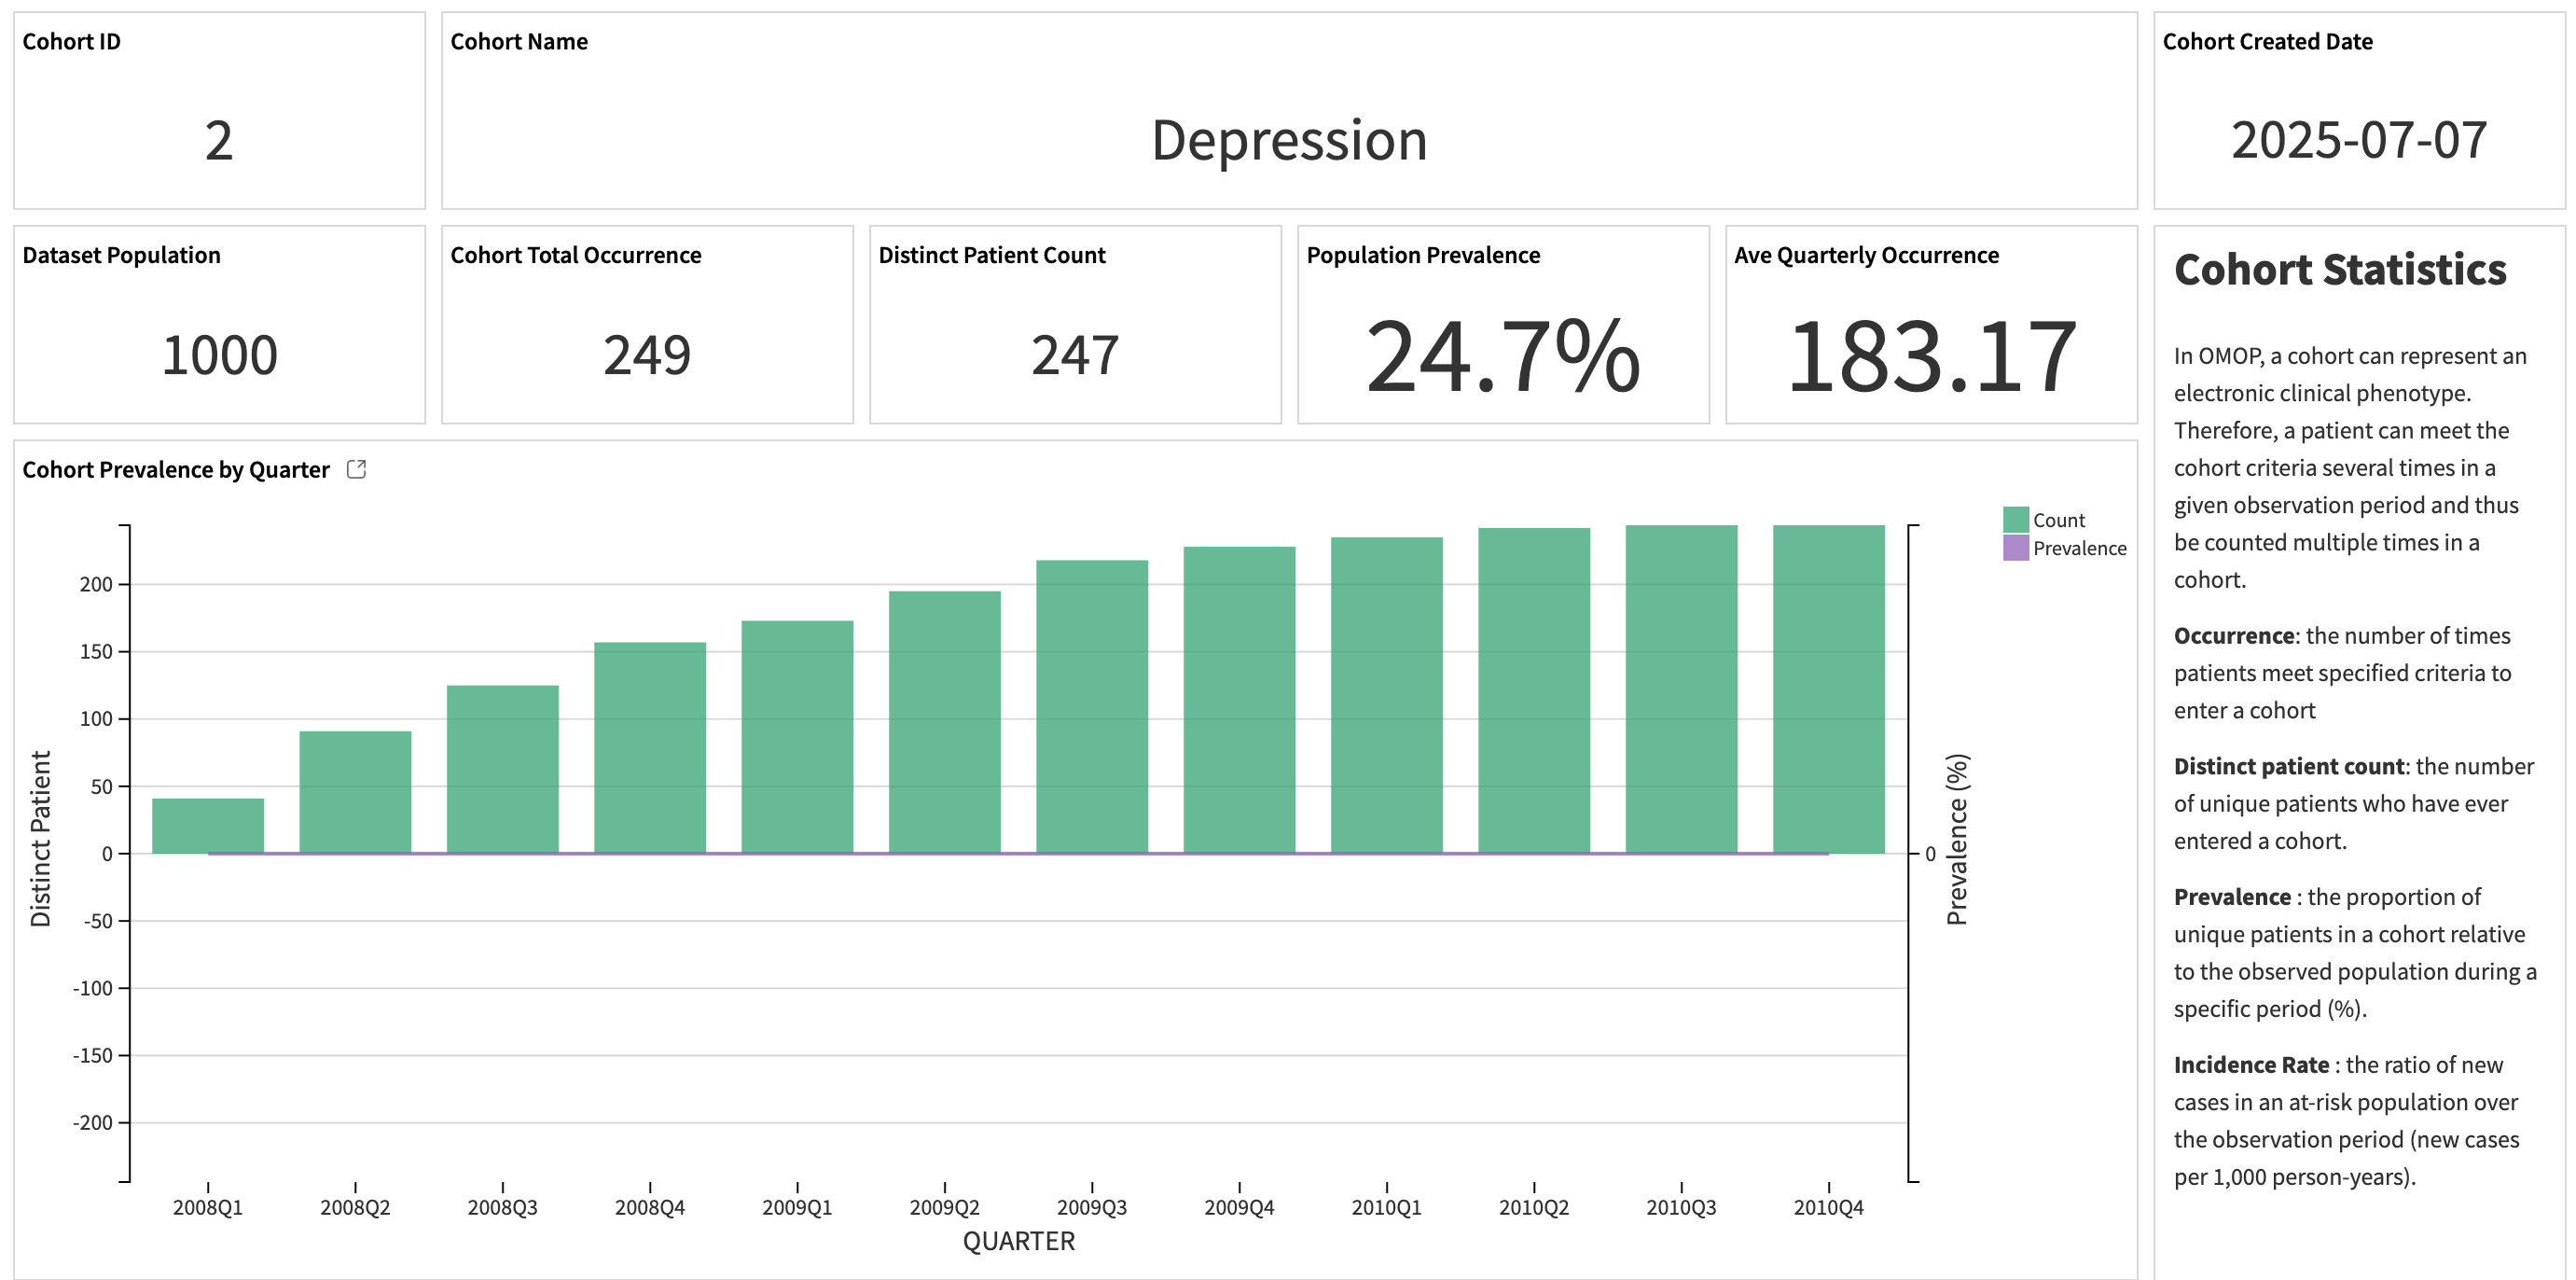

The first part of the slide displays the descriptive statistics on the patients who met the cohort eligibility criteria.
Metric |
Contents |
|---|---|
Occurrence |
The number of times patients meet specified criteria to enter a cohort. |
Distinct patient count |
The number of unique patients who have ever entered a cohort. |
Prevalence |
The proportion of unique patients in a cohort relative to the observed population during a specific period (%). |
Incidence Rate |
The ratio of new cases in an at-risk population over the observation period (new cases per 1,000 person-years). |
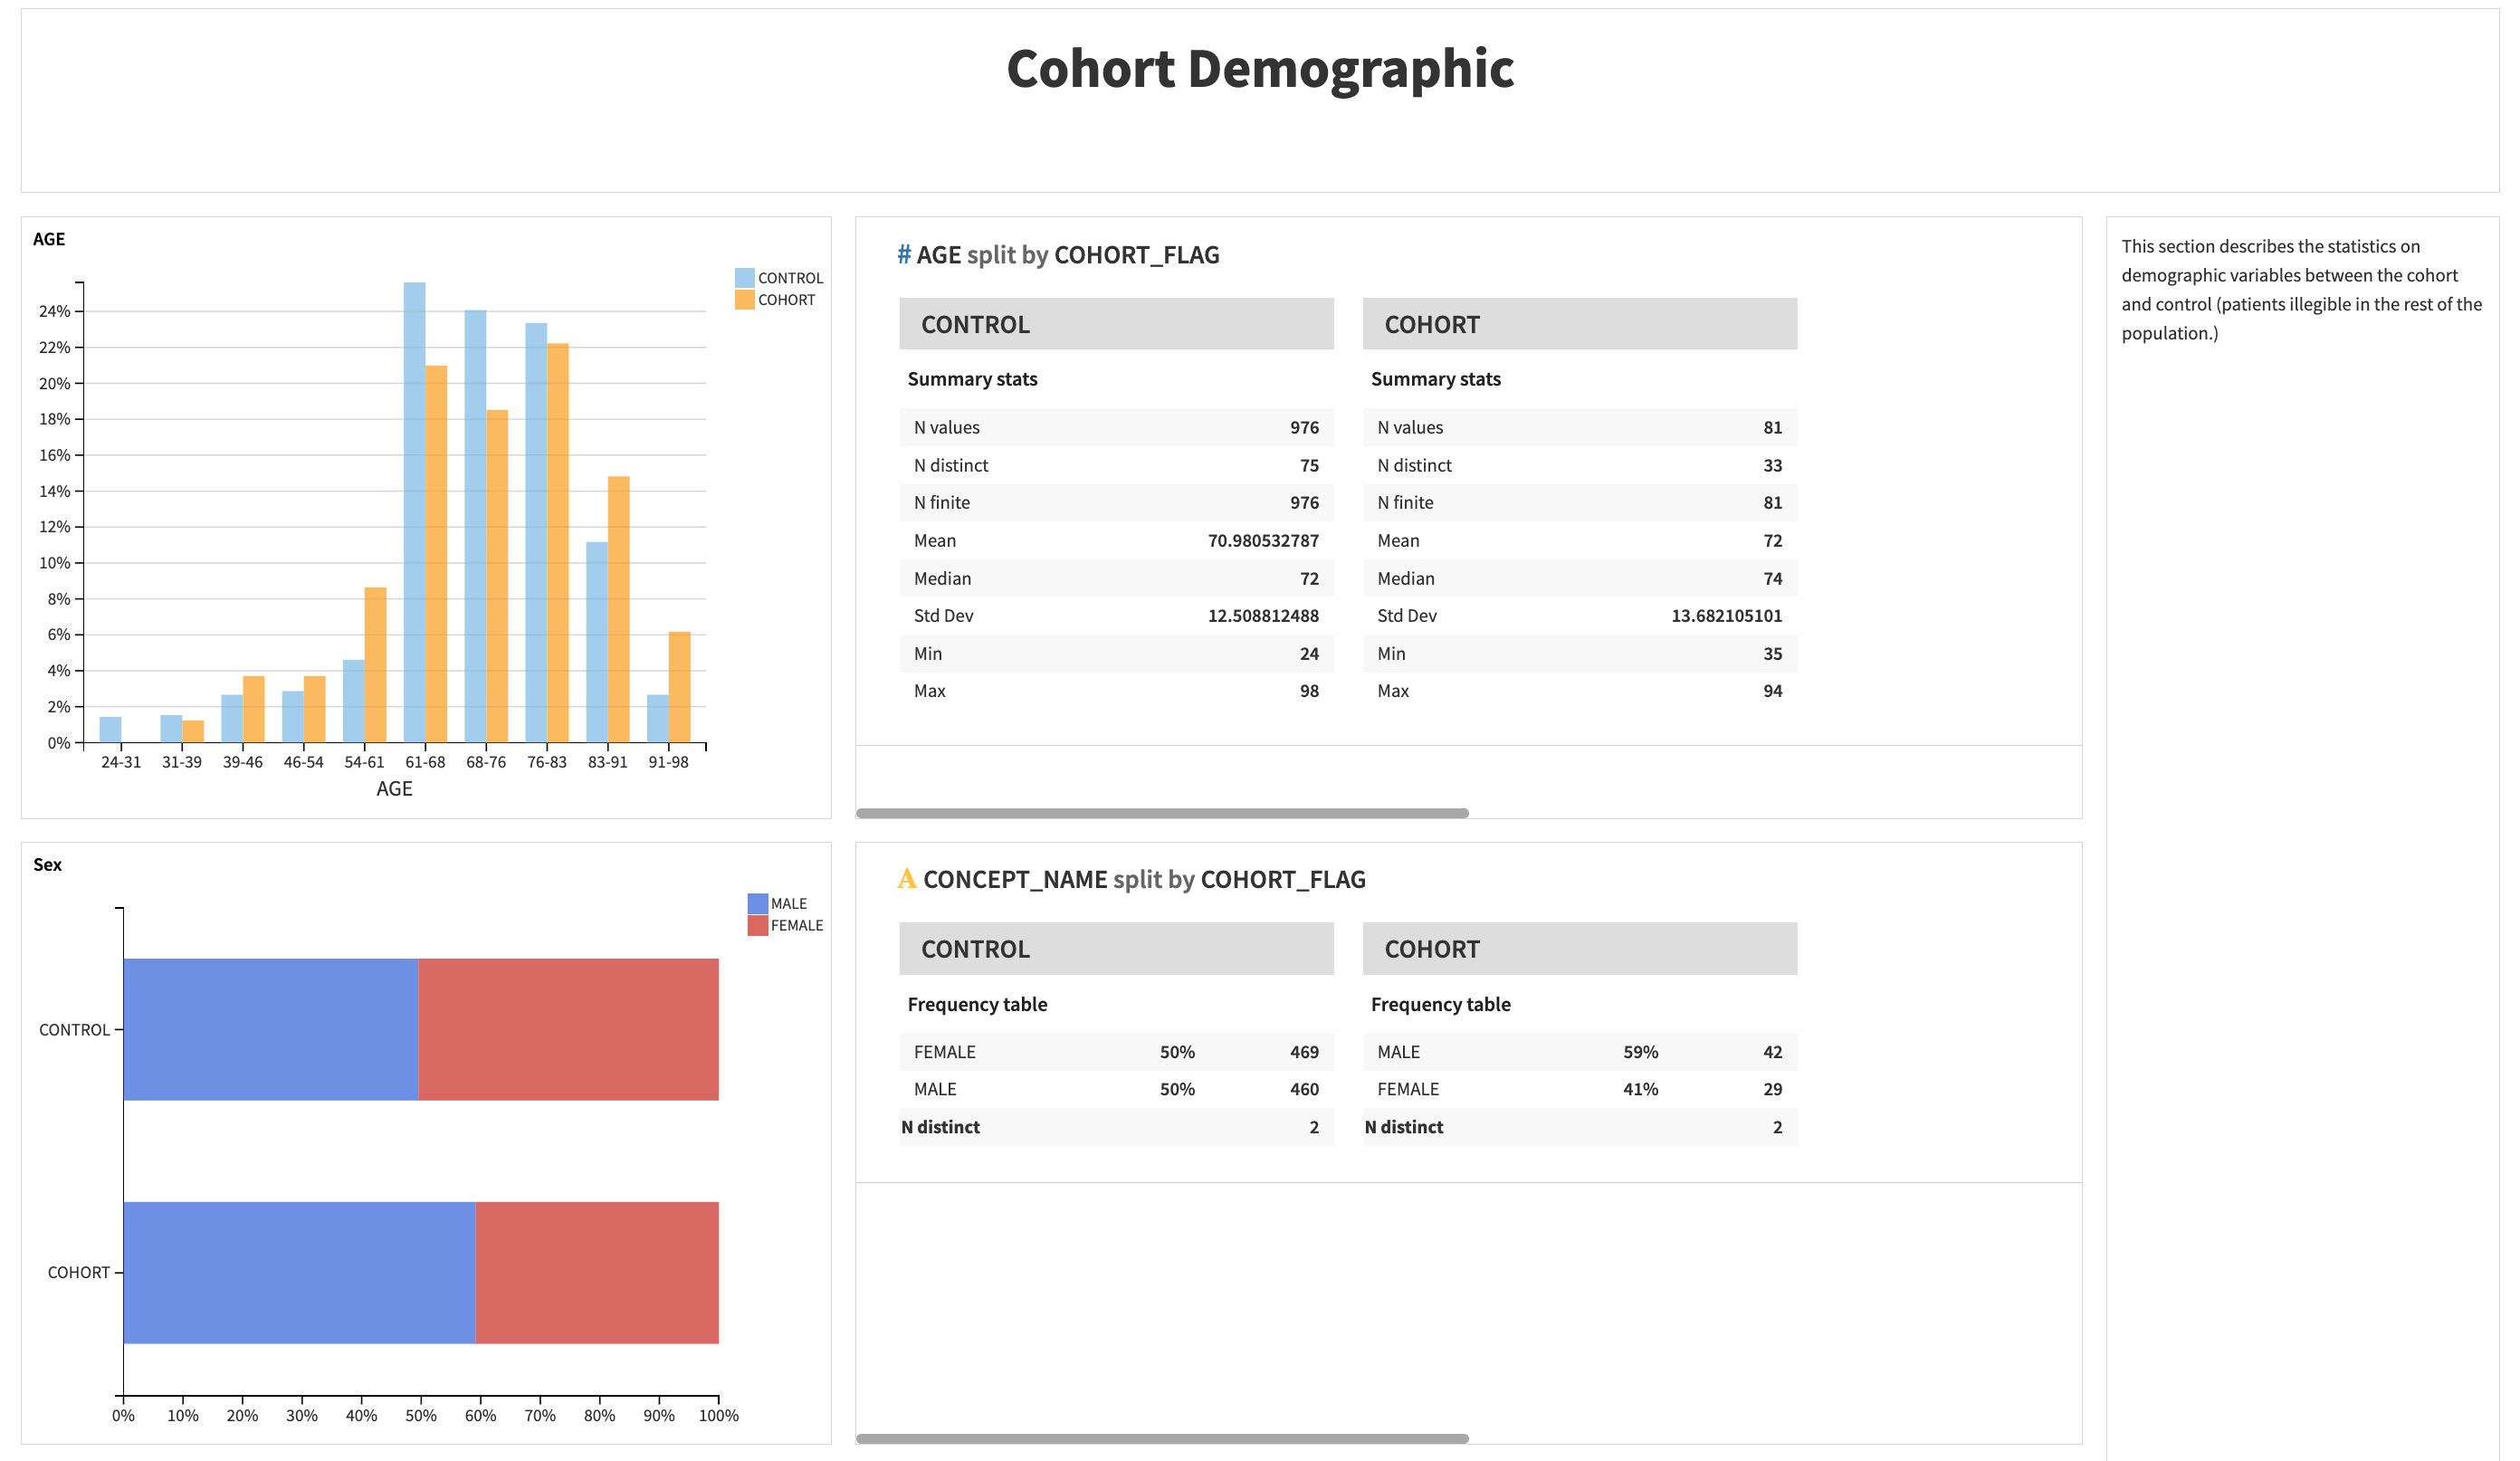
The second part describes the statistics on demographic variables (age, sex, race) between the cohort and control (patients illegible in the rest of the population).
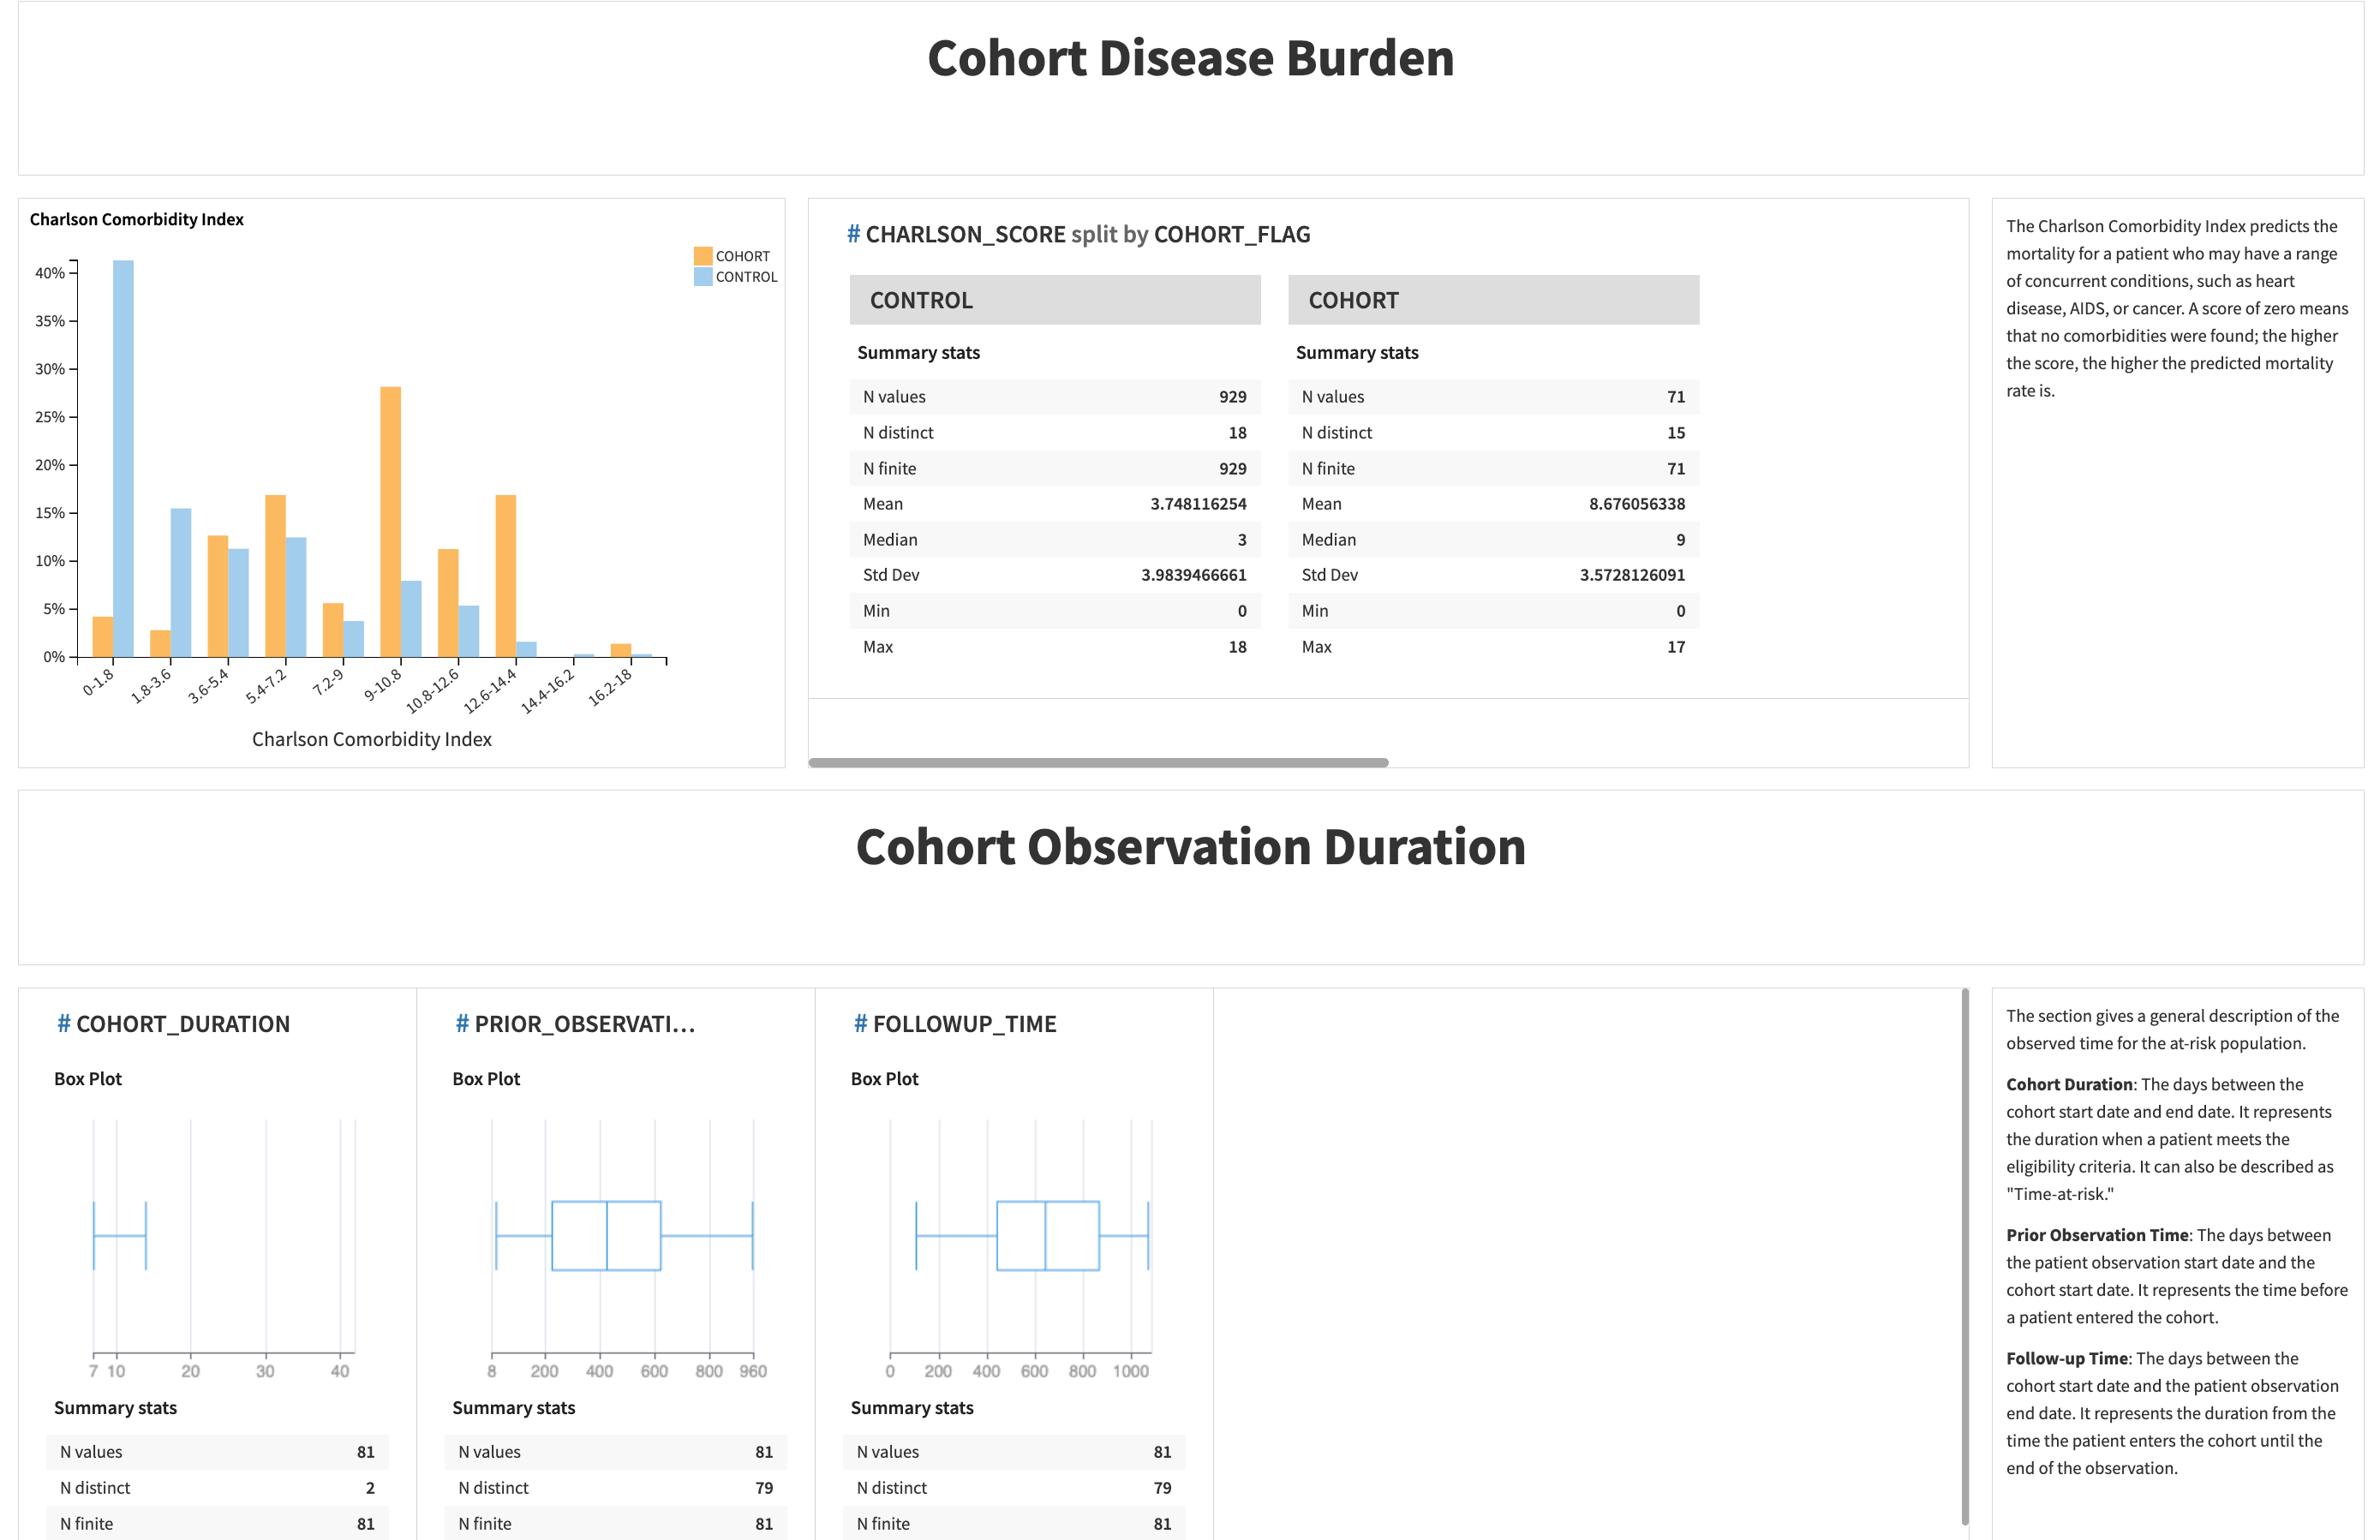
The last part includes the disease burden index and cohort observations.
Metric |
Contents |
|---|---|
Charlson Comorbidity Index |
It predicts the mortality for a patient who may have a range of concurrent conditions, such as heart disease, AIDS, or cancer. The higher the score, the higher the predicted mortality rate is. |
Cohort Duration |
The number of days between the cohort start and end dates. It represents the duration when a patient meets the eligibility criteria. It can also be described as “time-at-risk.” |
Prior Observation Time |
The number of days between the patient observation start date and the cohort start date. It represents the time before a patient entered the cohort. |
Follow-up Time |
The number of days between the cohort start date and the patient observation end date. It represents the duration from when the patient enters the cohort until the end of the observation. |
Cohort covariates#
The second slide describes the distribution of three predefined clinical covariates (clinical condition groups, drug groups, and clinical visits) from the Atlas tool.
Prevalence is the percentage of patients in the cohort who have at least one prescription of a given drug group within one year before the cohort start date.
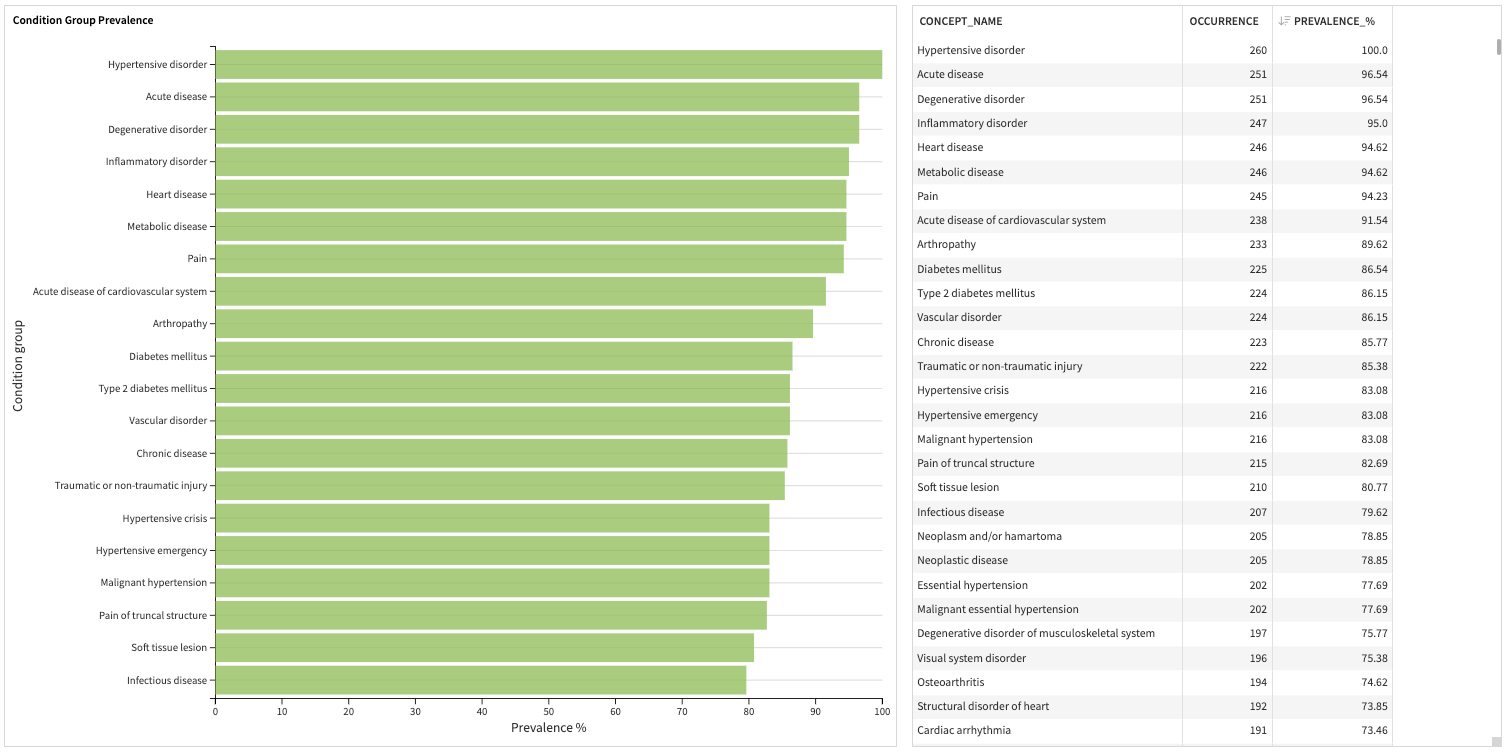
Condition group covariates include the condition concept groups represented by SNOMED.
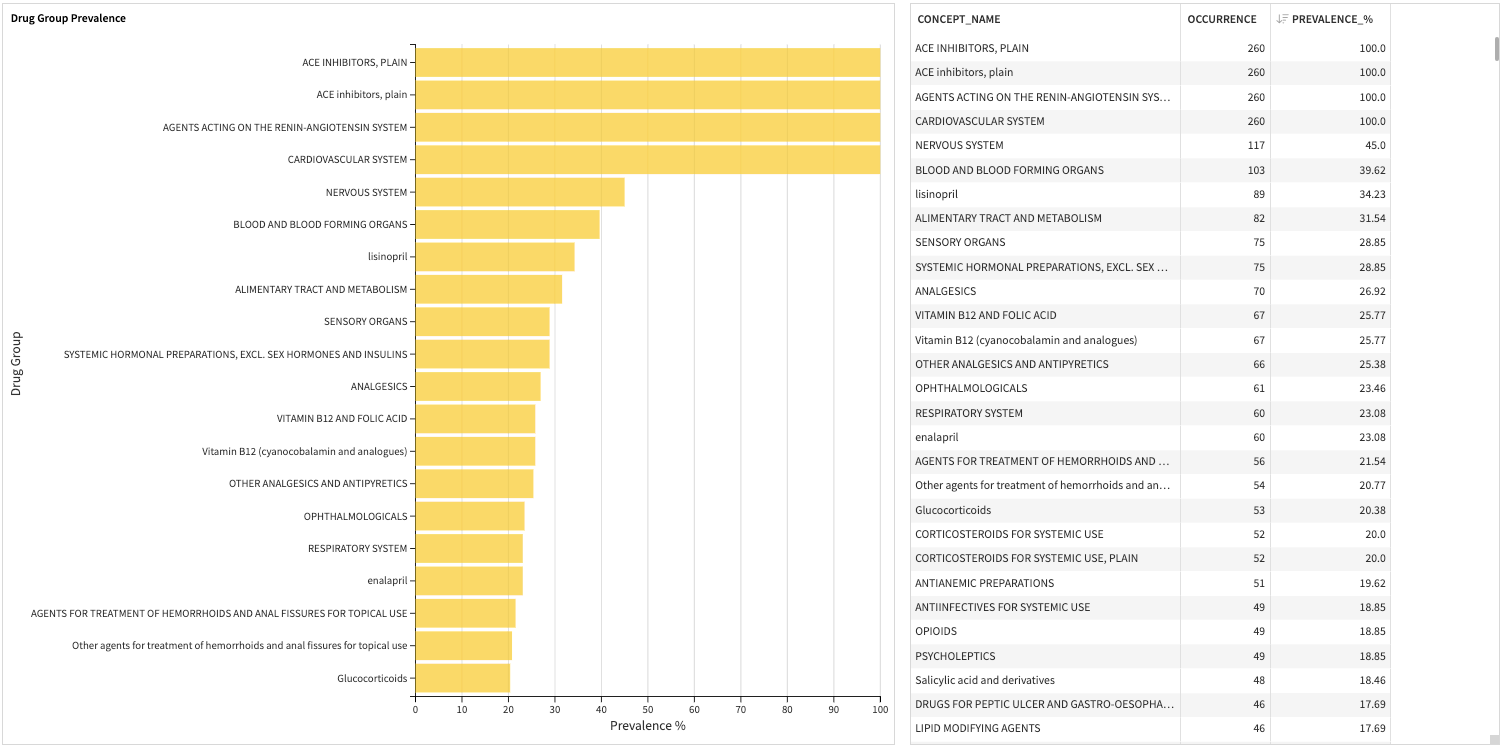
Drug group covariates include drug concept groups represented by WHO ATC.

Clinical visit covariates: The OMOP concepts define the clinical visit type. The pivot table describes the temporal relationships between clinical utilization and the cohort.
Project output datasets#
This Solution creates several output datasets that other projects can share for further analysis:
OMOP results schema table cohort and cohort_definition
Cohort feature tables cohort_demographics, cohort_visit_events, cohort_condition_group_events, cohort_drug_group_events
Conclusion#
The project setup provides a no-code user interface to configure complex cohort ingesting pipelines. This pipeline creates centralized storage for cohort scripts, cohorts, and metadata, which is sharable and reusable across different projects.
Once you’ve configured the pipeline, you can grow the cohort repository over time by ingesting cohorts. The cohort dashboard gives a quick review of the results from a cohort query to facilitate cohort validation.
Responsible AI statement#
In developing and deploying solutions like RWD Cohort Discovery in healthcare, several concerns related to responsible AI should be addressed to ensure fairness, transparency, and accountability. Below are some key ethical considerations and potential biases to be mindful of concerning the creation and use of patient cohorts based on observational health data coming from medical systems or longitudinal patient insurance claims.
Bias in input data#
Demographic bias#
The input patient data or the created cohort based on clinical criteria may over-represent certain demographics (for example age, gender, race, or location). This can lead to biased cohort insights. For example, if data skews toward urban areas, the Solution may not accurately capture the observational health outcomes in rural regions.
Important
Ensure data represents diverse patient social factors, health systems, and demographics. On a regular basis, review and audit datasets created in cohorts to detect any demographic imbalances that could lead to biased or inaccurate insights derived from real-world patient data.
Socioeconomic bias#
Data on patient populations may inadvertently favor wealthier areas or practices due to inequity in healthcare access or social imbalances around seeking care or reimbursements for care. This may result in bias against those serving lower-income communities.
Important
Balance datasets and evaluate patients in a cohort by including data from various economic and social factor strata and regions to ensure equitable representation.
Data quality and source bias#
Input data may come from various sources (for example multiple claims, EMR systems, or syndicated data providers), each with its own biases and quality. Potentially duplicated patient records from multiple sources could also bias estimates of cohort incidence or prevalence.
Important
Consider the limitations of each data source. Use techniques like data augmentation, bias correction, quality metrics, and checks to ensure that the quality of possibly disparate data sources doesn’t lead to biased patient population cohorts for further analysis.
Moreover, you should use patient cohorts created from this Solution to promote and prioritize unbiased and accurate insights from observational patient health signals. They should promote research to develop programs that improve patient outcomes and therapeutic or health access and journey, instead of re-enforcing disparities or biases in healthcare.
You should evaluate further models built in real-world evidence (RWE) studies with a rigorous, responsible AI ethics process to ensure:
Biases aren’t propagated.
All subpopulations are considered.
The observational nature of the data is incorporated (through methods like propensity matching and causal analysis) to avoid confounding factors, and model interpretability and explainability is in place.
Caution and consideration of sample Solution data#
As a reminder, the synthetic data sources used in the example app of this Solution don’t reflect, in any way, real distributions of patient or disease characterizations. No insights or assumptions around observational health outcome patterns should be made from the examples insights derived from the patient cohorts. They shouldn’t be used in any further downstream business decision processes.
Please refer to the Centers for Medicare and Medicaid Services (CMS) Linkable 2008-2010 Medicare Data Entrepreneurs’ Synthetic Public Use File (DE-SynPUF) for further details.
Tip
Check out Dataiku’s Responsible AI Academy course to learn more.
Reproducing these processes with minimal effort for your data#
This project equips biomedical informaticists or clinical researchers to understand how they can use Dataiku to create a centralized repository to store and manage cohorts (clinical electronic phenotyping) from real-world data.
This documentation has provided several suggestions on how to derive value from this Solution. Ultimately however, the “best” approach will depend on your specific needs and data. If you’re interested in adapting this project to the specific goals and needs of your organization, Dataiku offers roll-out and customization services on demand.

