
Tutorial | Build a visual Dataiku app#
Get started#
Dataiku apps allow users to package Dataiku projects into reusable applications with customizable inputs and pre-defined actions. Let’s build one together to demonstrate the power of this feature!
Objectives#
In this tutorial, you will:
Convert a Dataiku project into a reusable Dataiku app.
Design a Dataiku app that allows a user to edit a project variable, run a scenario, and download the output data.
Create additional app instances to see the similarities and differences between a Dataiku project and an app.
See how version management works for a Dataiku app.
Prerequisites#
To reproduce the steps in this tutorial, you’ll need:
Dataiku 13.4 or later.
Intermediate knowledge of Dataiku (recommended courses in the Advanced Designer learning path or equivalent).
From the Dataiku Design homepage, click + New Project.
Select Learning projects.
Search for and select Dataiku Apps.
If needed, change the folder into which the project will be installed, and click Create.
From the project homepage, click Go to Flow (or type
g+f).
Note
You can also download the starter project from this website and import it as a ZIP file.
Use case summary#
The project has three data sources:
Dataset |
Description |
|---|---|
tx |
Each row is a unique credit card transaction with information such as the card that was used and the merchant where the transaction was made. It also indicates whether the transaction has either been:
|
merchants |
Each row is a unique merchant with information such as the merchant’s location and category. |
cards |
Each row is a unique credit card ID with information such as the card’s activation month or the cardholder’s FICO score (a common measure of creditworthiness in the US). |
You can surface Dataiku apps either as a visual app or an app-as-recipe. In this tutorial, you will create a visual app.
Review the project’s Flow and scenario#
At a high level, this project’s Flow combines transaction, customer, and credit card data. Using visual recipes, it prepares this data and transforms it through a data pipeline in a number of different ways.
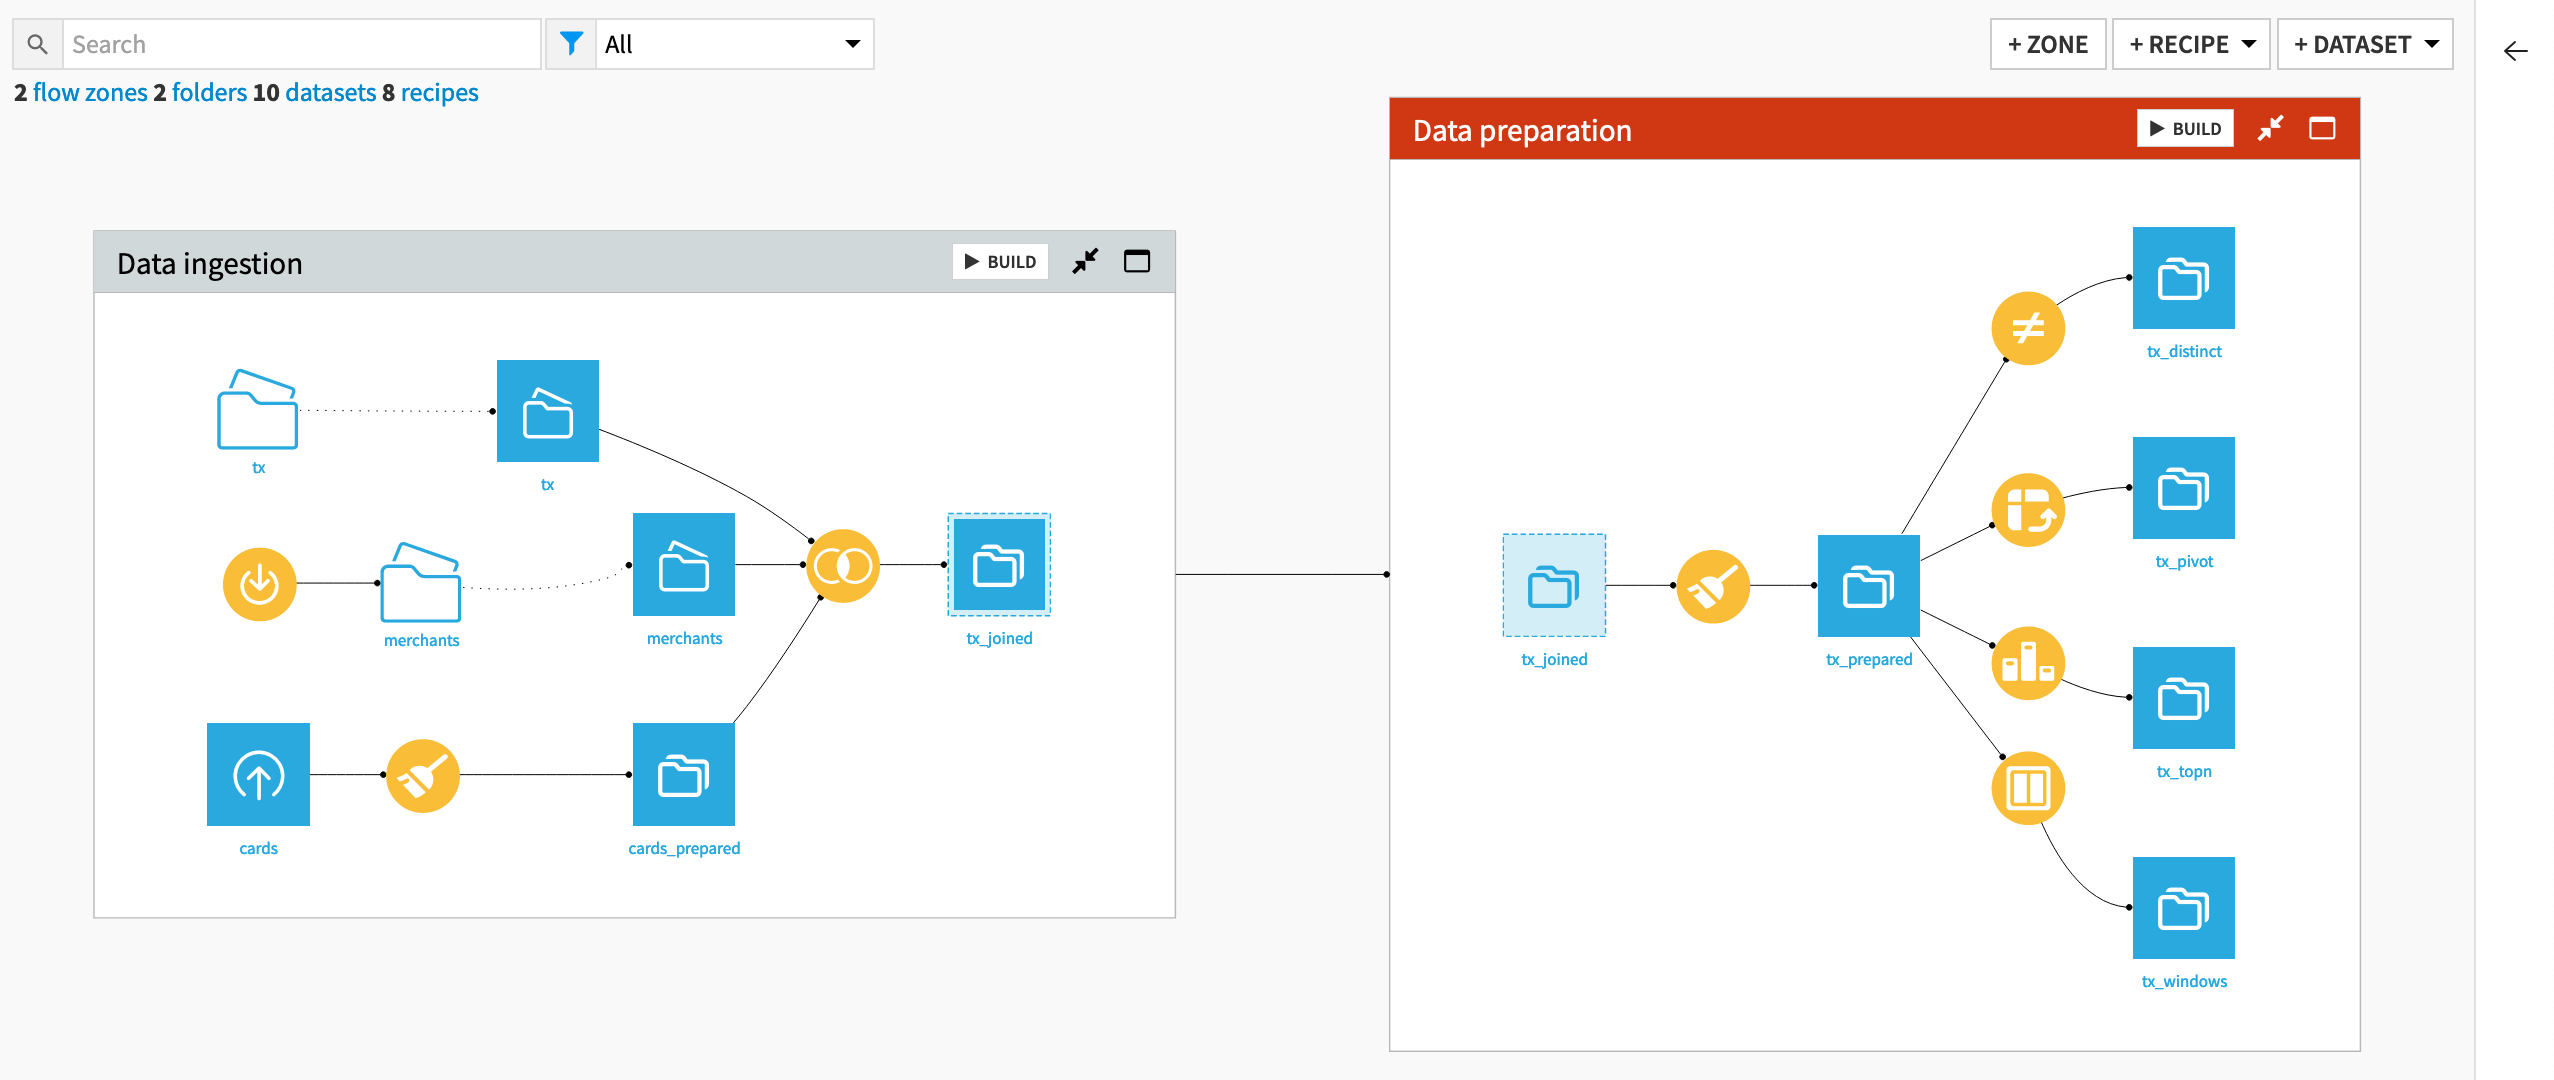
Before designing a Dataiku app, note what’s of greatest interest for this tutorial:
The Join recipe includes a pre-filter step that limits transactions to a specific month (January 2017) set by a project variable tx_month.
Note
You can see the variable in the More Options (
 ) > Variables menu of the top navigation bar.
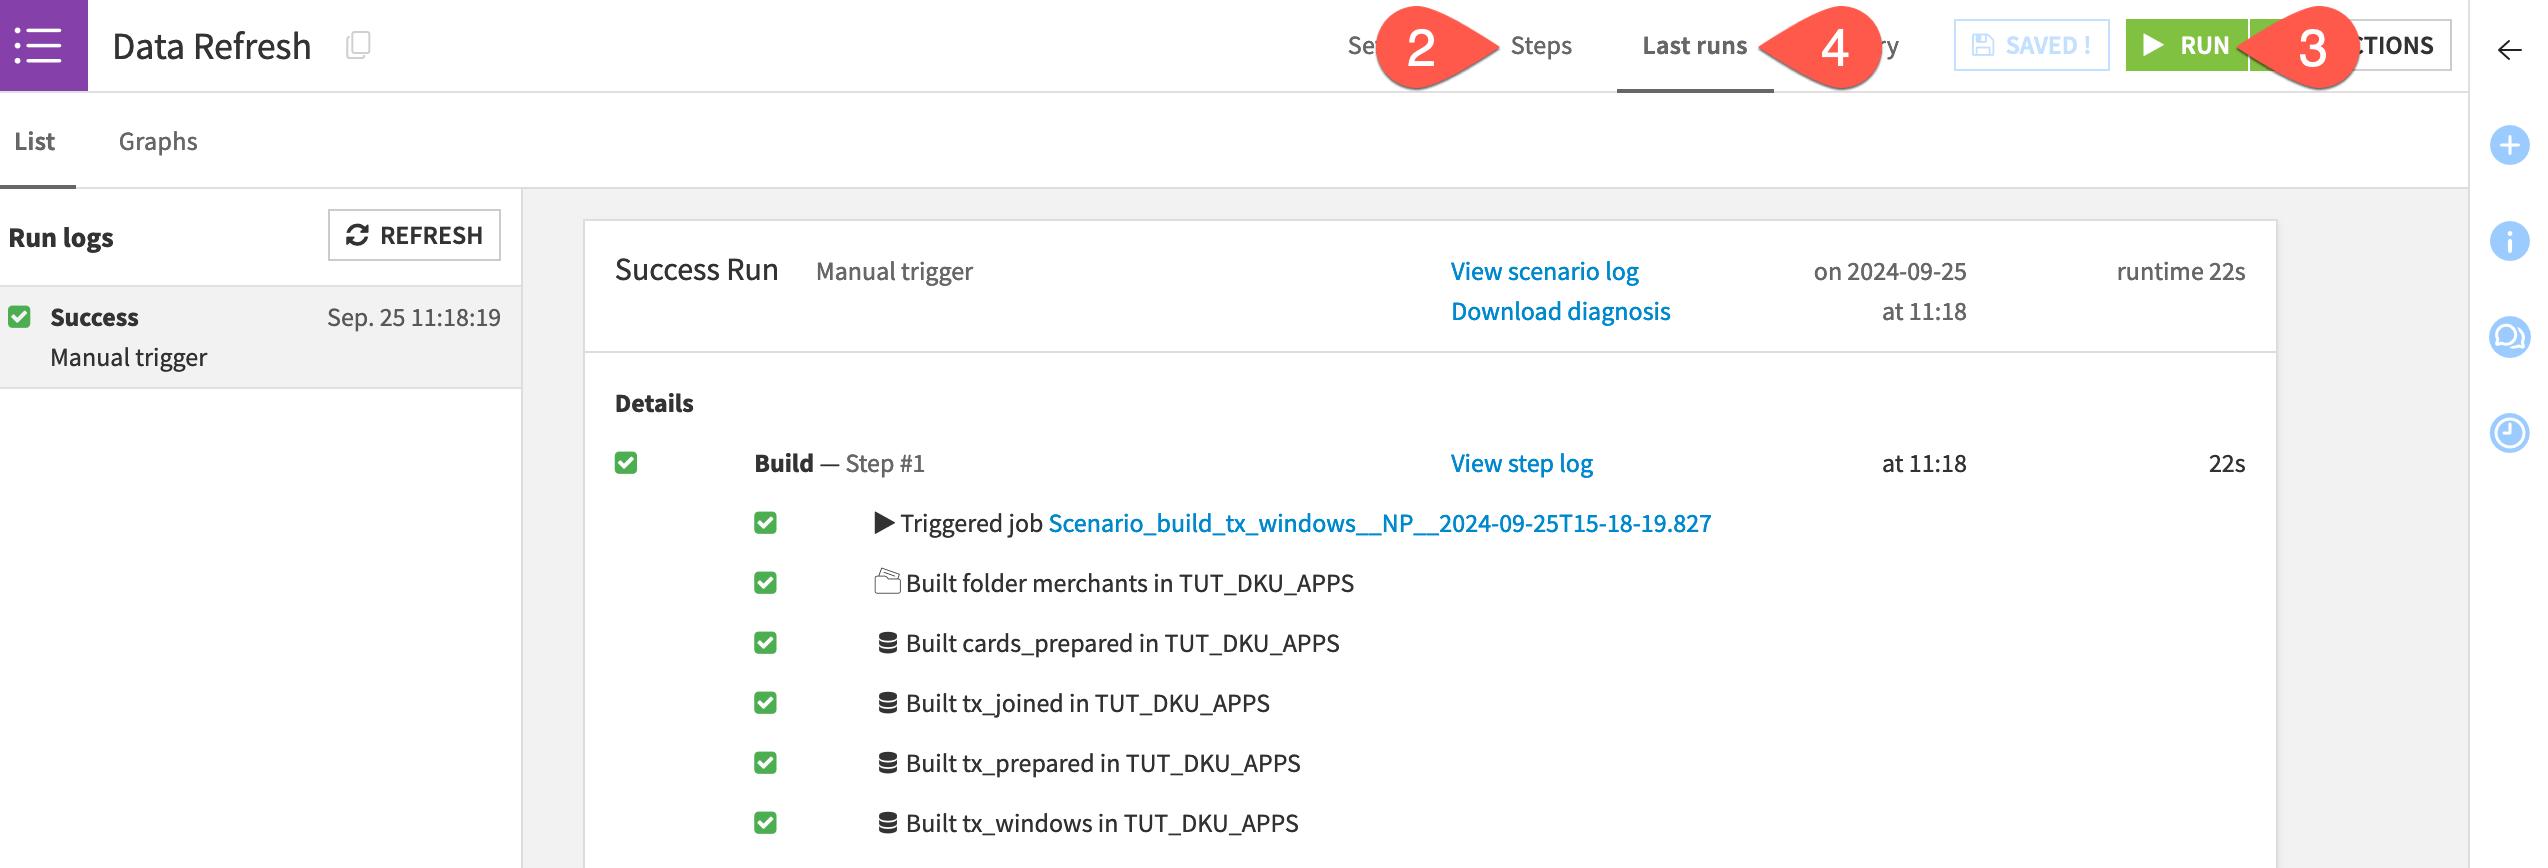
The Data Refresh scenario automates the build of the tx_windows dataset.
From the Jobs (
 ) > Scenarios menu, open the Data Refresh scenario.
Navigate to the Steps tab to review its actions.
Click Run to trigger it.
Tip
Feel free to manually refresh the scenario run status.
Navigate to the Last runs tab to confirm its success.
Once the scenario finishes successfully, if you go back to the Flow (g + f), you’ll see that the tx_windows dataset has been built. It only includes transactions for January 2017 as the Join recipe filters on that month as explained above. This is the dataset that the app will use to allow users to export the data for their month of interest.
Convert the project into a Dataiku app#
Converting a project into a Dataiku app allows other users (including those unfamiliar with the internal project details) to customize and execute some core functionality provided by the project.
For example, imagine other users on your team routinely need access to customized versions of this project’s assets, such as the final output data. You can create a Dataiku app from the project at hand so that anyone can download refreshed data for their own month of interest.
To get started:
From the top navigation bar, select More Options (
) > Application Designer.Select Convert into a visual application.
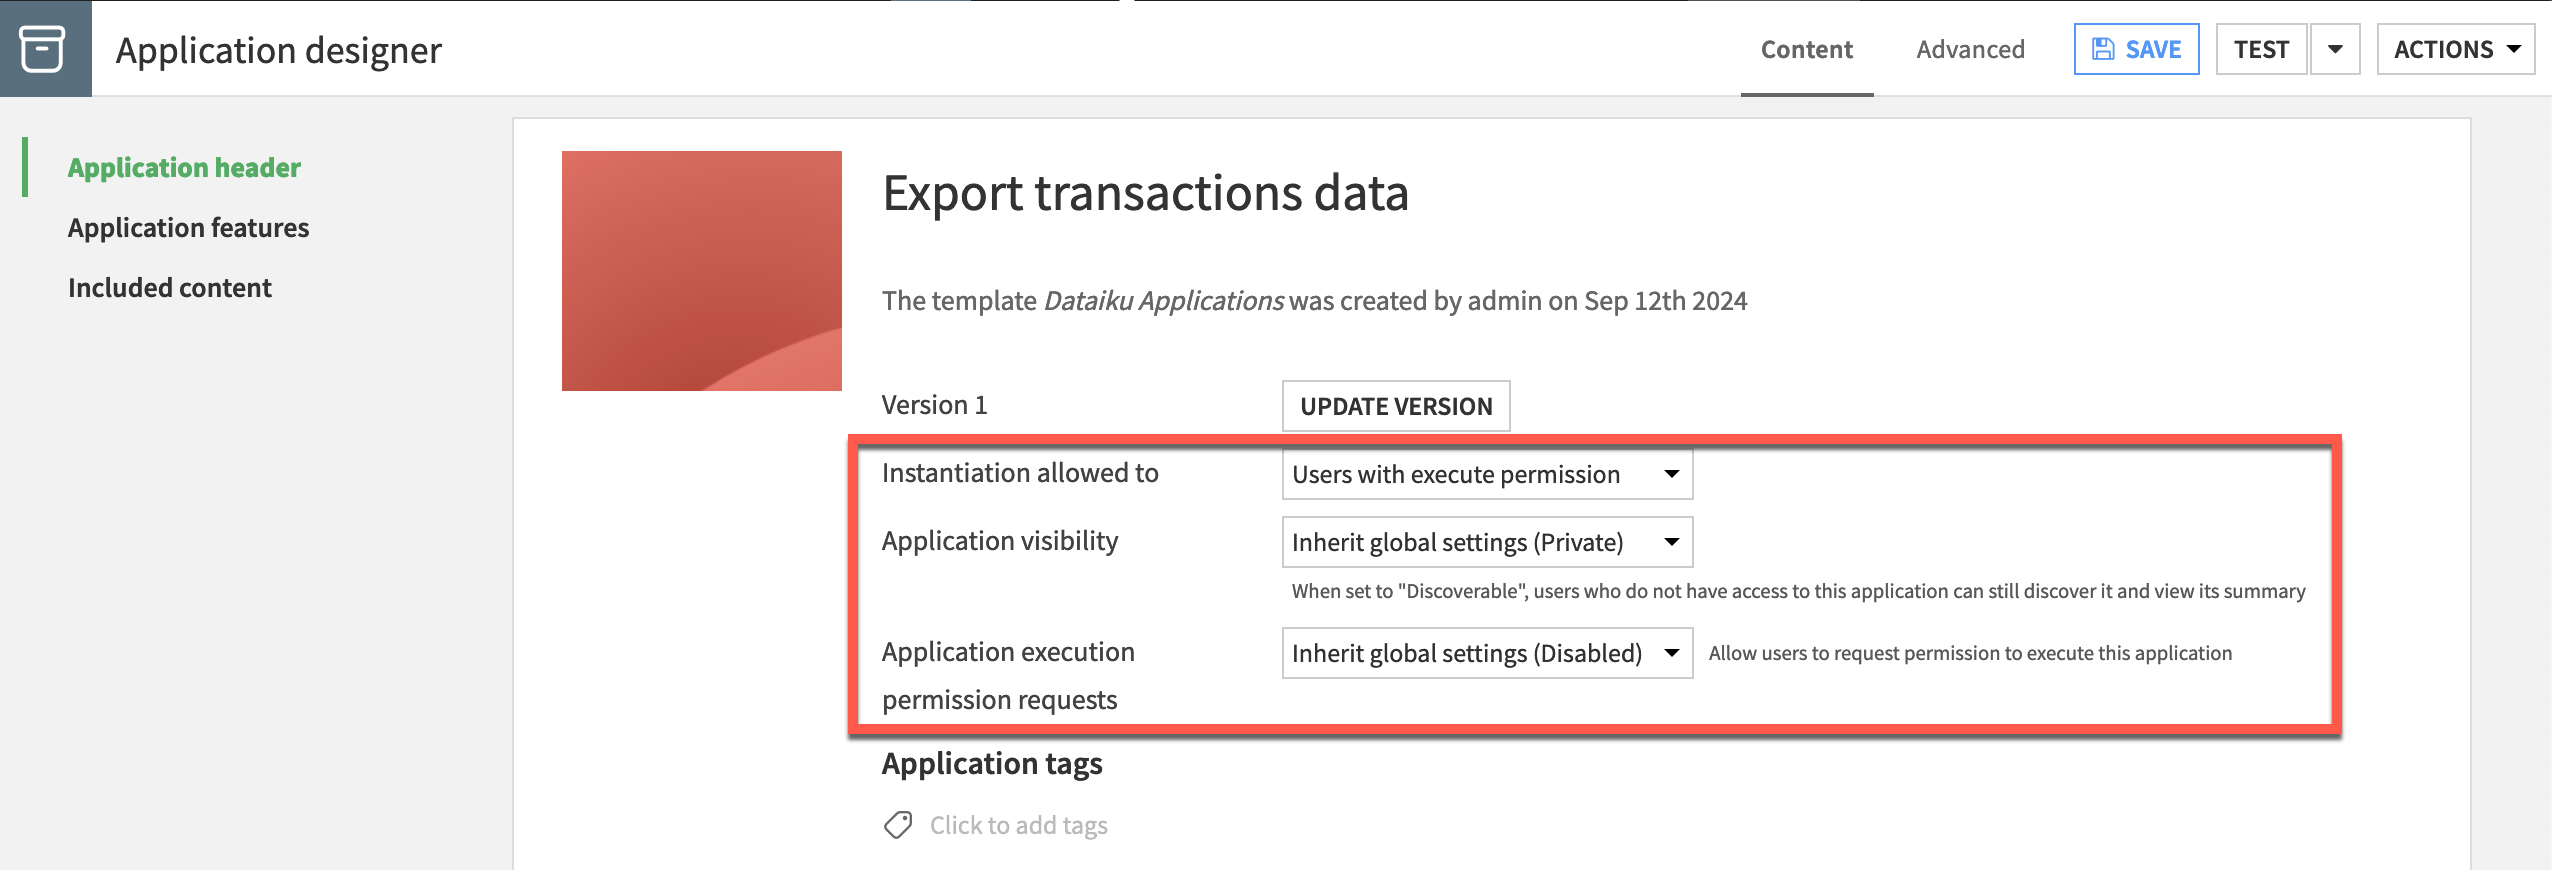
Configure the application header#
Start with defining some parameters in the application header.
Click the pencil icon next to the title, and rename it
Export transactions data.You can also define settings such as who can create, discover, and execute the app. As you are both the app’s creator and end user in this case, the default settings should be OK!
In the Customization section, feel free to customize the application rendering by adding a dedicated instance icon and banner or an image for the application to find it more easily in the application list.
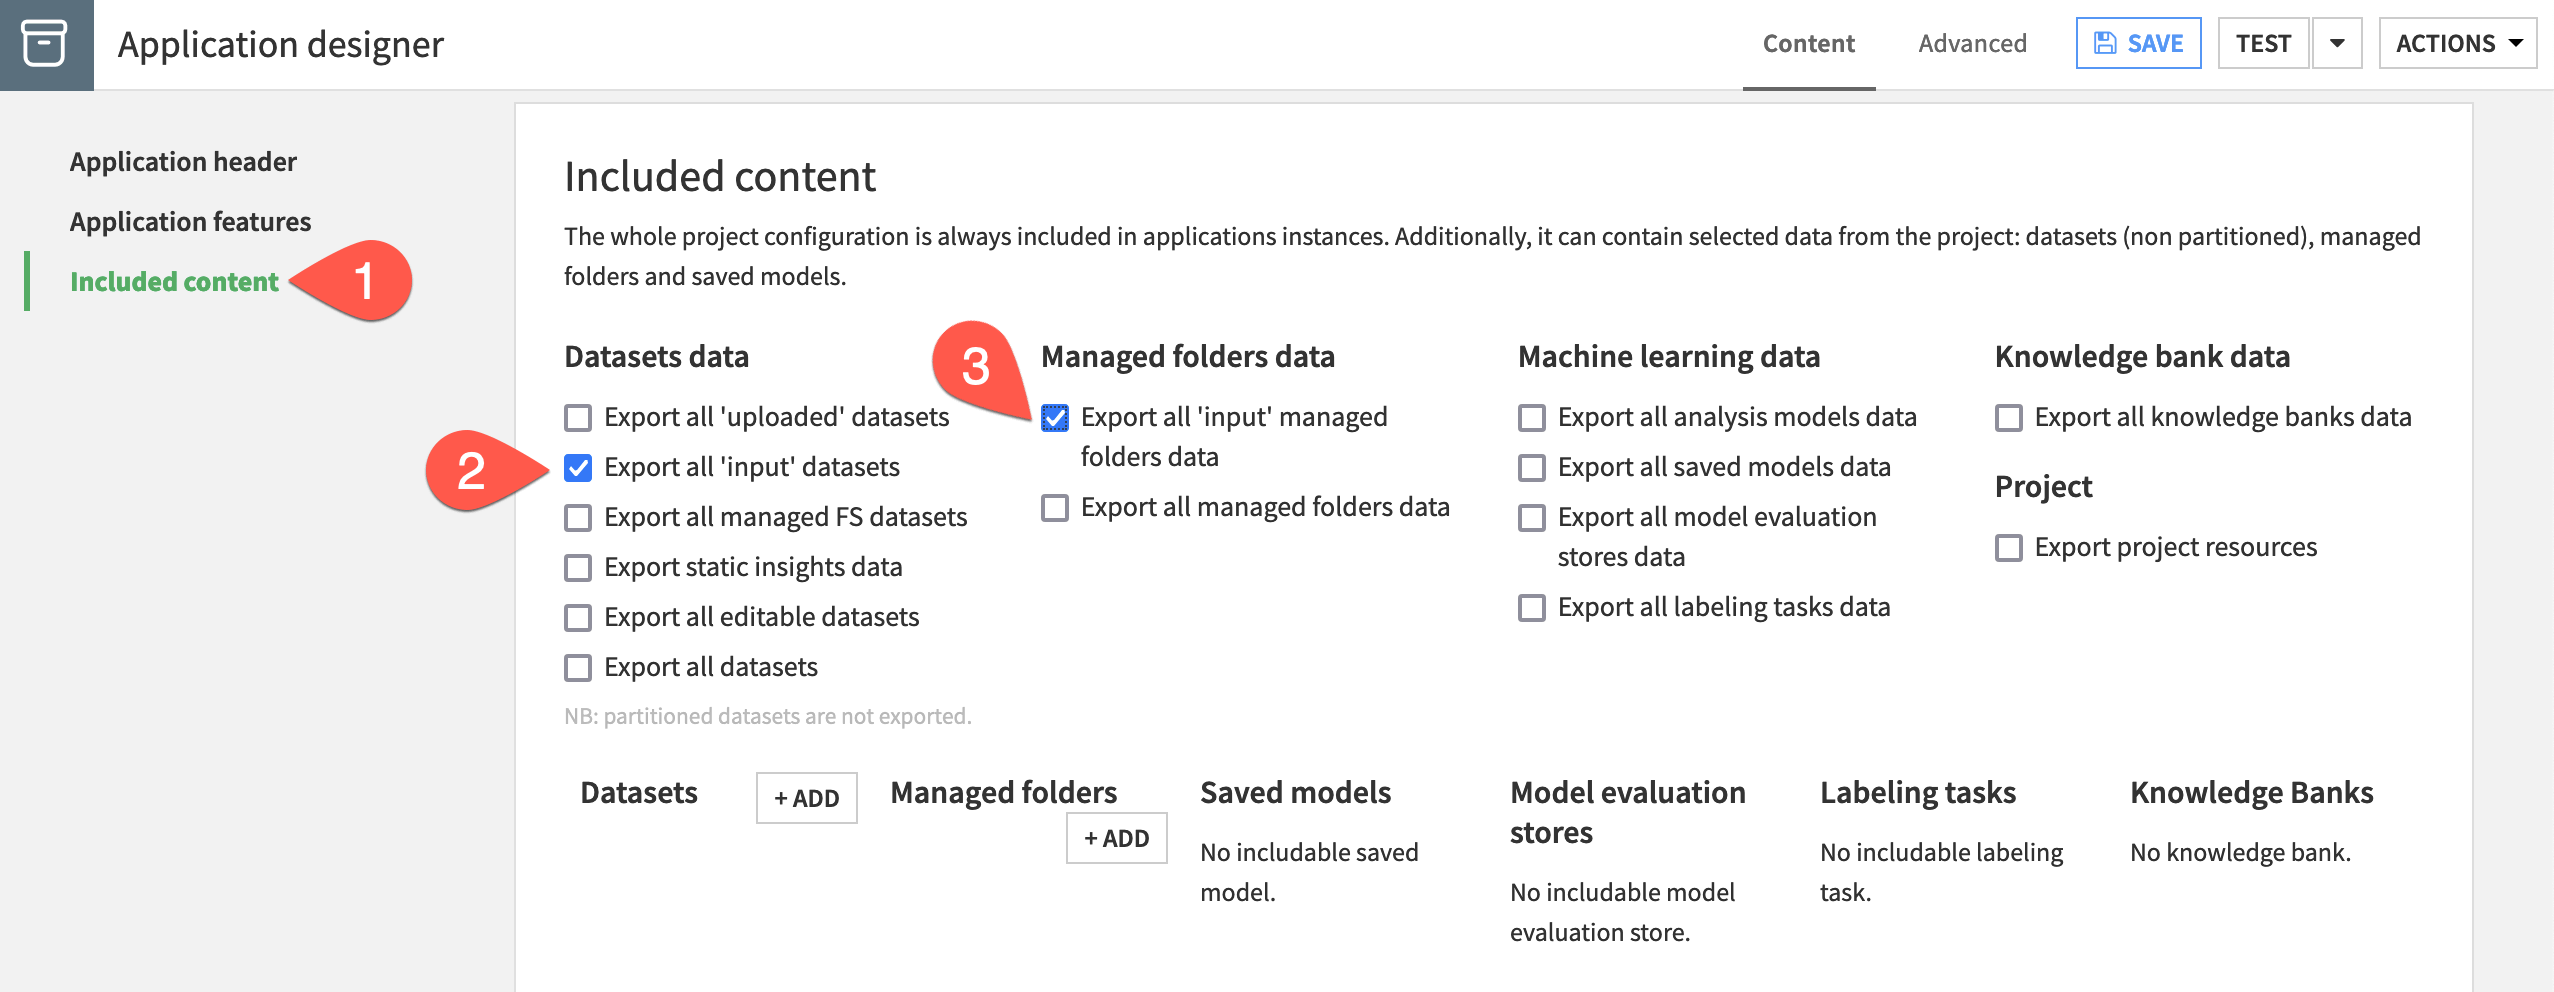
Configure included content#
In this project, all starting data resides in the actual project (as opposed to an external connection like a database or a bucket in the cloud). Accordingly, you’ll need to include those resources for the app to function.
Navigate to the Included content panel.
Check the box to Export all ‘input’ datasets.
Check the box to Export all ‘input’ managed folders data.
Note
You could also have explicitly selected which datasets or managed folders to include. This process is analogous to including additional content in a project bundle.
Design the app#
Now, you can design the functionality of the app by adding tiles of pre-defined actions.
Add a descriptive section#
To make the app more user-friendly, start by adding a section with descriptive content to explain its purpose.
At the bottom of the page, click Add Section.
Give the title
App description.
Tip
For longer apps with multiple sections, you can collapse individual sections to improve readability. Once in the app, click the arrow icon next to a section title to toggle it.
Add a tile for displaying instructions#
It’s good practice to guide end users by adding a descriptive text tile at the top of your section. This is especially useful when the app is used by people unfamiliar with the underlying project.
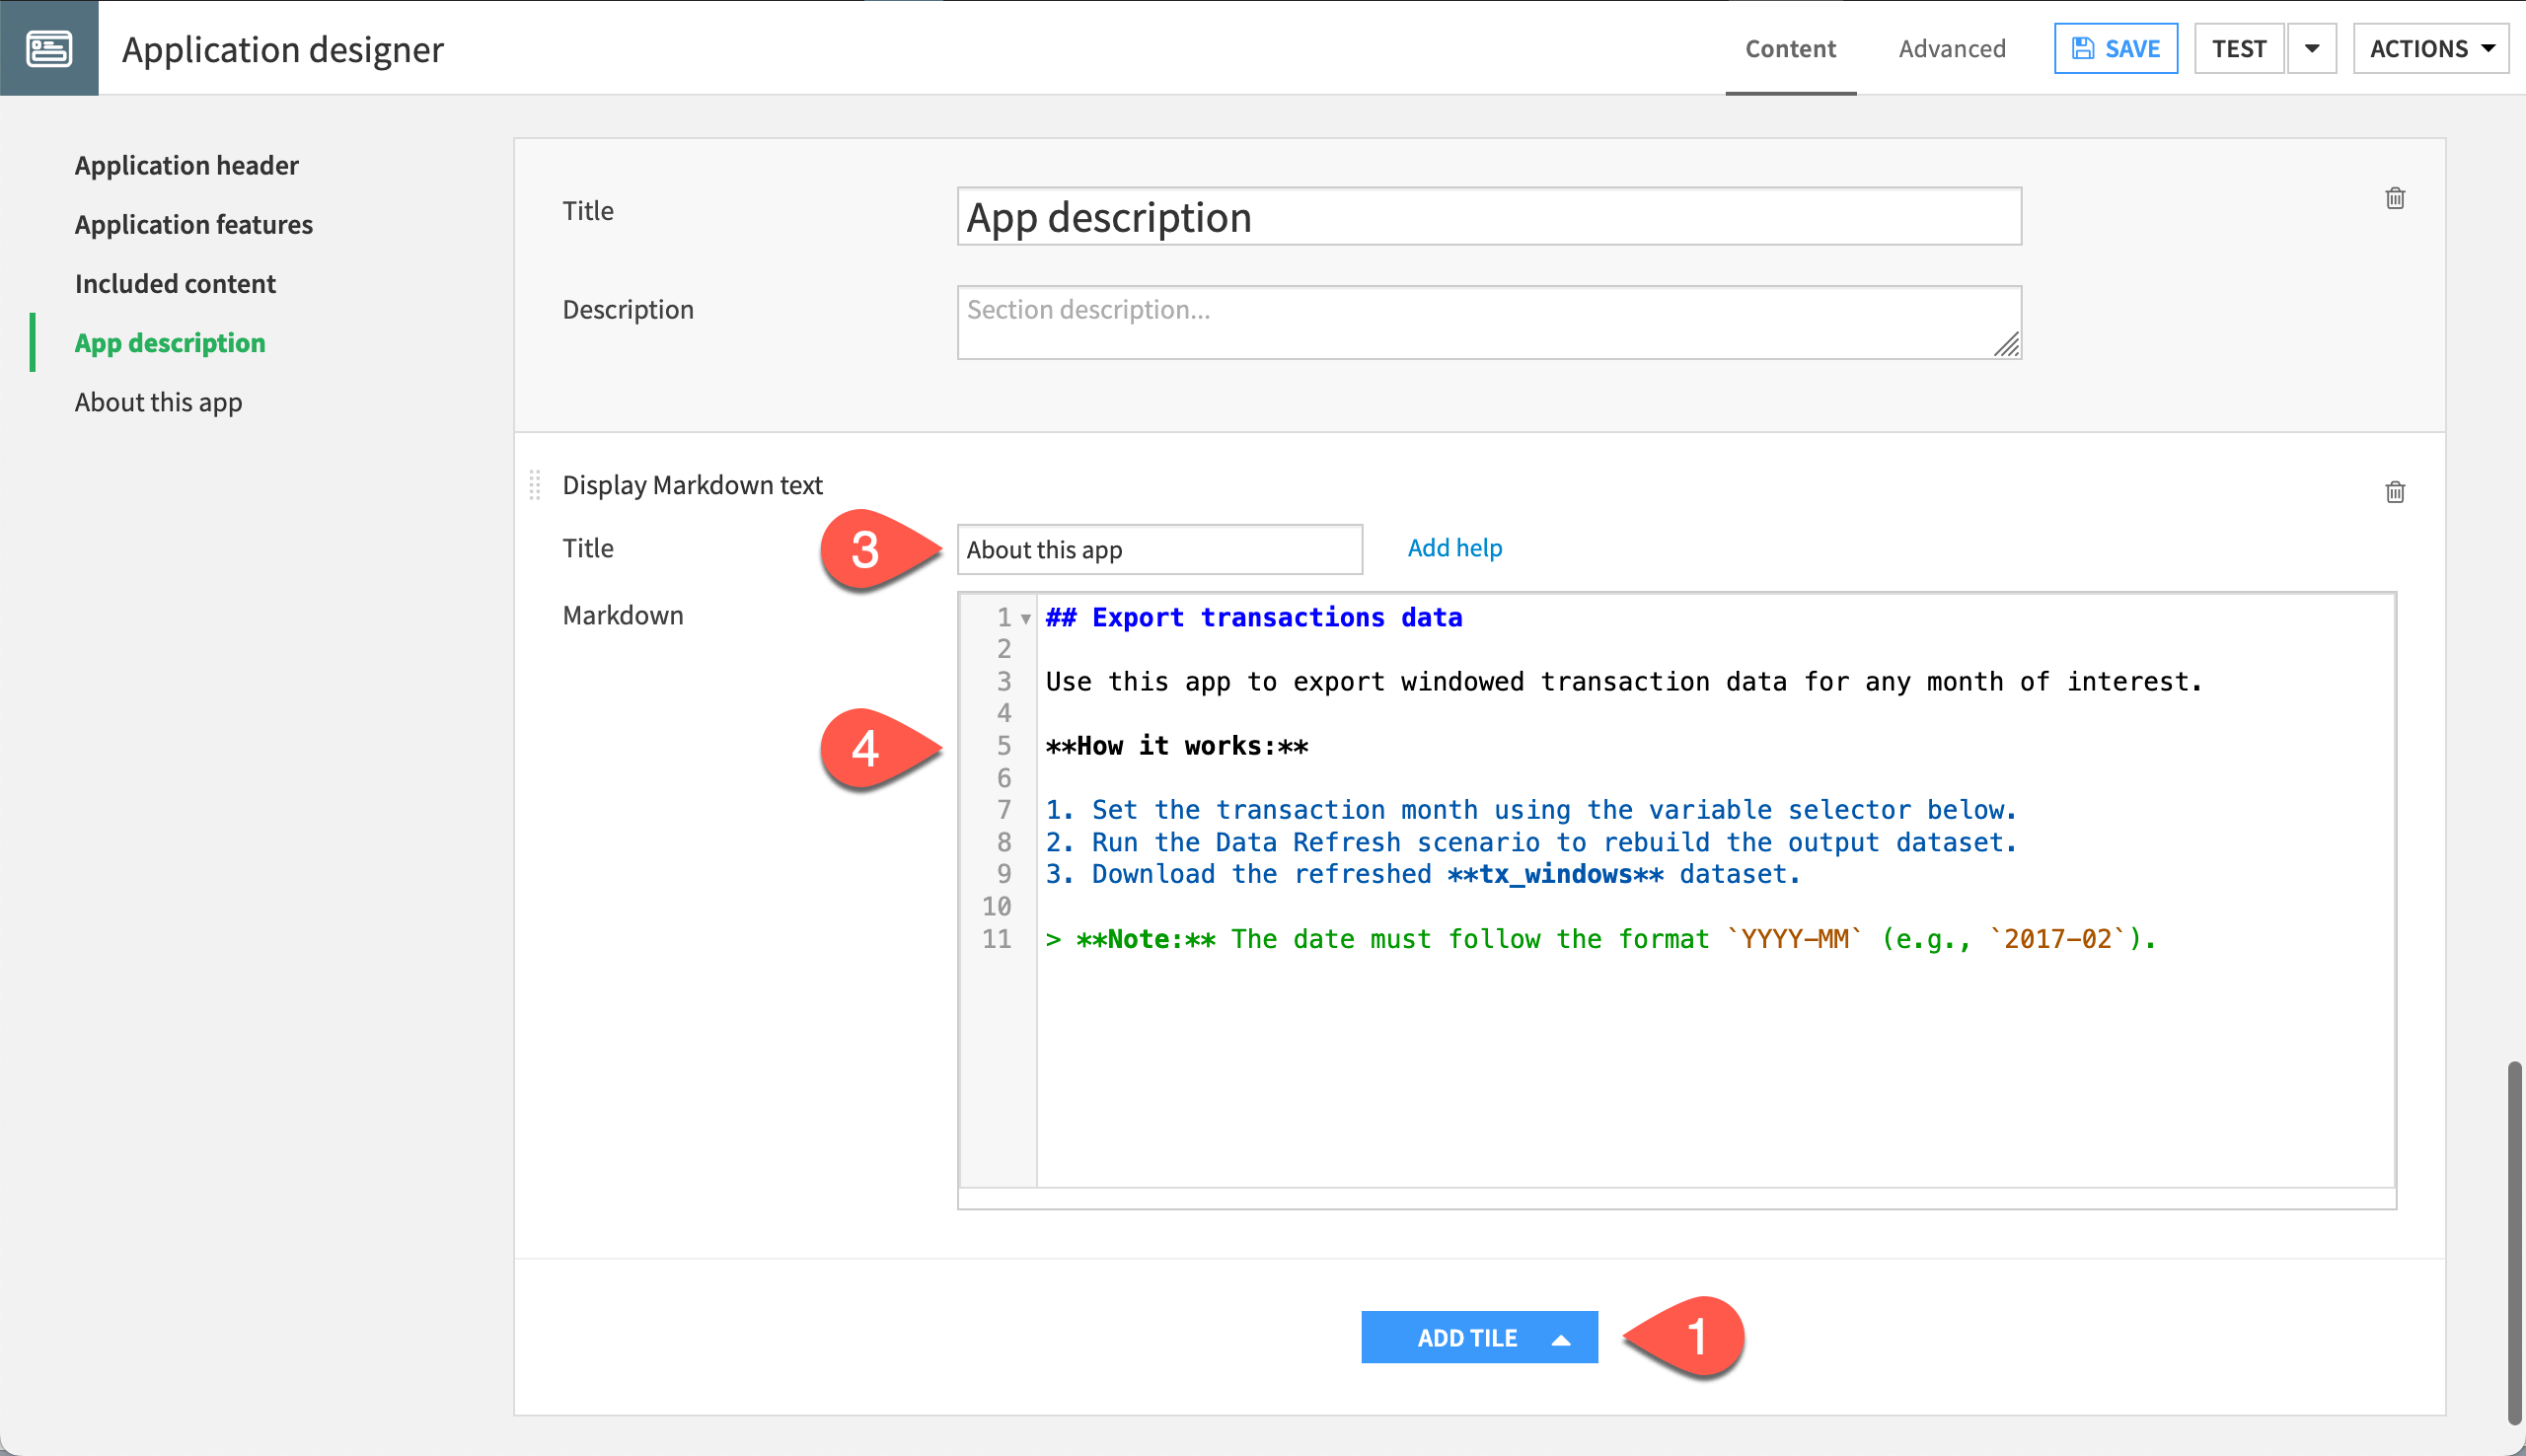
Click Add Tile.
Select Display Markdown text.
Give the title
About this app.In the editor, enter the following content:
## Export transactions data

Use this app to export windowed transaction data for any month of interest.

**How it works:**

1. Set the transaction month using the variable selector below.
2. Run the Data Refresh scenario to rebuild the output dataset.
3. Download the refreshed **tx_windows** dataset.

> **Note:** The date must follow the format `YYYY-MM` (e.g., `2017-02`).
Note
The Markdown tile uses a CodeMirror-based editor with syntax highlighting. Standard Markdown is supported, including headers, bold, italic, lists, and blockquotes.
Add a tile for displaying an image#
In the same section, you can also include an image tile to provide additional visual context to your users, such as a diagram of the data pipeline or a reference chart.
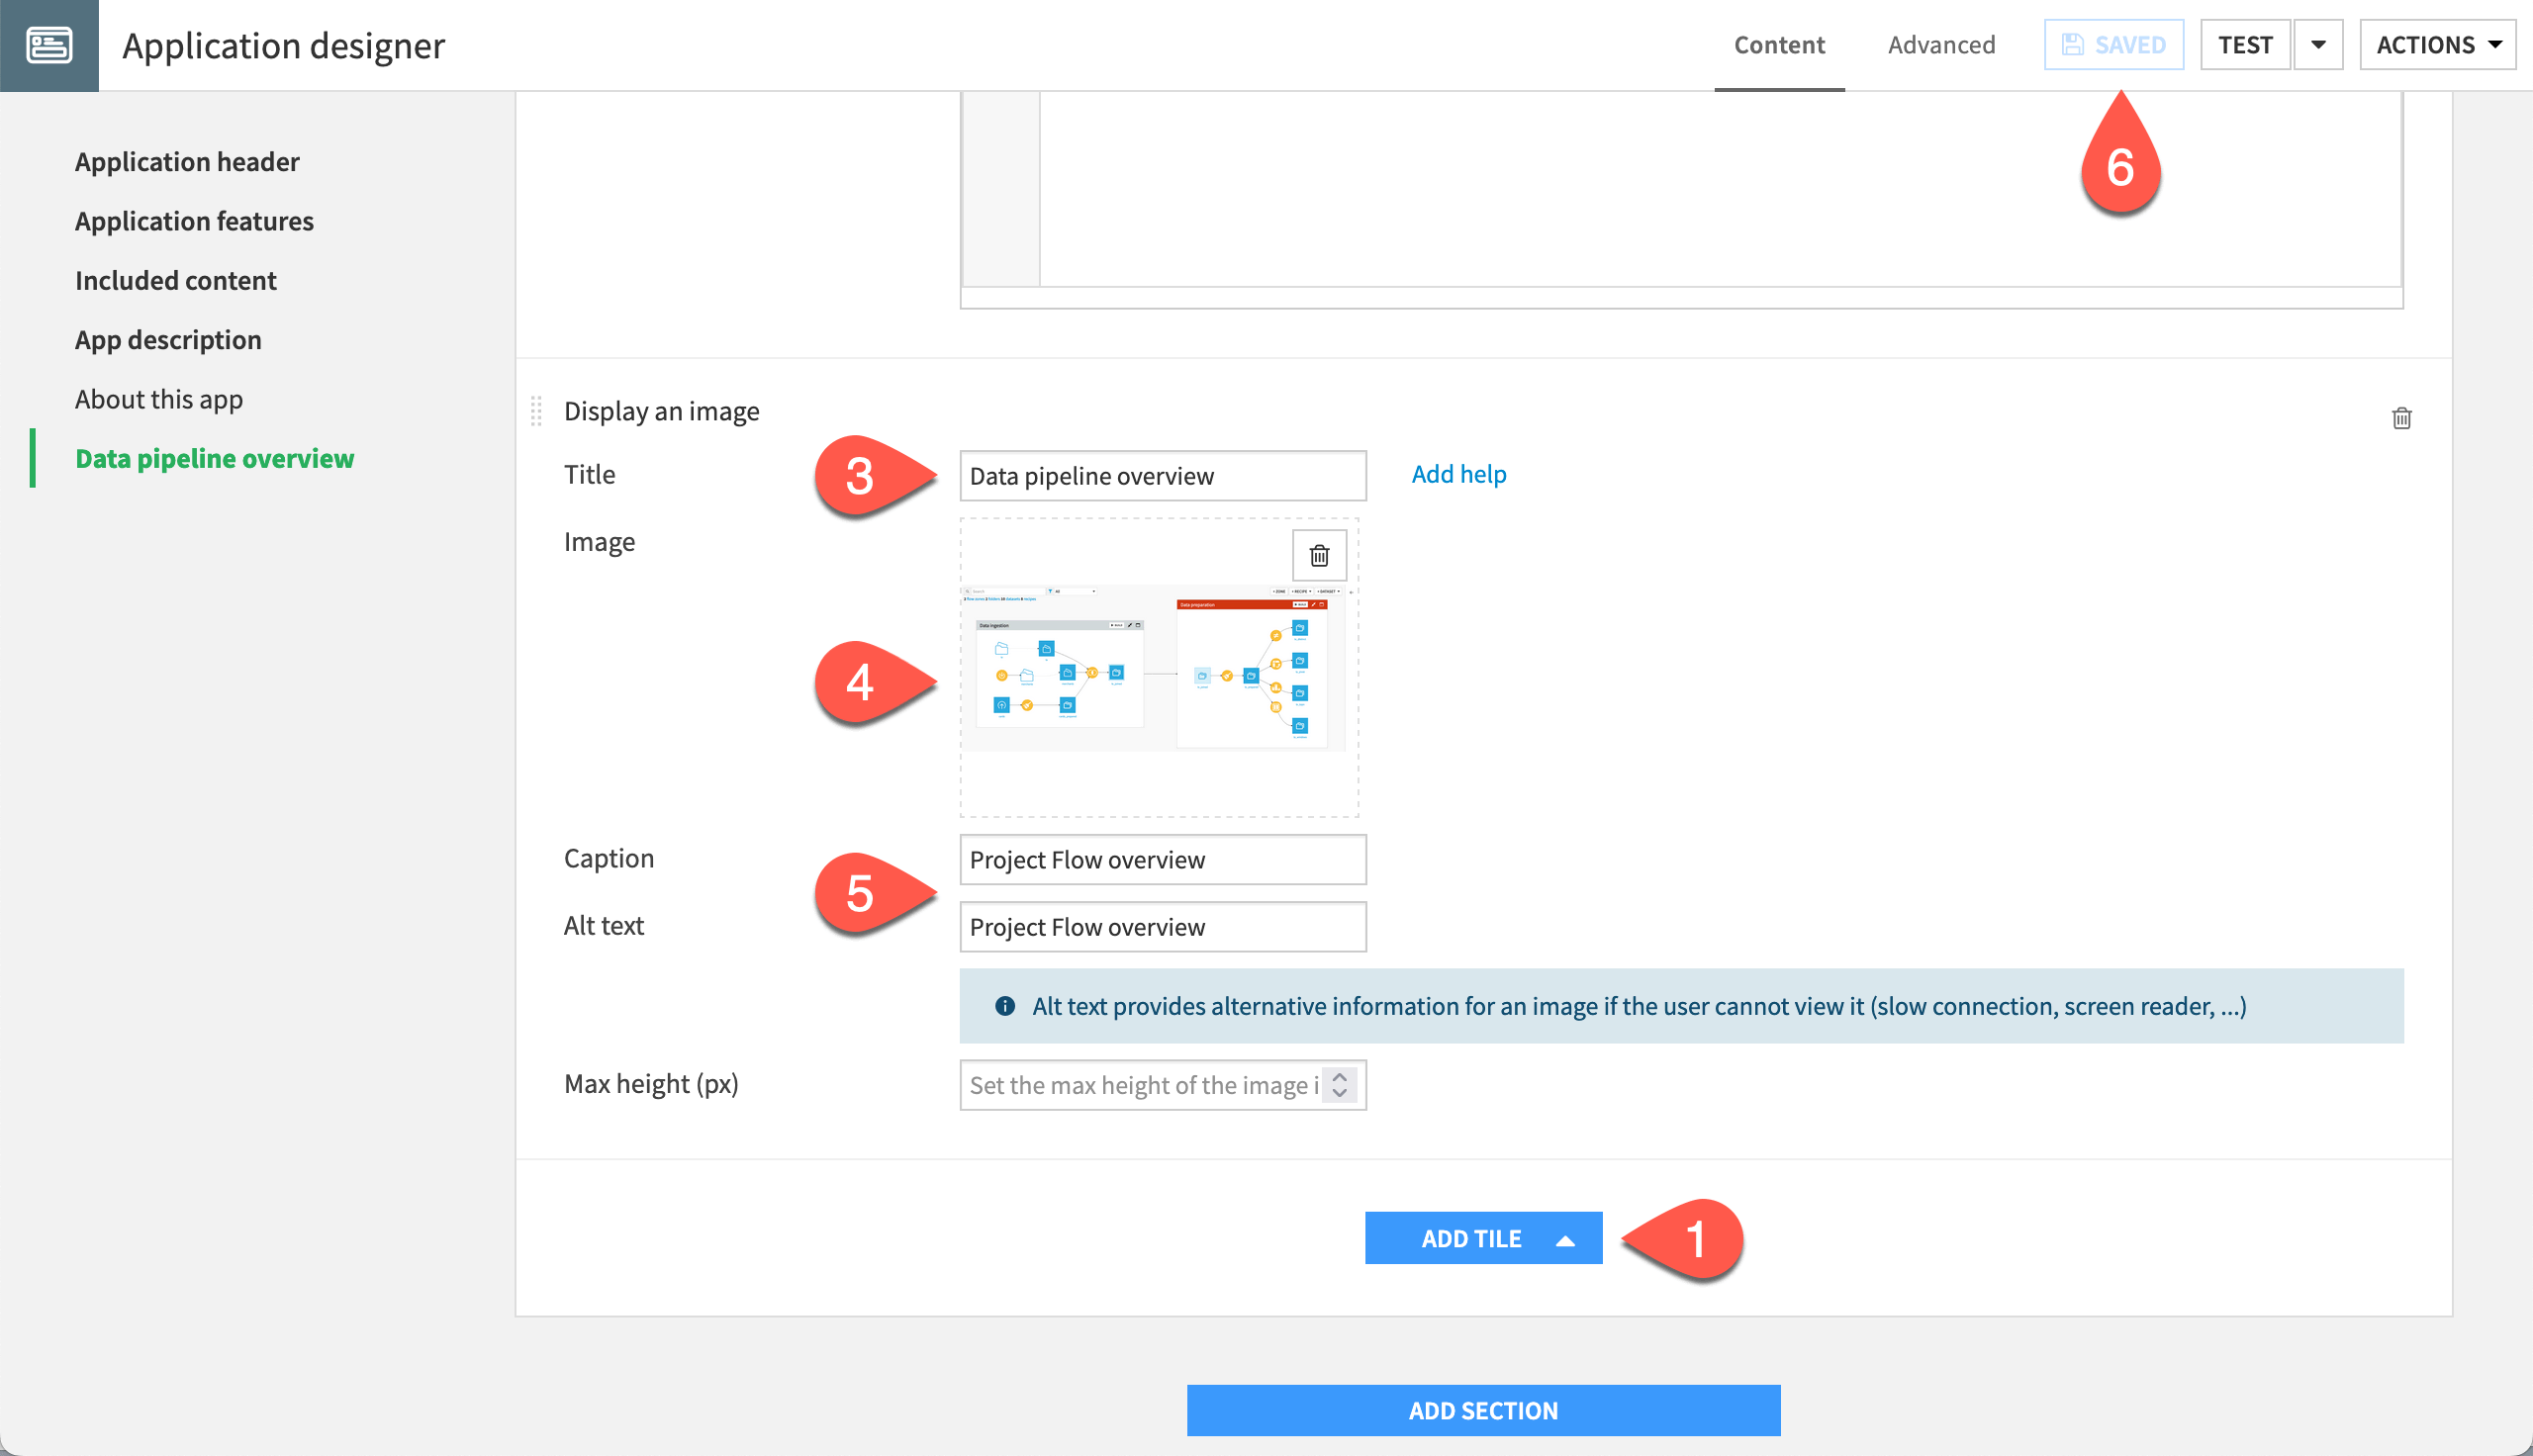
Click Add Tile.
Select Display an image.
Give the title
Data pipeline overview.Upload an image file (PNG or JPEG) representing the project Flow or any visual (the image you select doesn’t matter much in this tutorial).
In both the Caption and Alt text fields, enter
Project Flow overview.Click Save.
Add a section for the app’s core functionality#
Now that you’ve added some introductory content, add a new section for the core functionality of the app: setting a variable, running a scenario, and downloading the output dataset.
At the bottom of the page, click Add Section.
Give the title
Export windowed transaction data by month.
Add a tile for editing variables#
Now, add a tile that allows users to choose their month of interest (in other words, set a project variable) and optionally limit the number of rows in the output dataset.
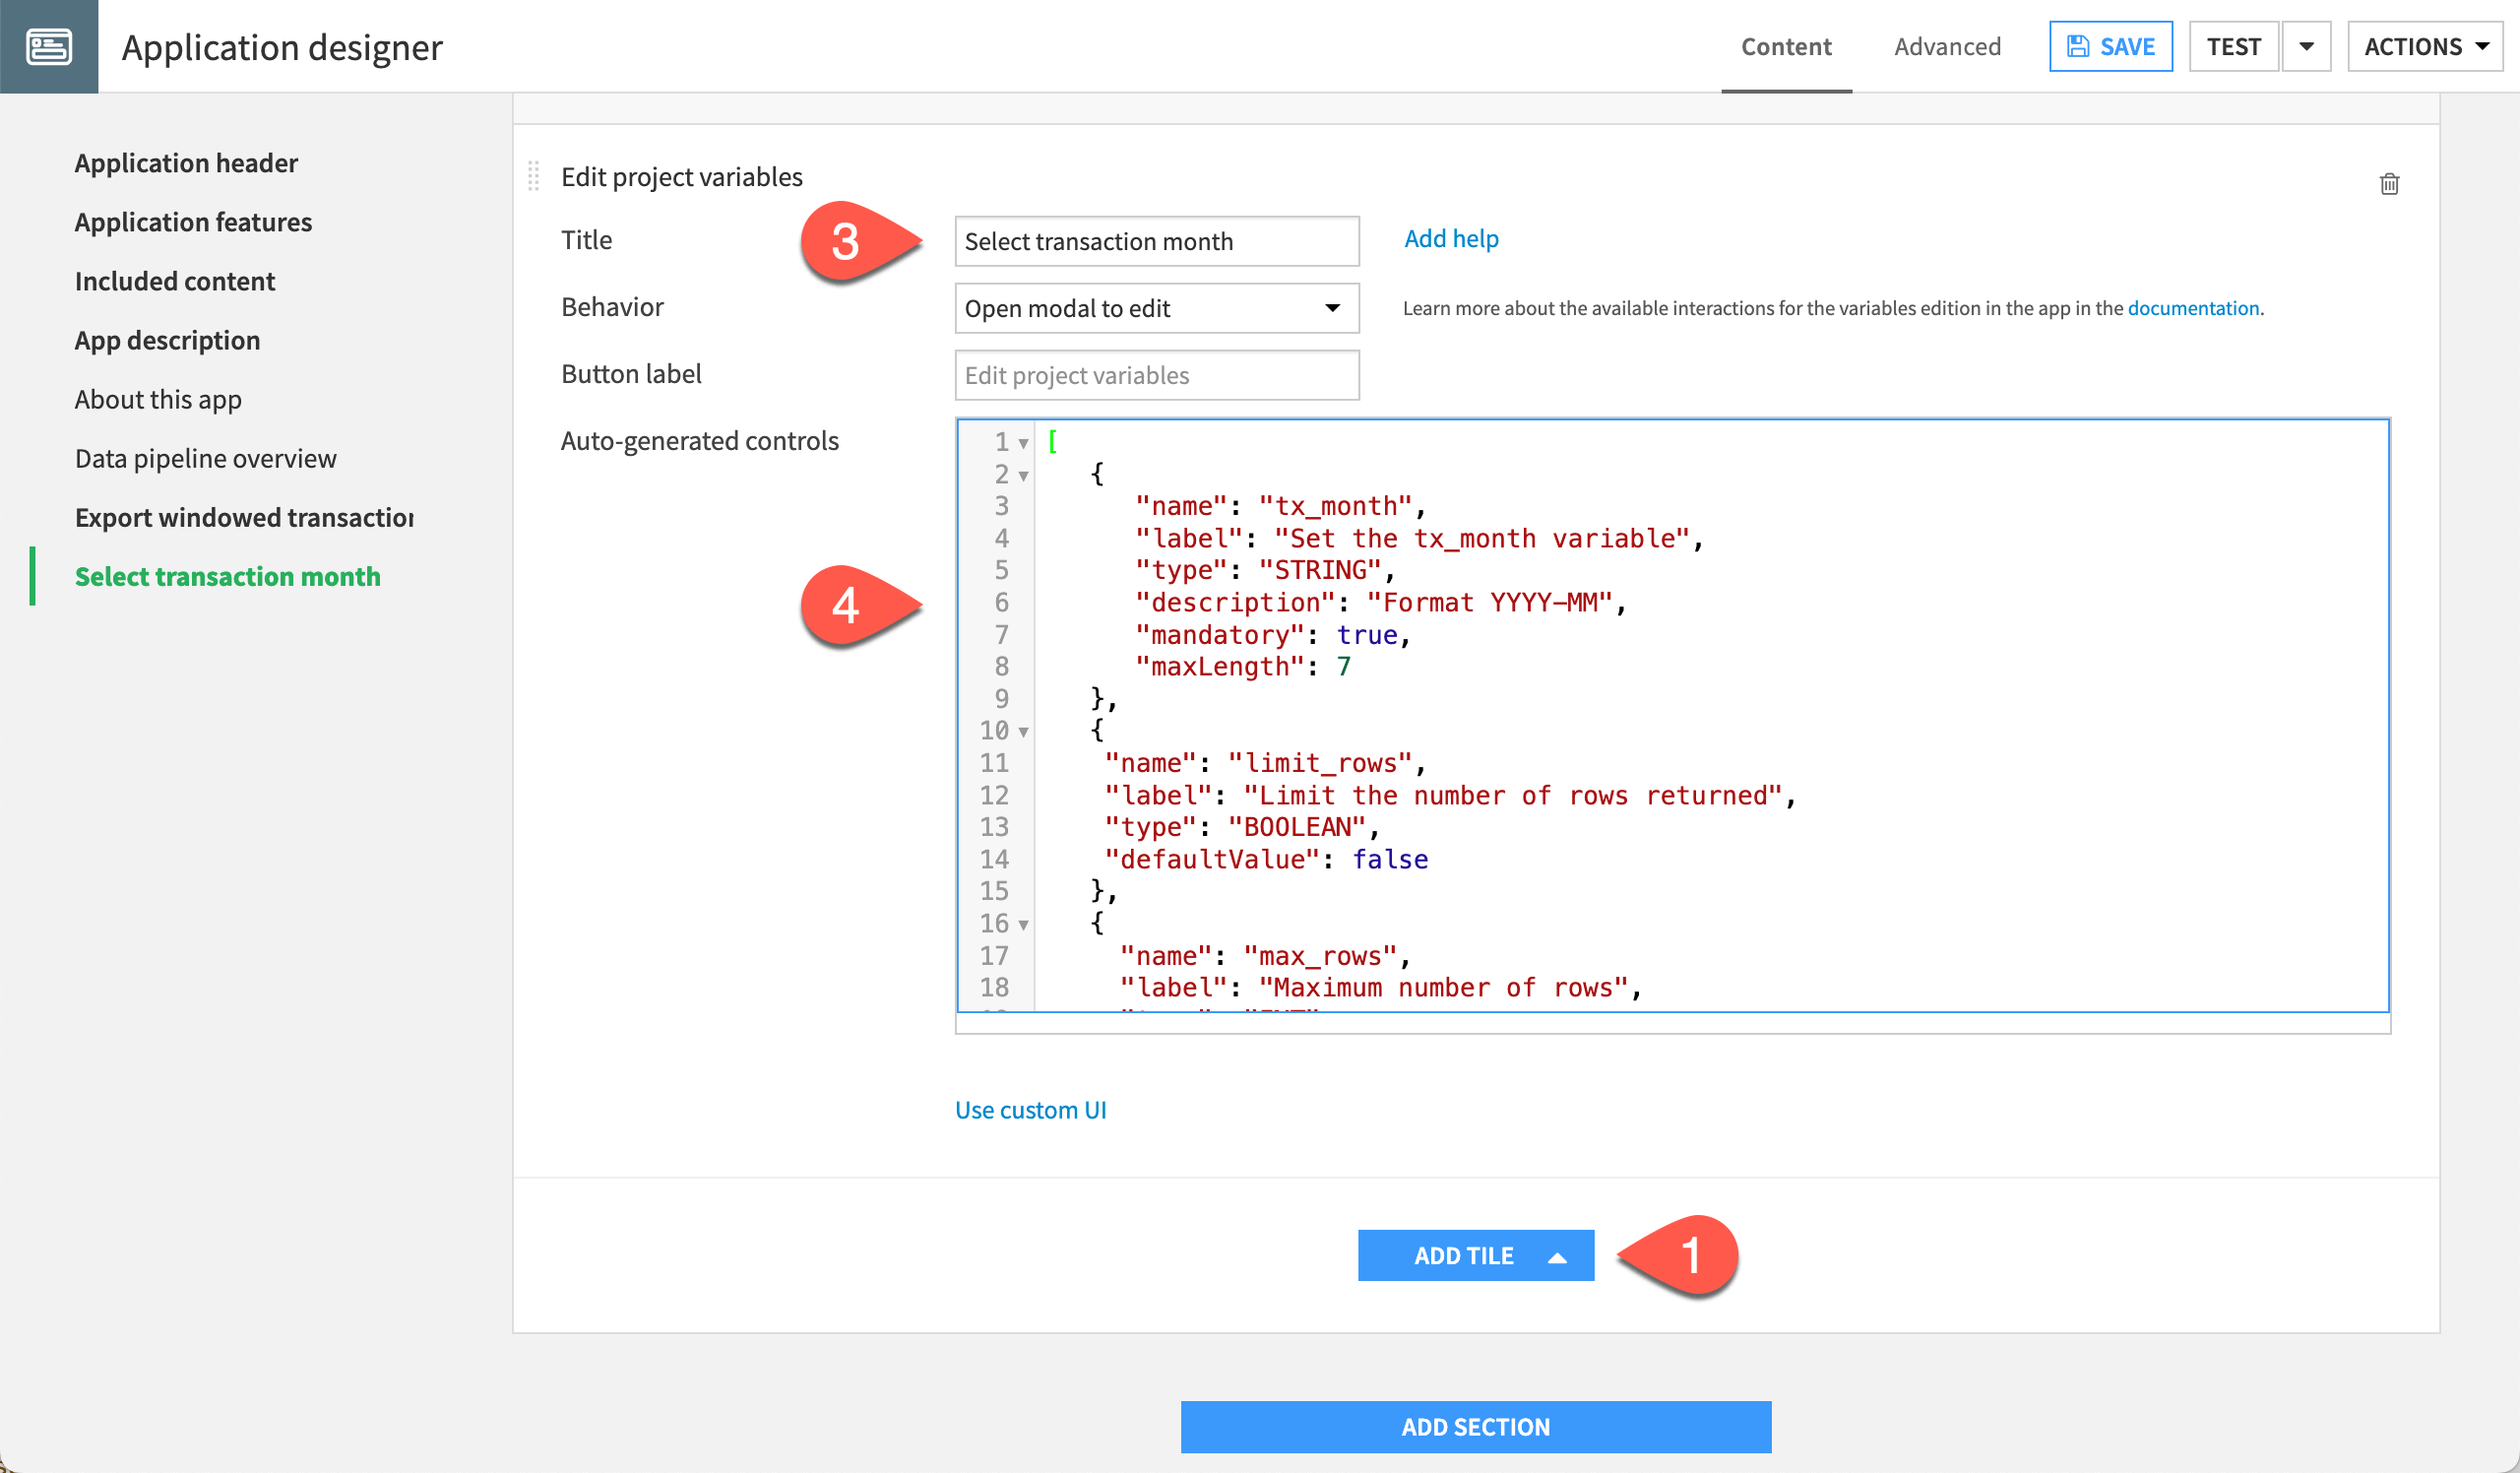
Click Add Tile.
Select Edit project variables.
Give the title
Select transaction month.Replace the auto-generated controls with the following JSON array:
[
   {
      "name": "tx_month",
      "label": "Set the tx_month variable",
      "type": "STRING",
      "description": "Format YYYY-MM",
      "mandatory": true,
      "maxLength": 7
   },
   {
    "name": "limit_rows",
    "label": "Limit the number of rows returned",
    "type": "BOOLEAN",
    "defaultValue": false
   },
   {
     "name": "max_rows",
     "label": "Maximum number of rows",
     "type": "INT",
     "description": "Enter an integer",
     "defaultValue": 100,
     "visibilityCondition": "model.limit_rows == true"
   }
]
The visibilityCondition parameter on the max_rows variable means that this variable will only be visible to users if they check the box to limit the number of rows returned.
See also
For more information on the:
Edit project variables tile, see the Application tiles page in the reference documentation.
visibilityConditionparameter, see the reference documentation on conditional parameters.
Add a tile for running the scenario#
Next, you want the user to be able to run the scenario that rebuilds the Flow.
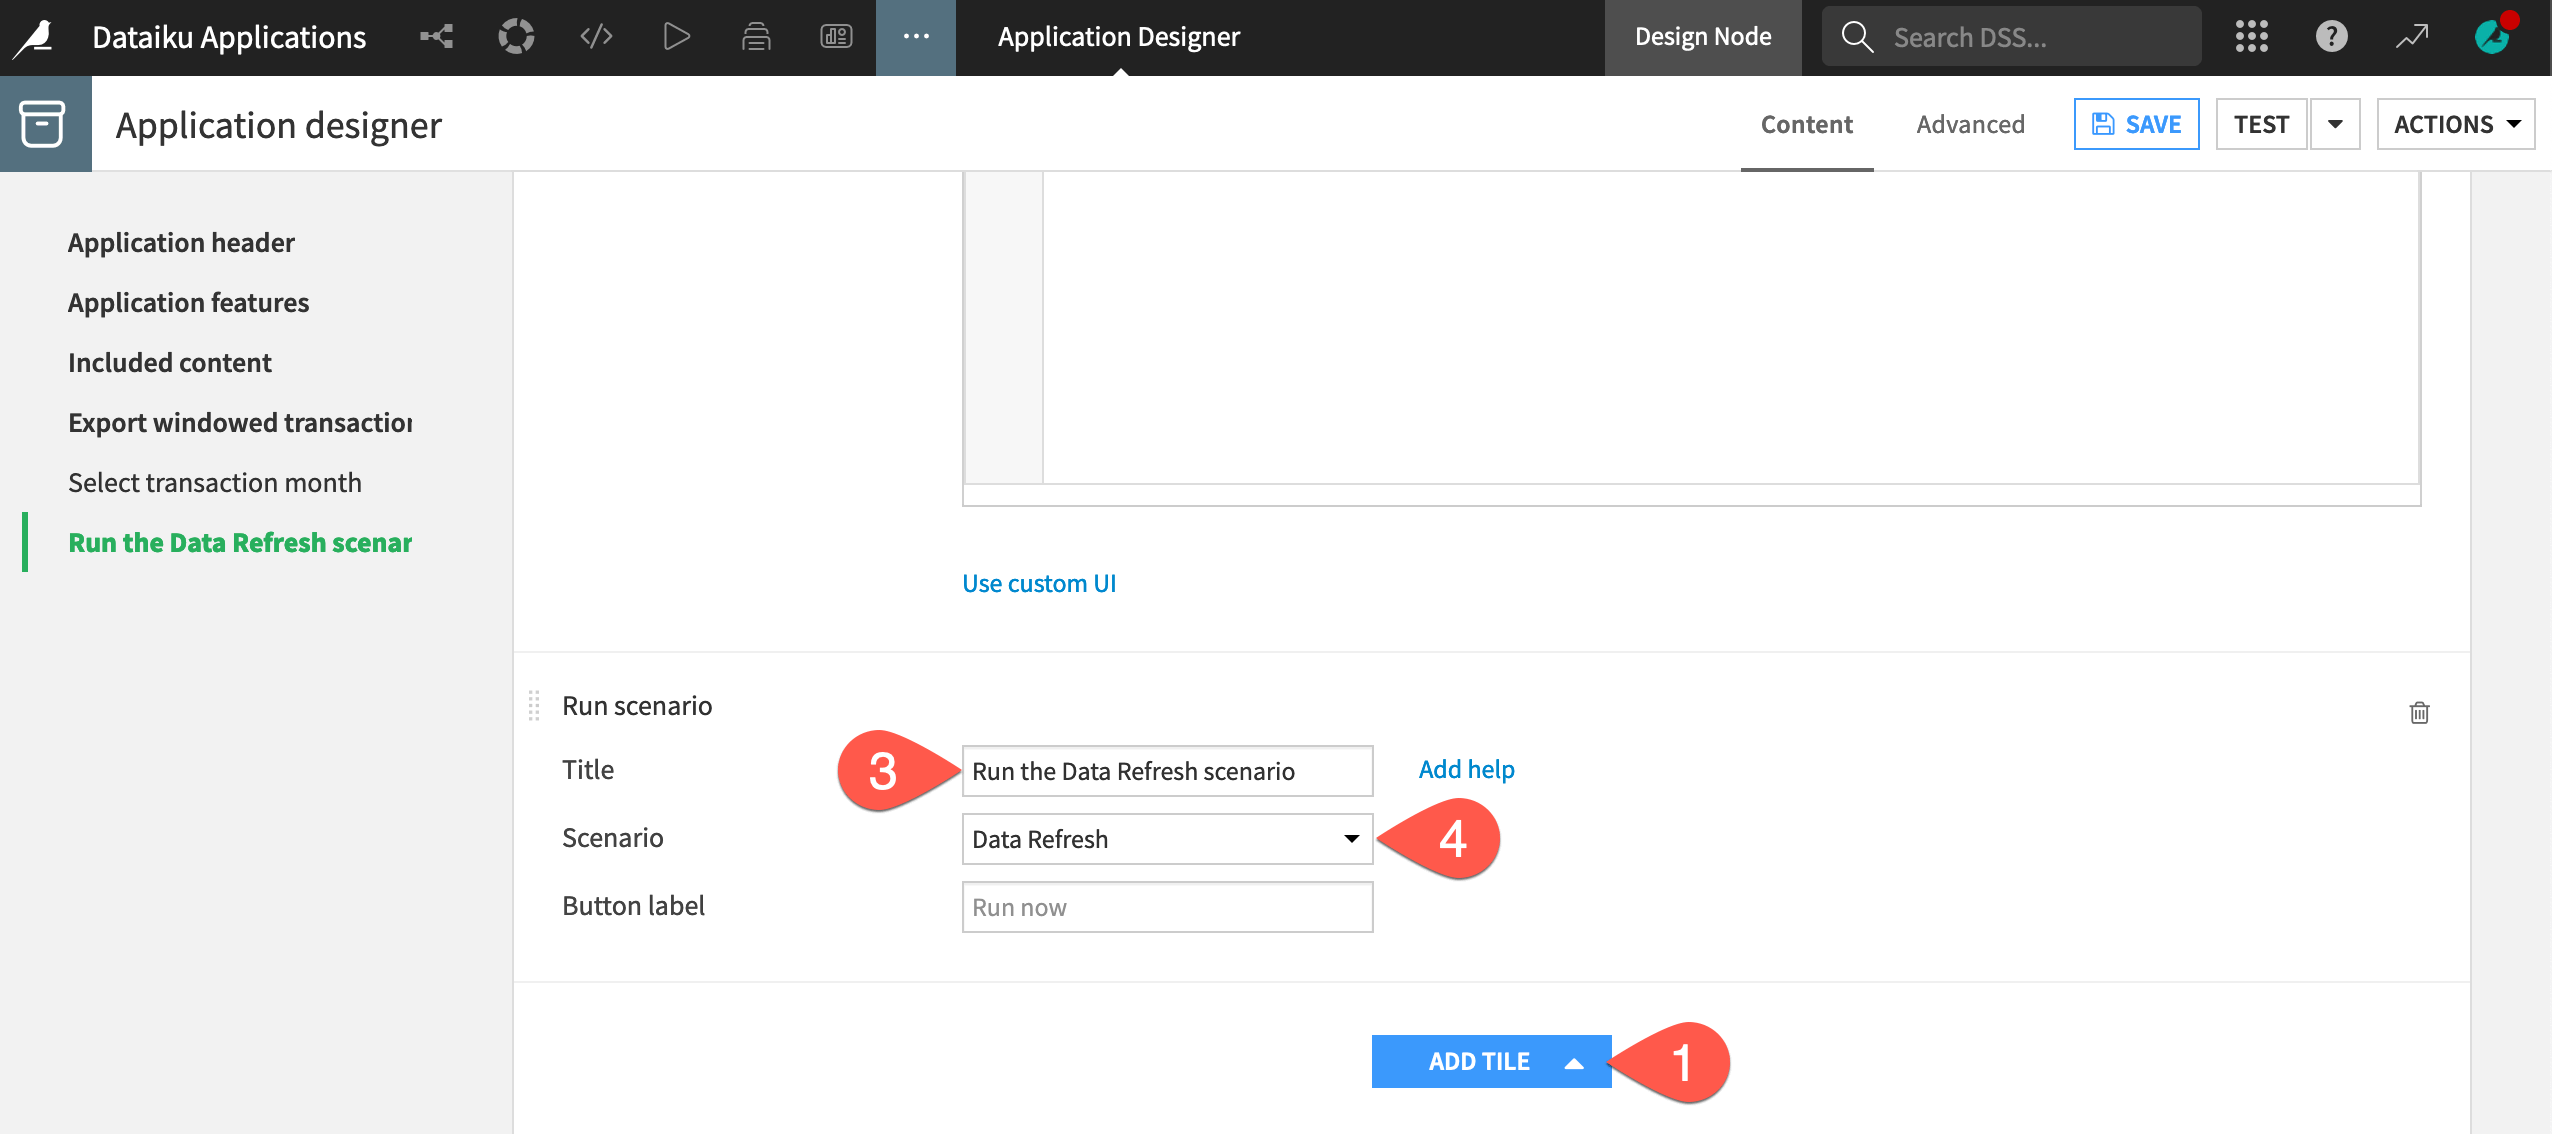
Click Add Tile.
Select Run scenario.
Give the title
Run the Data Refresh scenario.Select Data Refresh as the scenario.
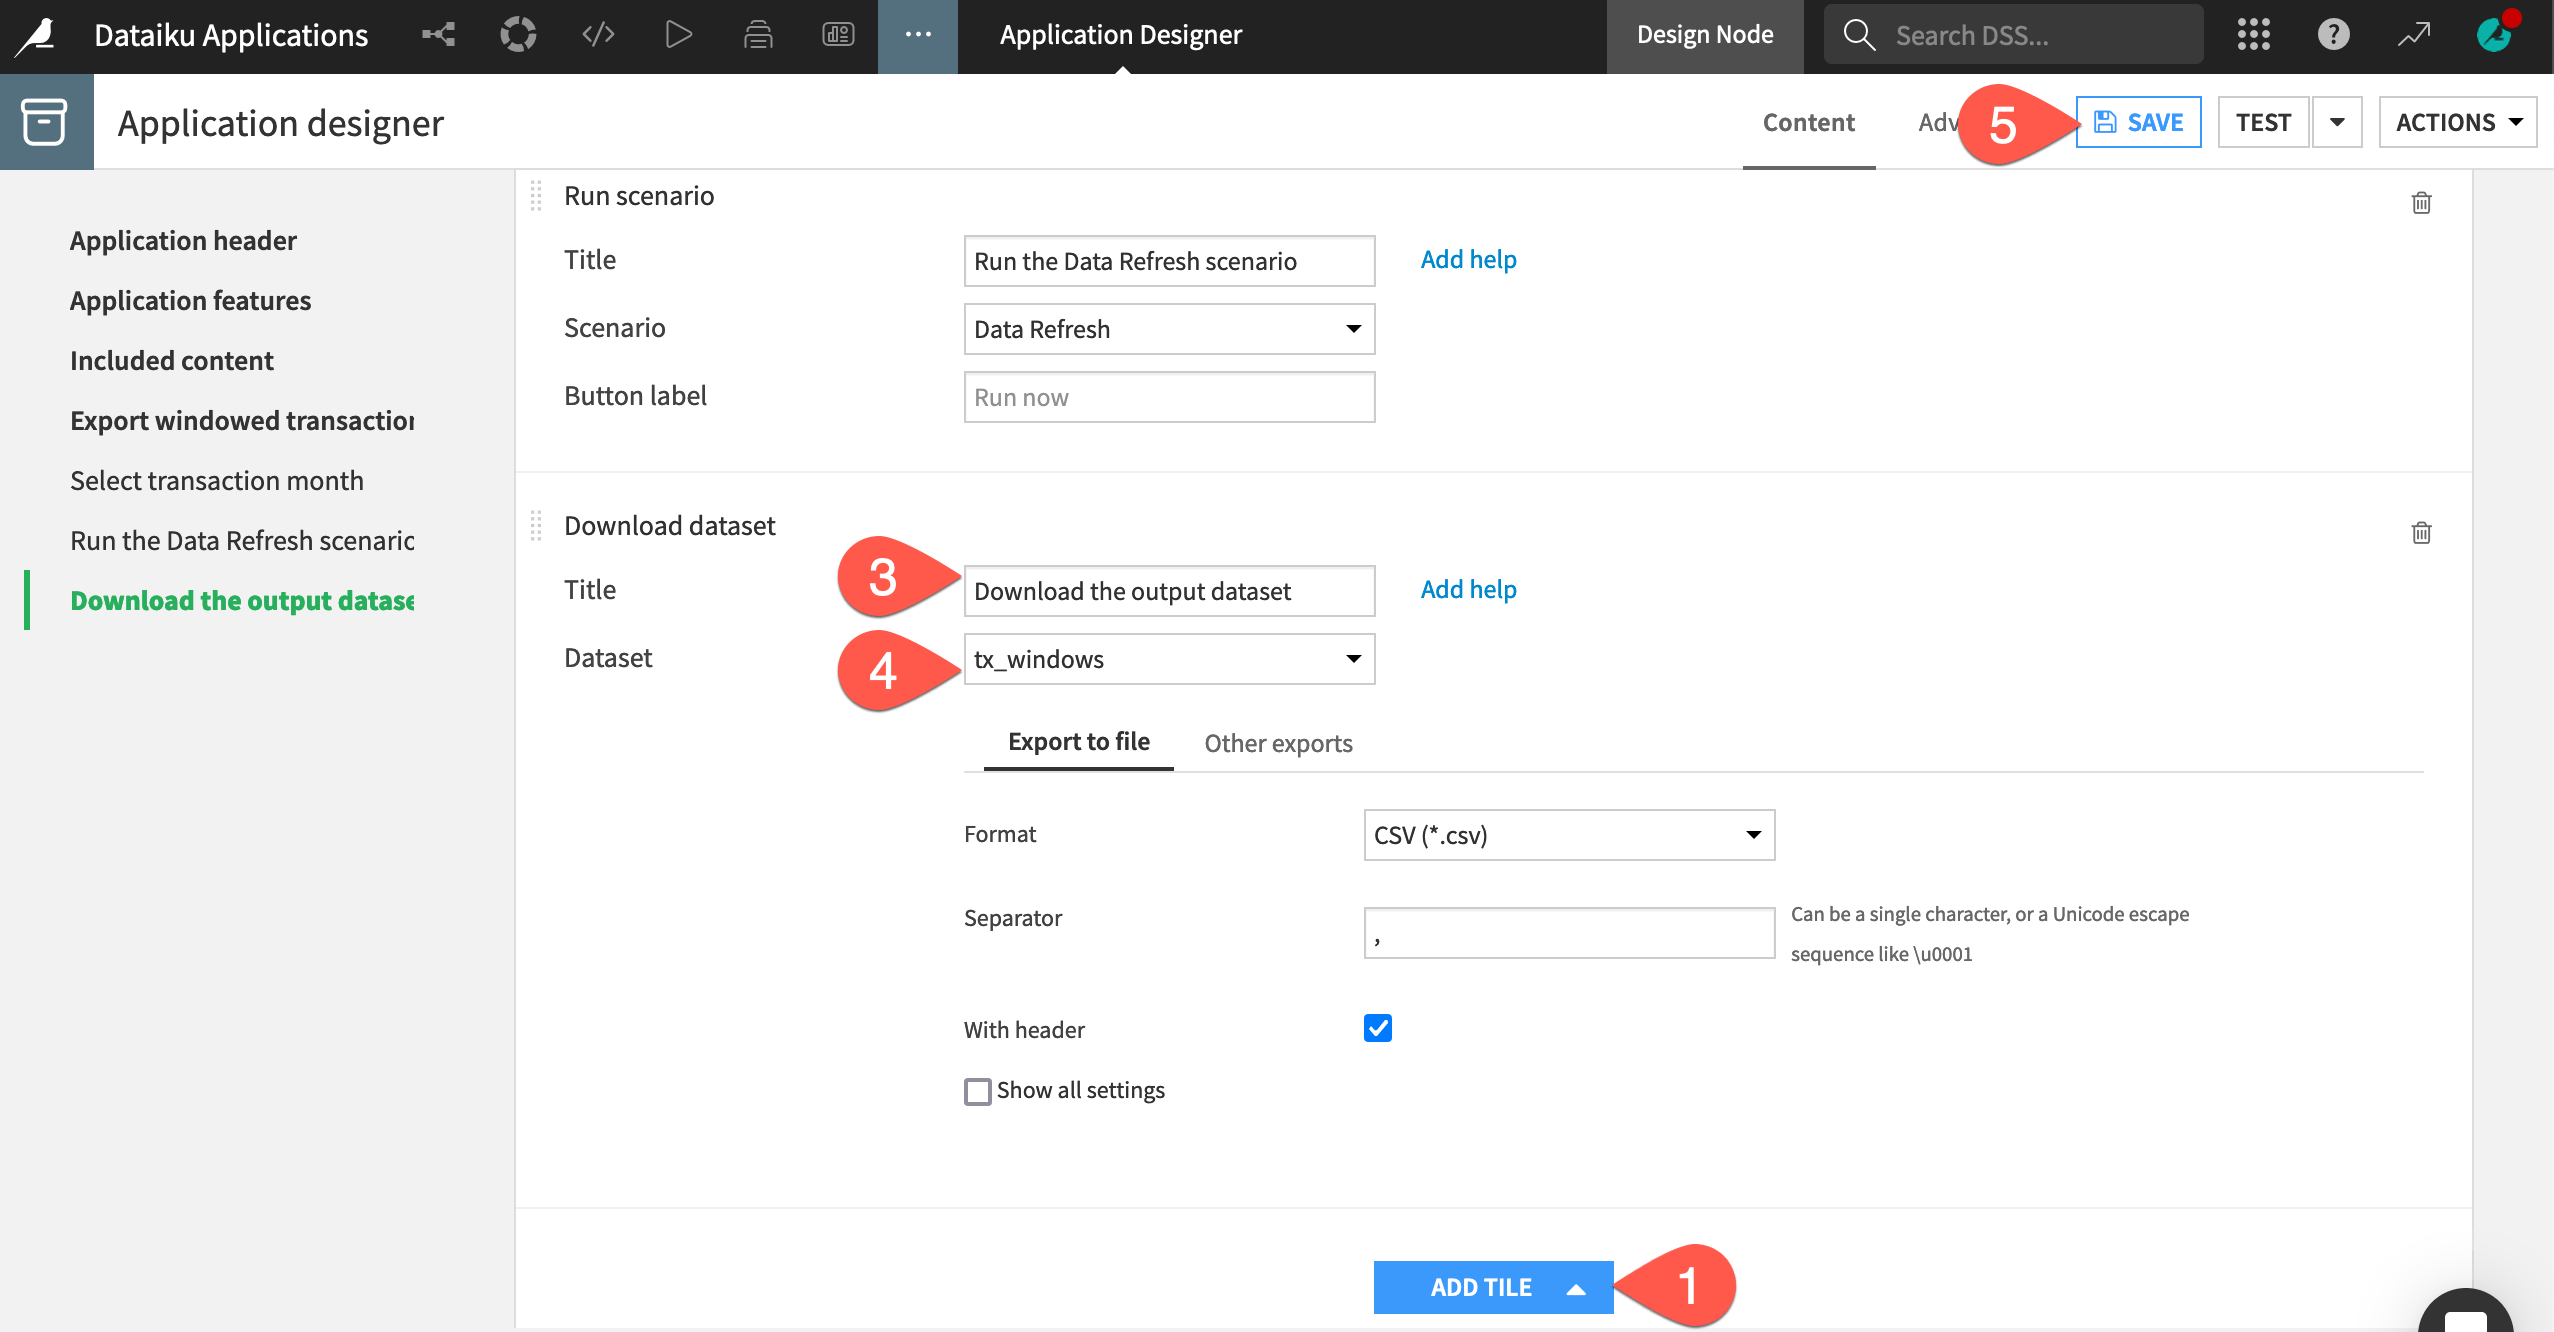
Add a tile for downloading the results#
Lastly, you want the user to be able to export the final output dataset.
Click Add Tile.
Select Download dataset.
Give the title
Download the output dataset.Select tx_windows as the dataset (since this is the dataset that the scenario builds).
Click Save.
Test the app#
With these tiles in place, you’re ready to test the app.
Near the top right of the Application Designer, click Test.
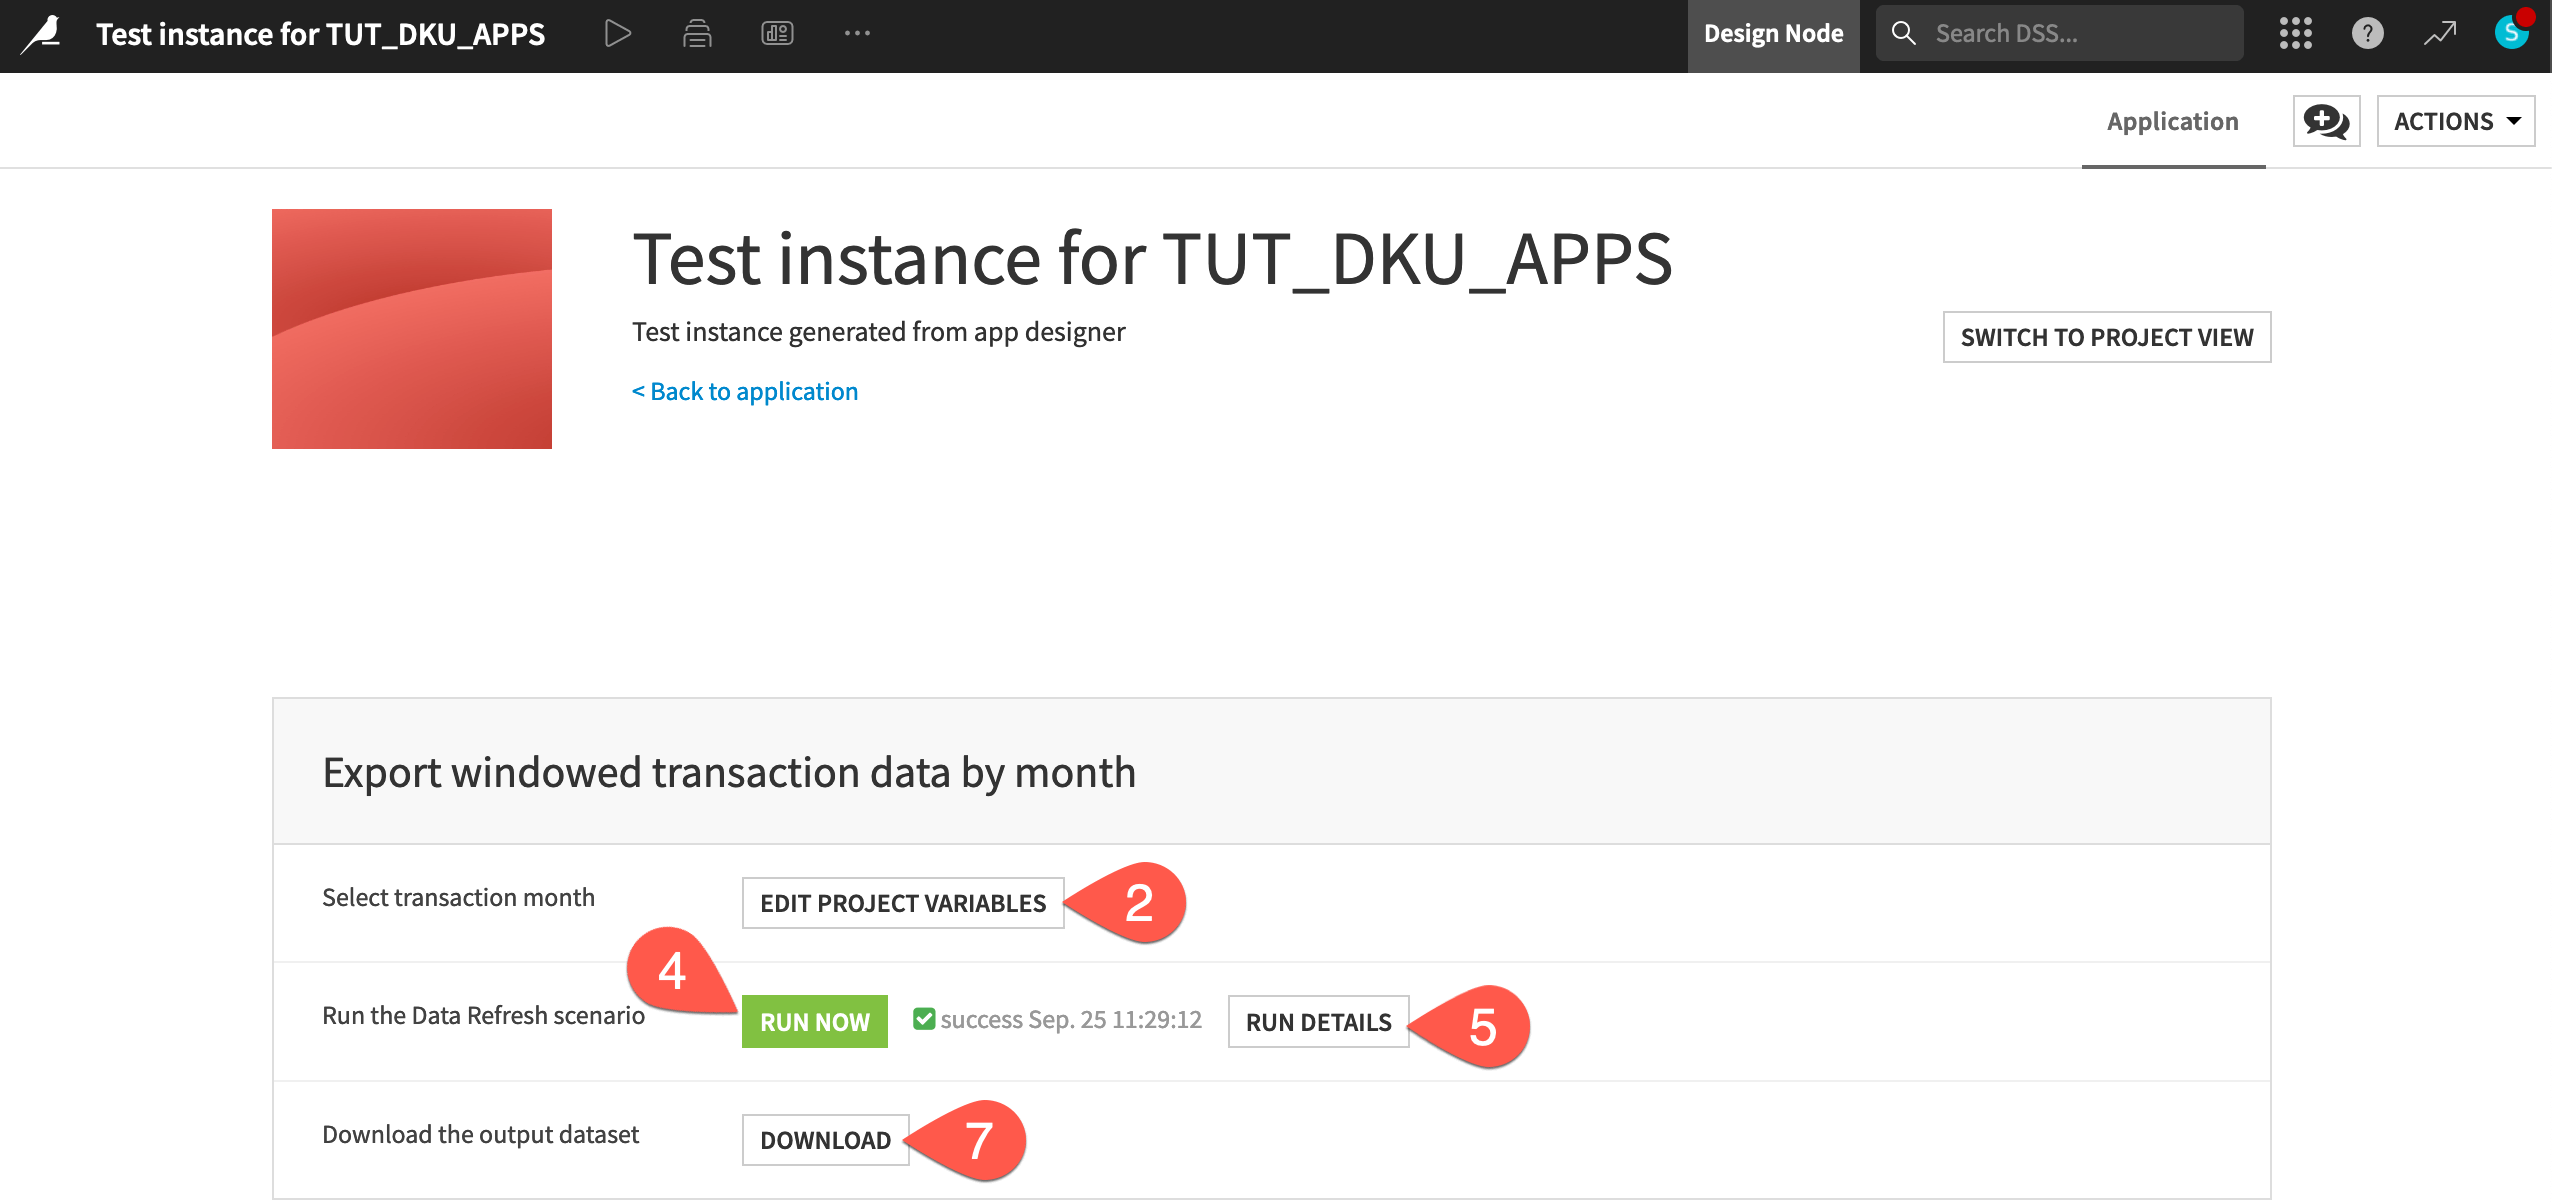
In the test instance of the app, collapse the first section after reading the description.
Click Edit Project Variables.
Enter a new month
2017-02, and click Commit.Note
Feel free to enable the Limit the number of rows returned option to see how the conditional variable appears in the application.
Click Run Now to trigger the scenario.
When the scenario finishes, click Run details to view the results.
Use the back arrow of the browser to return to the app test instance.
Click Download to export a copy of the tx_windows dataset rebuilt by the latest scenario run.
Tip
Import the CSV file you just downloaded into a Dataiku project to verify that it includes only records from the chosen month, 2017-02!
Create a new app instance#
It’s important to recognize the difference between the parent Dataiku project and the child instance of the Dataiku app that you just created. In this section, you’ll browse available Dataiku apps, and then create a new app instance to make sure this is clear.
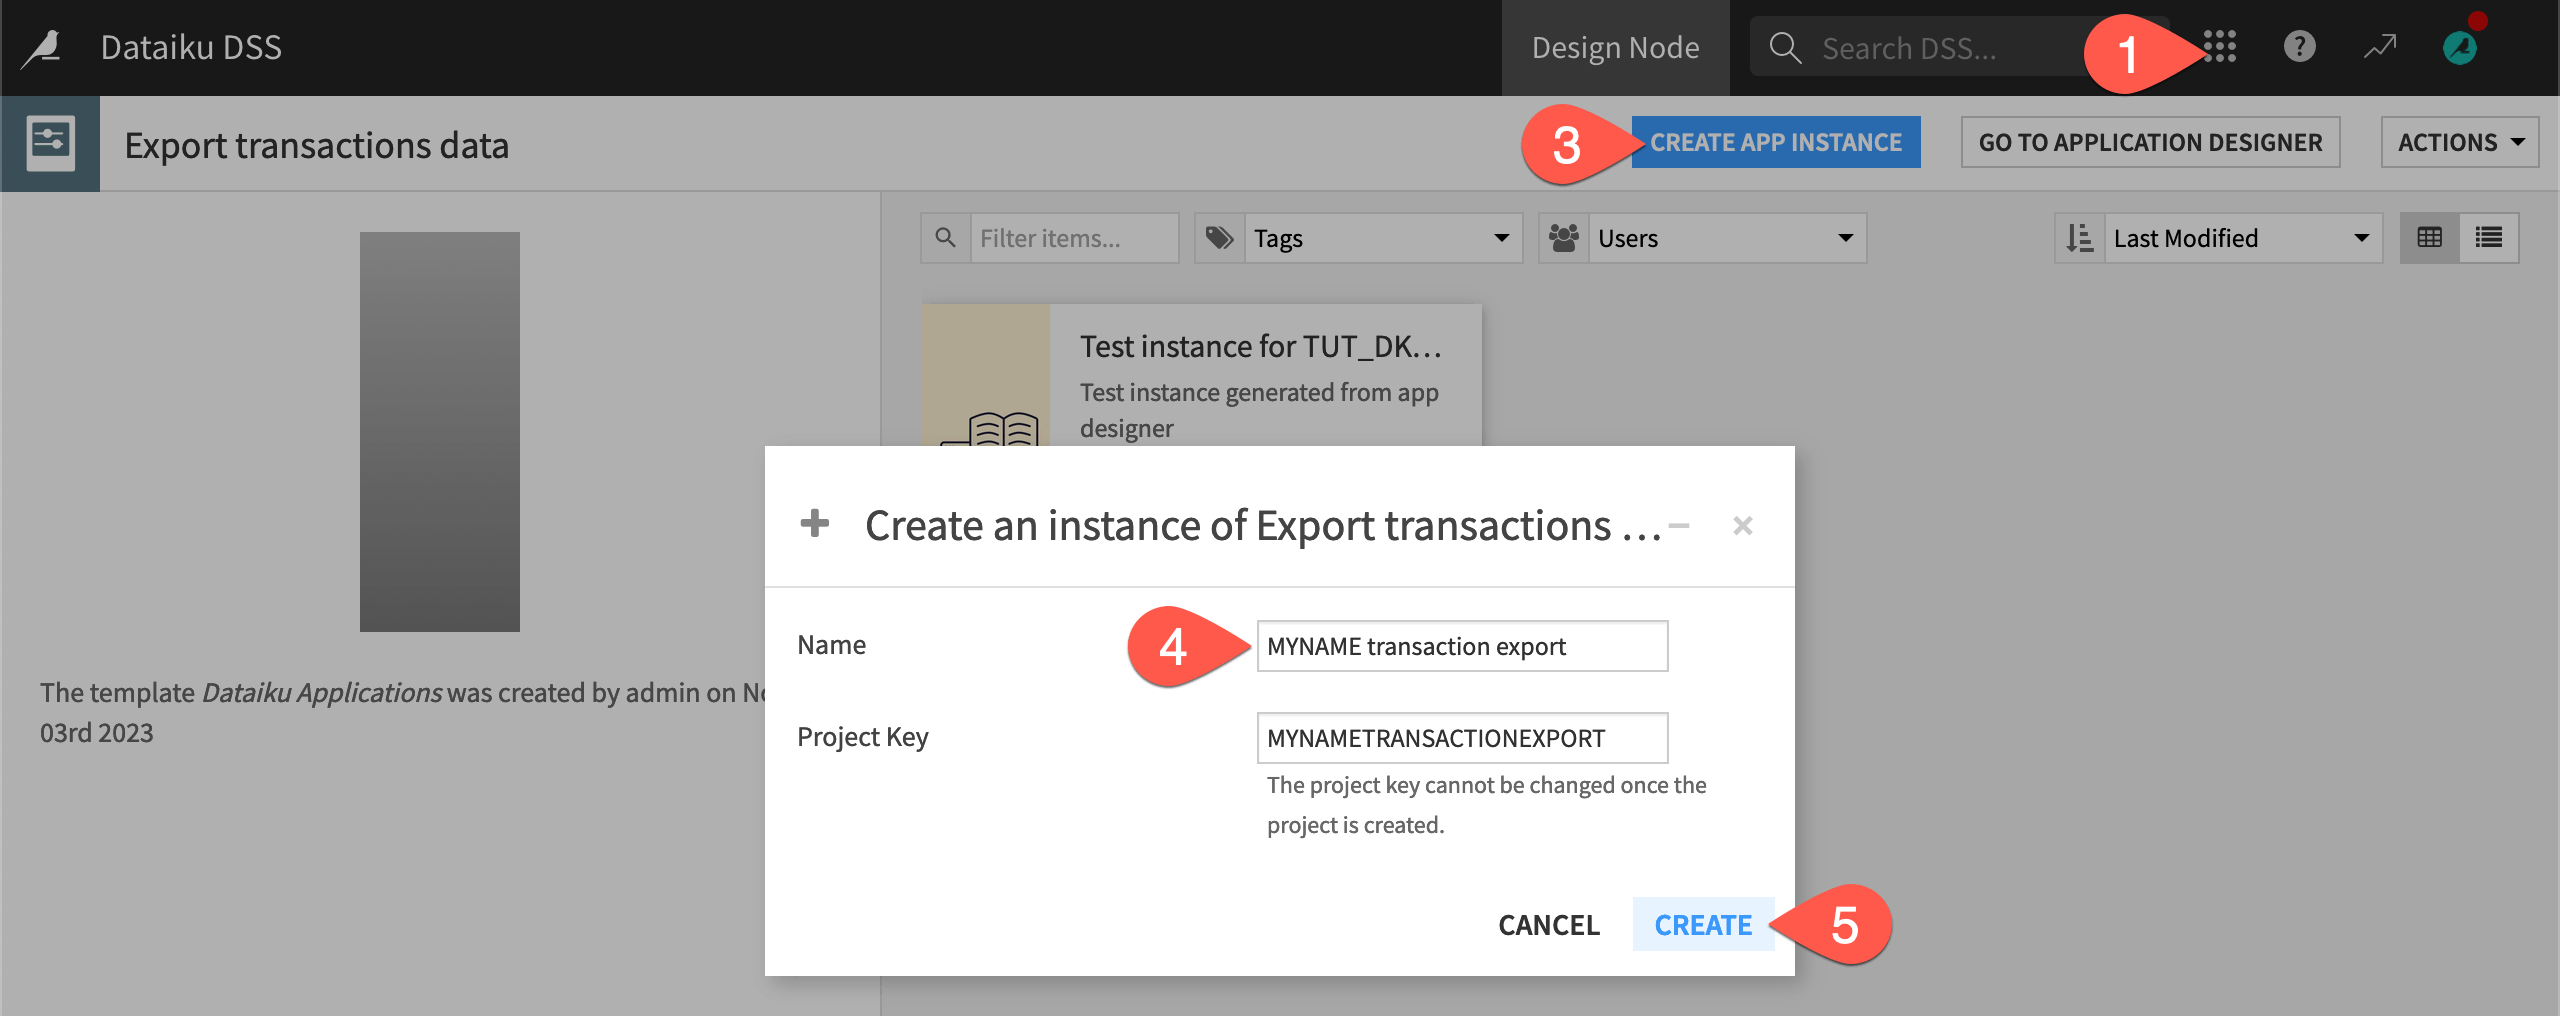
From the top navigation bar, open the waffle (
 ) menu, and select Dataiku Apps to browse Dataiku apps available on your instance.
Select Export transactions data to navigate to the app’s home.
Click Create App Instance.
Give it a unique name like
{YOURNAME} transaction export.Click Create.
Important
Just like Dataiku projects, instances of Dataiku apps have their own project keys that must be unique to the instance. In either case, you can’t change the key.
Once you have another copy of the app, test it out once more. Change the variable to a new month (like
2017-03), run the scenario, and export the results.
Version a Dataiku app#
As the app’s creator iterates on their project, they’ll find a need for version management. Introduce an arbitrary change to the app to simulate this situation.
From the application instance, click Edit Application to return to the original Dataiku project. If not changed, the project key begins with
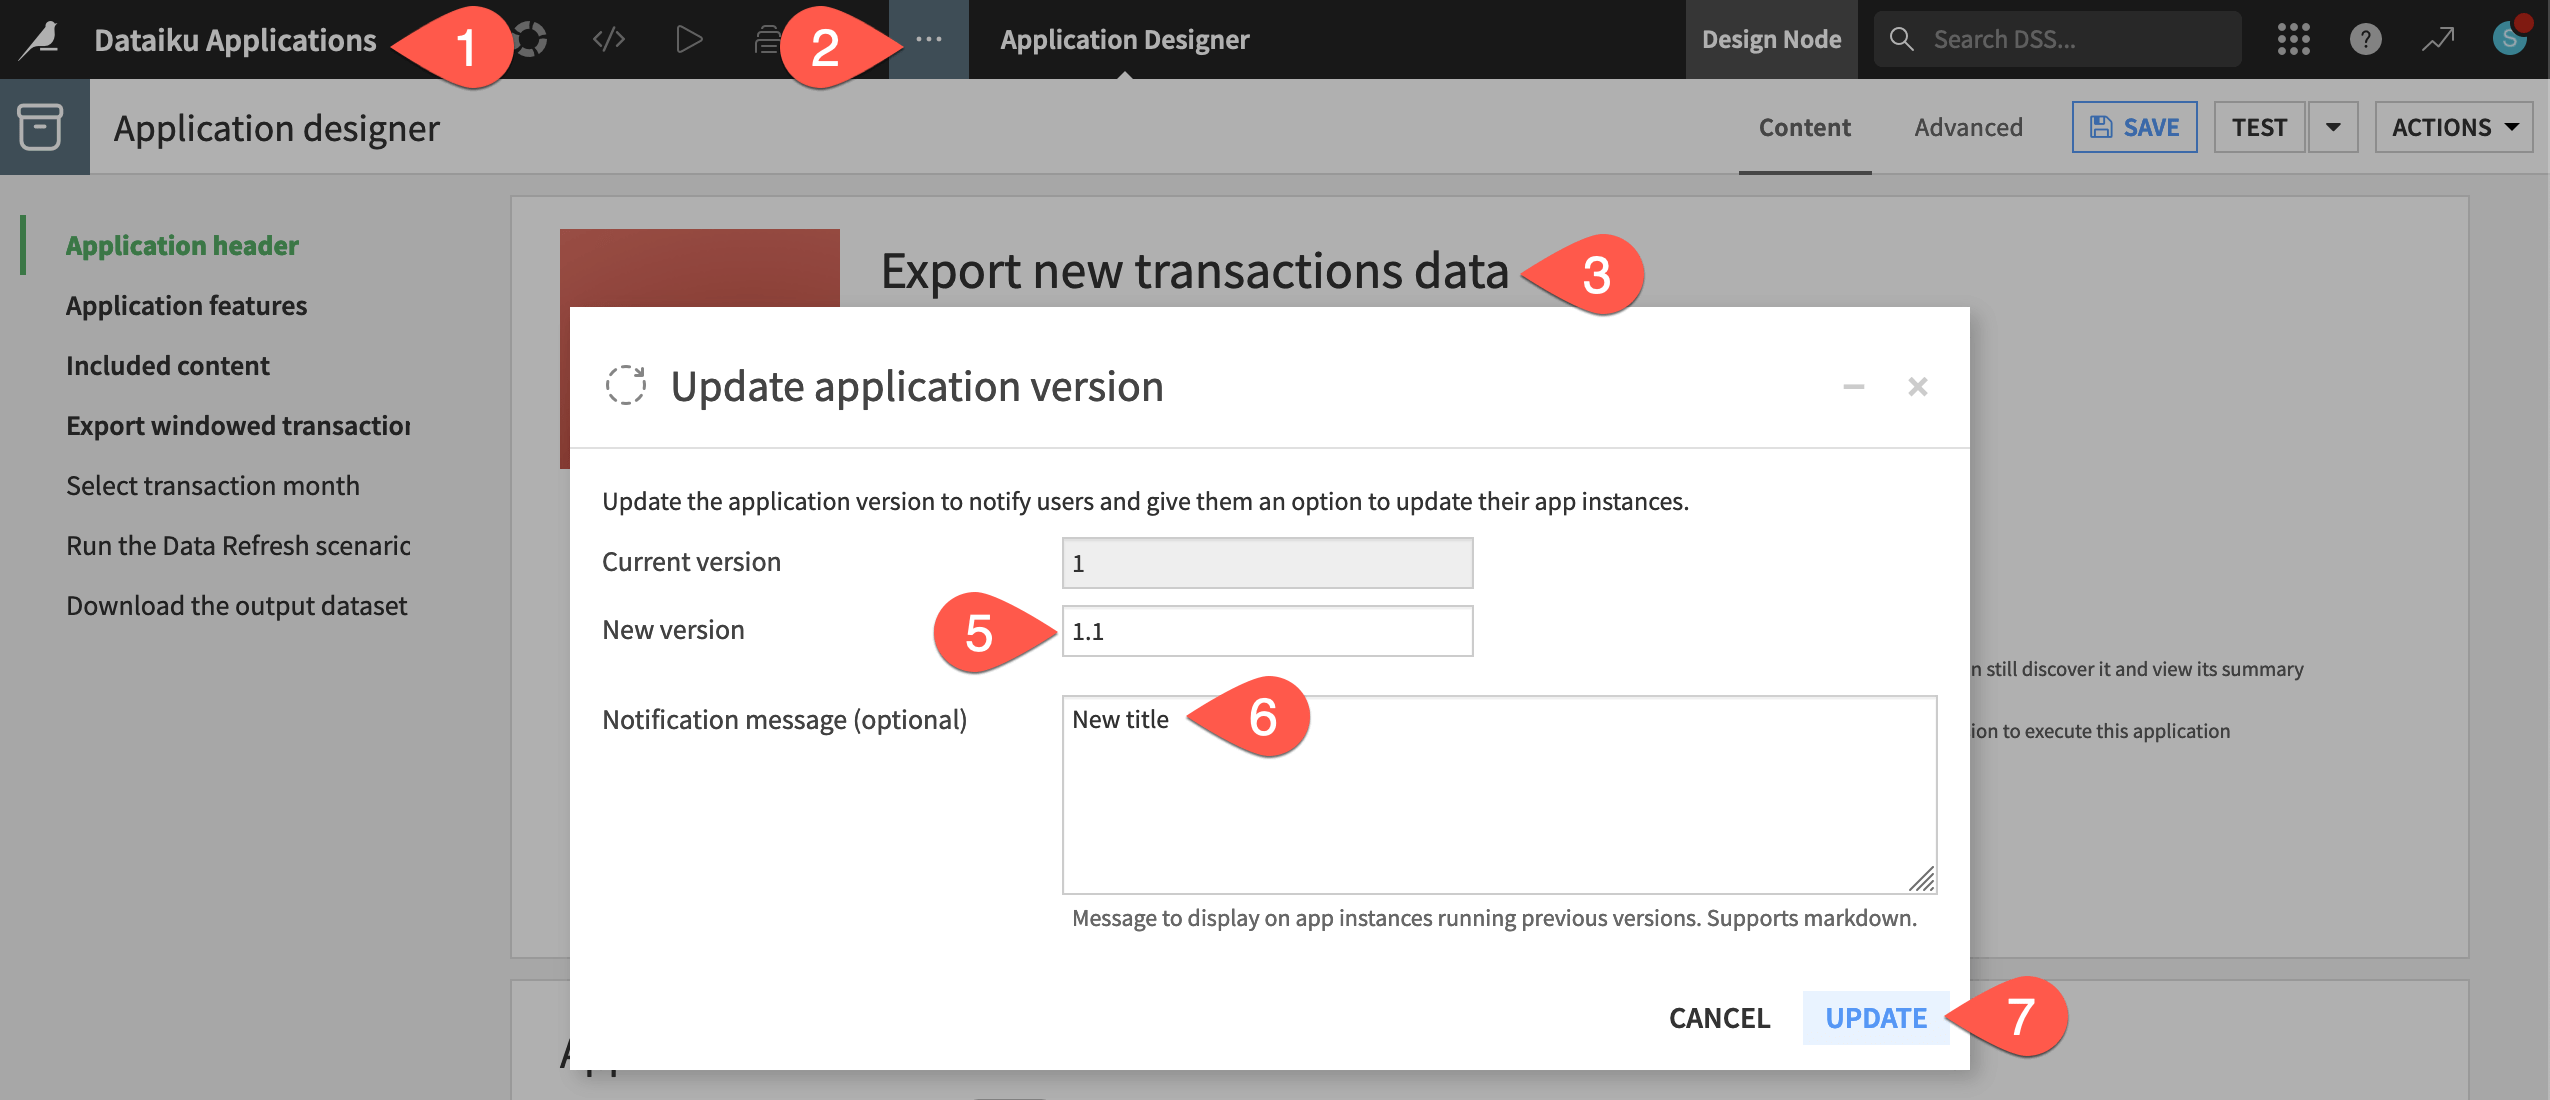
TUT_DKU_APPS.Make an arbitrary change to the app, such as renaming the title
Export new transactions data.Click Update Version.
You can use any convention for naming versions, such as
MAJOR.MINOR.PATCH. This was a minor change so rename the new version as1.1.Give
New titleas the notification message.Click Update.
Click Save on the Dataiku app.
Once the app’s creator has issued a new version, downstream app users have the ability to update their own instances of the app.
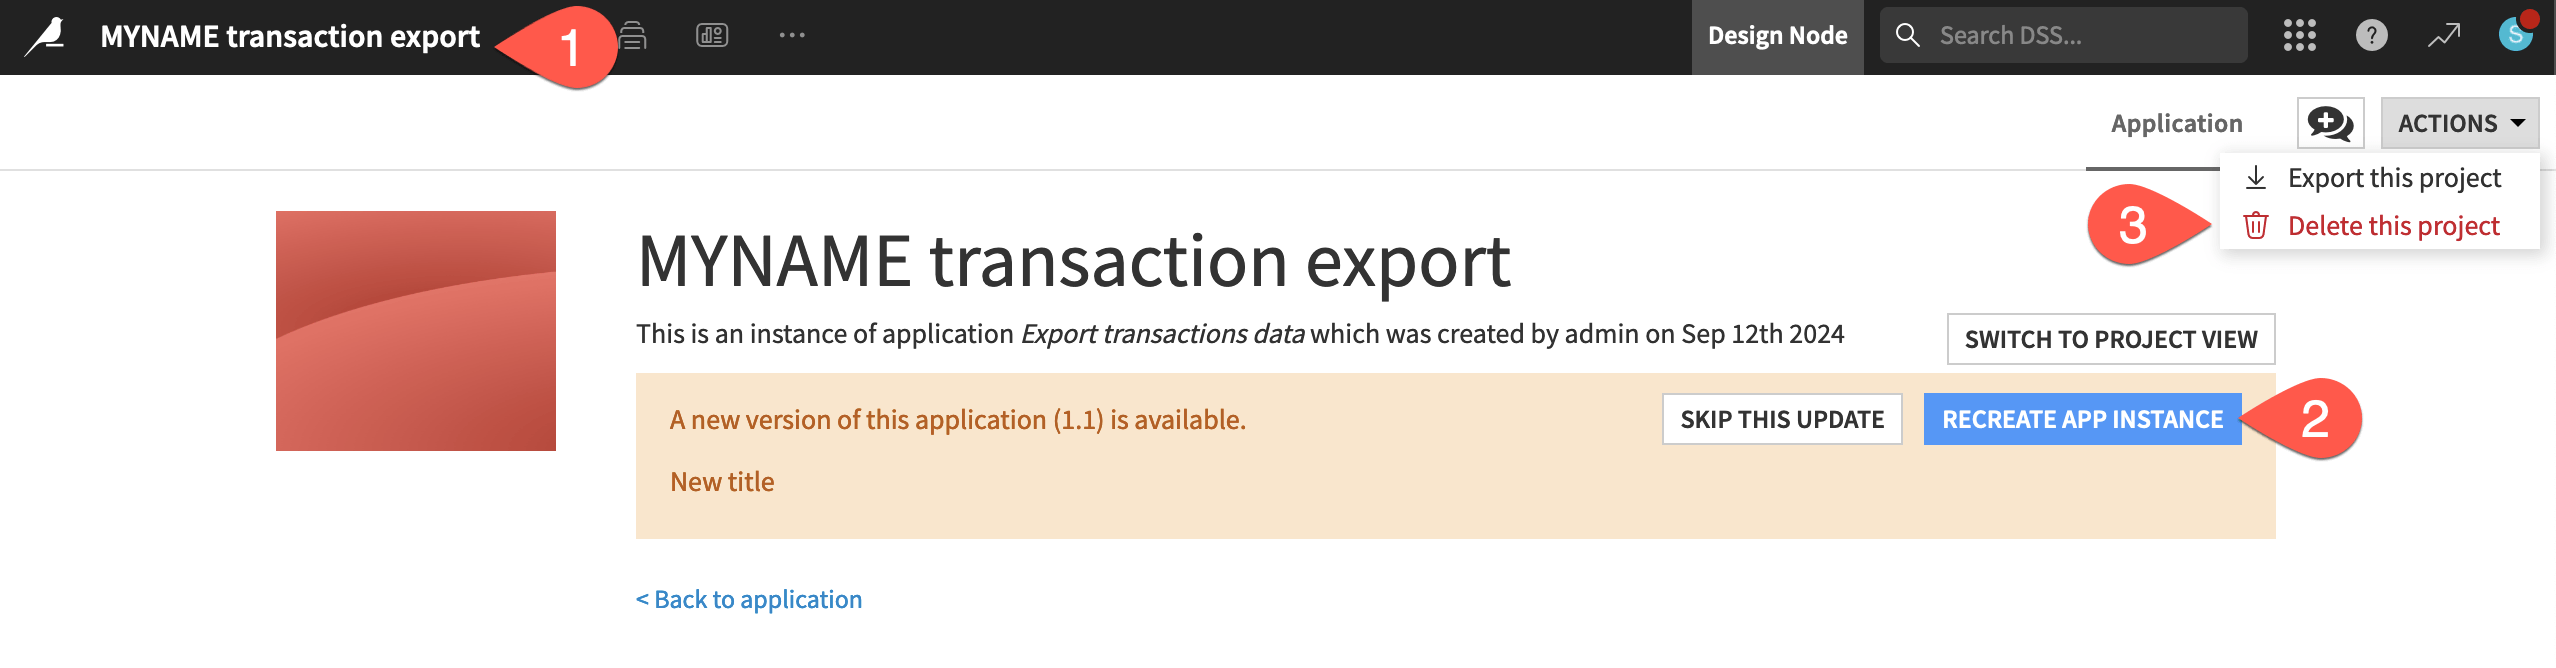
Click Actions > Go to application page to return to your child app instance, the one named
{YOURNAME} transaction export.Seeing the alert about the new version, click Recreate App Instance to upgrade the app instance, and Recreate again to confirm.
When finished with this section of the tutorial, click the Actions tab at the top right of the instance, and then Delete the project to clean up unneeded instances of the app.
Tip
In the Actions menu at the top right of the app home (not the individual app instance), you’ll also find the option to publish the app to a workspace, which can be a helpful collaboration space.
Recap of a visual Dataiku app#
Rather than focus on the functionality of this specific app, try to recognize the value that this work pattern brings:
One user can design a highly complex project that may prepare data, build models, or create dashboards for example.
The app’s creator can then enable many other users to access results or assets from that project in their own way—without interfering with other users or the original project.
As the app’s creator iterates on their project, app users can update their instances.
Tip
You can find another tutorial including a visual Dataiku app in the AI Collaboration Quick Start.
Next steps#
Now that you’ve seen how to create a visual Dataiku app, you may recall seeing a second option when converting the project: a Dataiku app-as-recipe.
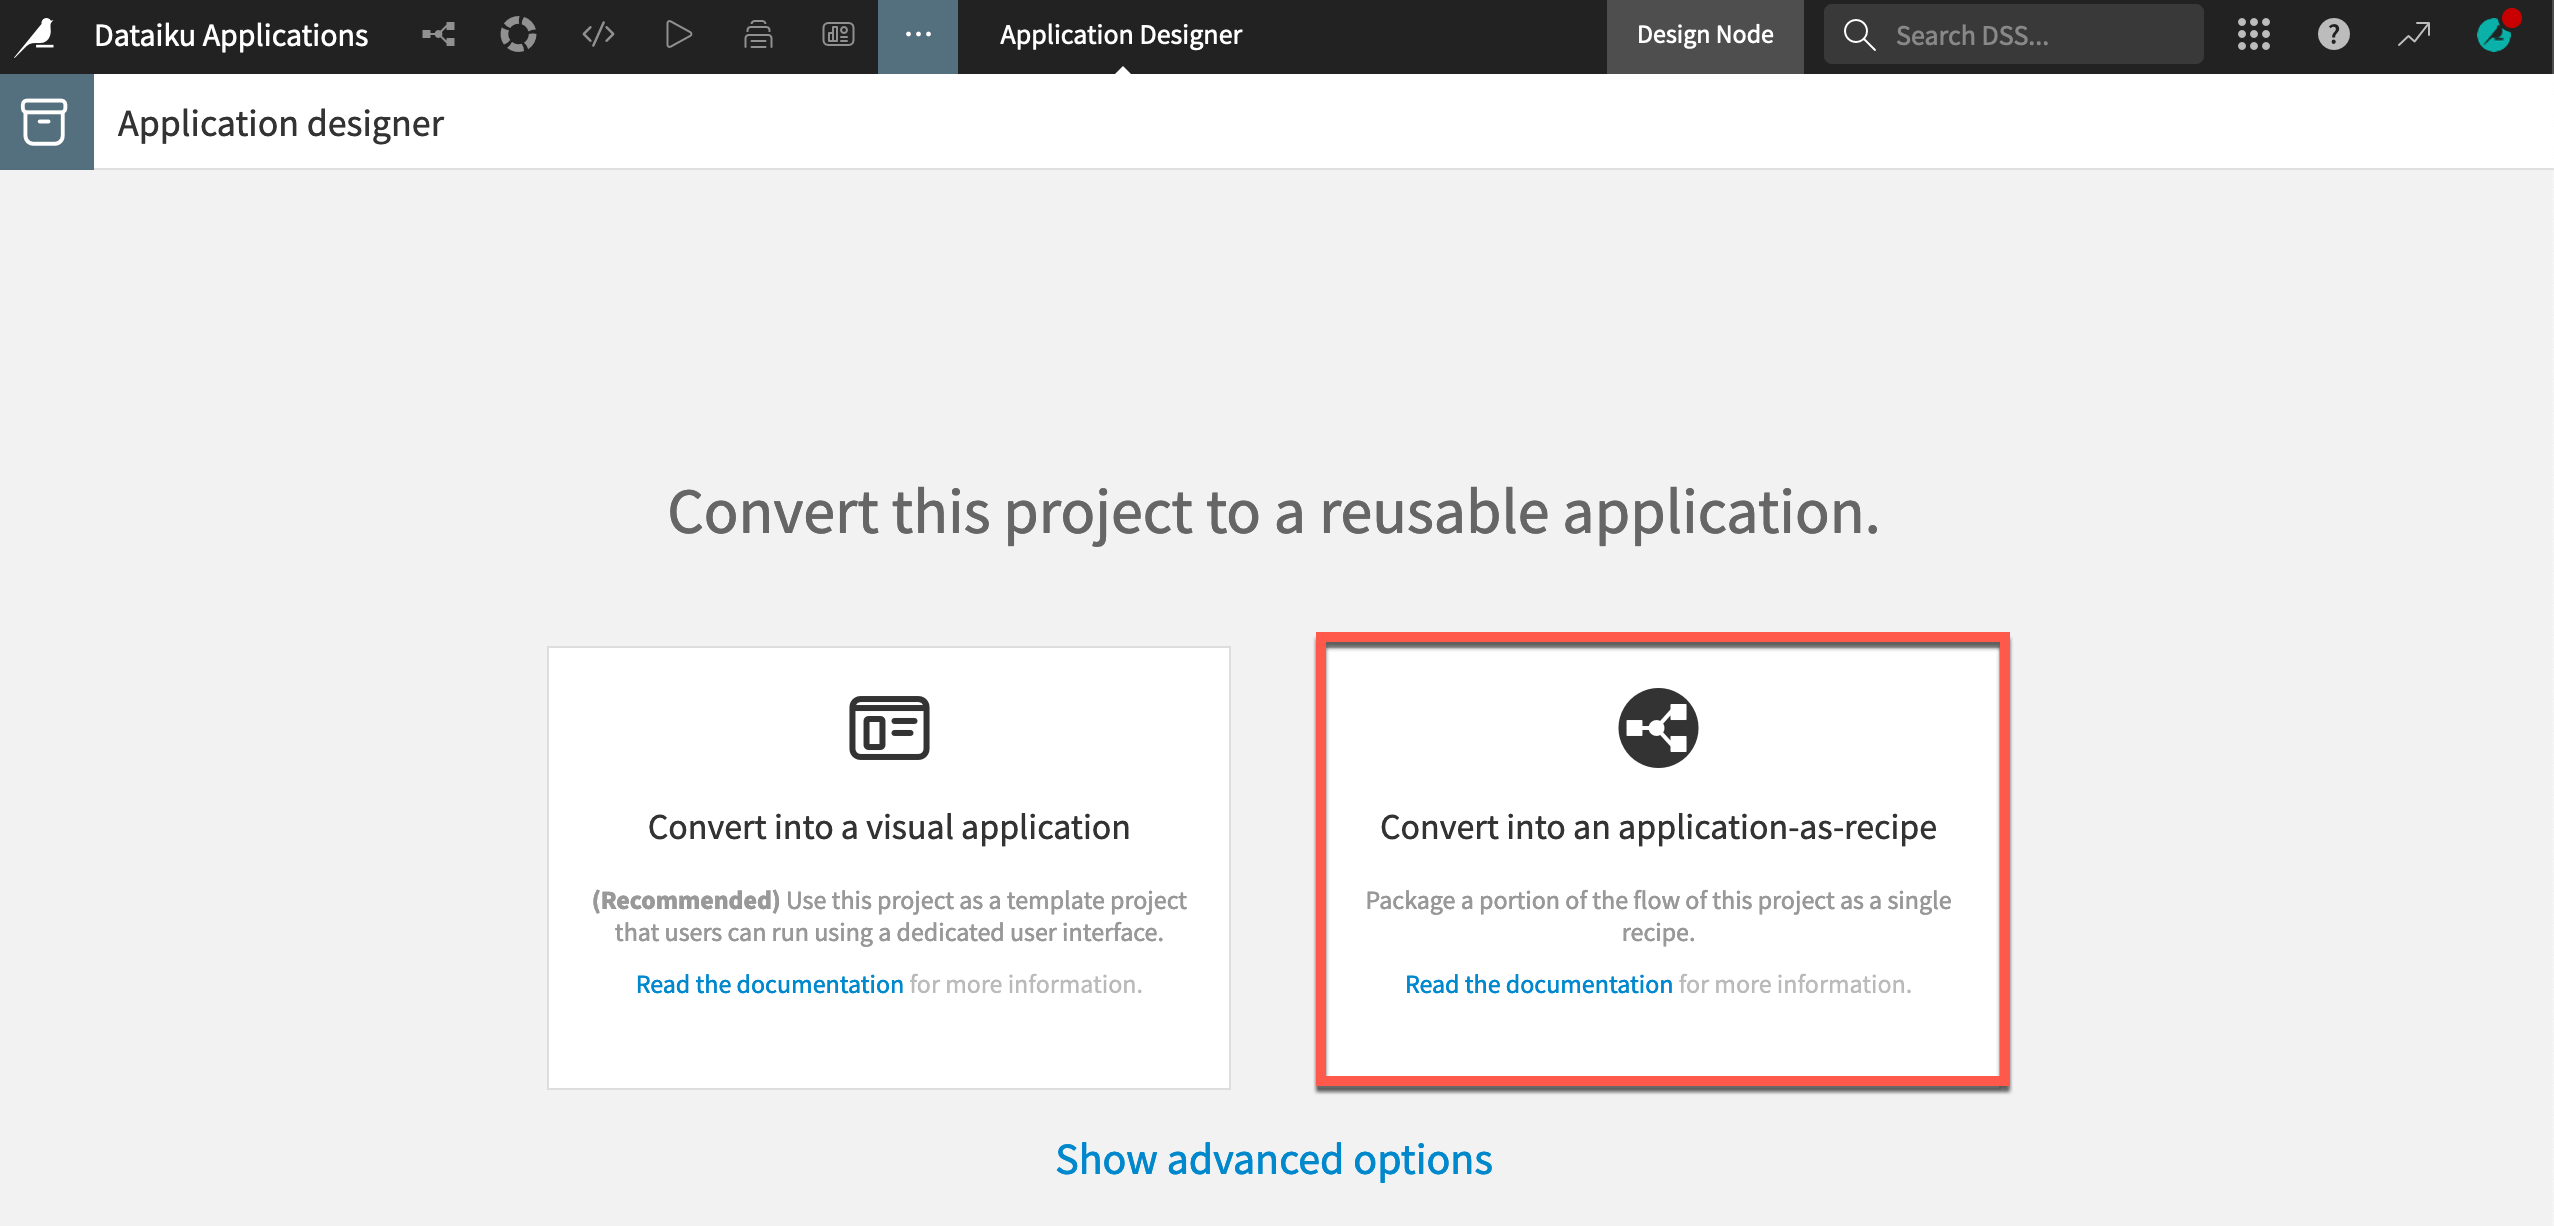
Rather than creating a separate instance with its own user interface, an app-as-recipe packages your project as a visual recipe reusable directly in the Flow of any other project on the same instance. This is especially useful when your project includes data transformations that you’d like to make reusable.
To see this in action, go to the Tutorial | Build a Dataiku app-as-recipe tutorial to see how to create an app-as-recipe and use it in a different project on the same instance.