
Solution | Marketing Mix Modeling#
Overview#
Business case#
Marketing Mix Modeling (MMM) is a powerful analytical technique that evaluates how different marketing strategies impact sales. By analyzing historical data, MMM helps you understand each marketing channel’s contribution to revenue, enabling more informed decisions about budget allocation.
This Dataiku Solution uses Meridian, an open-source Python package developed by Google. This tool leverages Bayesian statistics to create robust marketing mix models that are easy to train and interpret. Its user-friendly design makes it accessible to marketing teams without deep technical expertise.
Installation#
From the Design homepage of a Dataiku instance connected to the internet, click + Dataiku Solutions.
Search for and select Marketing Mix Modeling.
If needed, change the folder into which the Solution will be installed, and click Install.
Follow the modal to either install the technical prerequisites below or request an admin to do it for you.
Note
Alternatively, download the Solution’s .zip project file, and import it to your Dataiku instance as a new project.
Technical requirements#
To use this Solution, you must meet the following requirements:
Have access to a Dataiku 14.1+* instance.
A Python 3.11 code environment named
solution_marketing-mix-modelingwith the following required packages, and pandas 2.2 (Core packages versions):
dash==2.3.1
dash_bootstrap_components==1.0
google-meridian==1.0.6
plotly==5.23.0
Data requirements#
The Dataiku Flow was initially built using data from the Meridian Library. However, we intend for you to use this project with your own data. To do so, you can follow these specifications.
Workflow overview#
You can follow along with the Solution in the Dataiku gallery.
The project includes these high-level steps:
Load and preprocess marketing spend data.
Build a MMM model using Meridian.
Explore different scenarios using the webapp.
Validate the results using the dashboards.
Walkthrough#
Note
In addition to reading this document, it’s recommended to read the wiki of the project before beginning to get a deeper technical understanding of how this Solution was created and more detailed explanations of Solution-specific vocabulary.
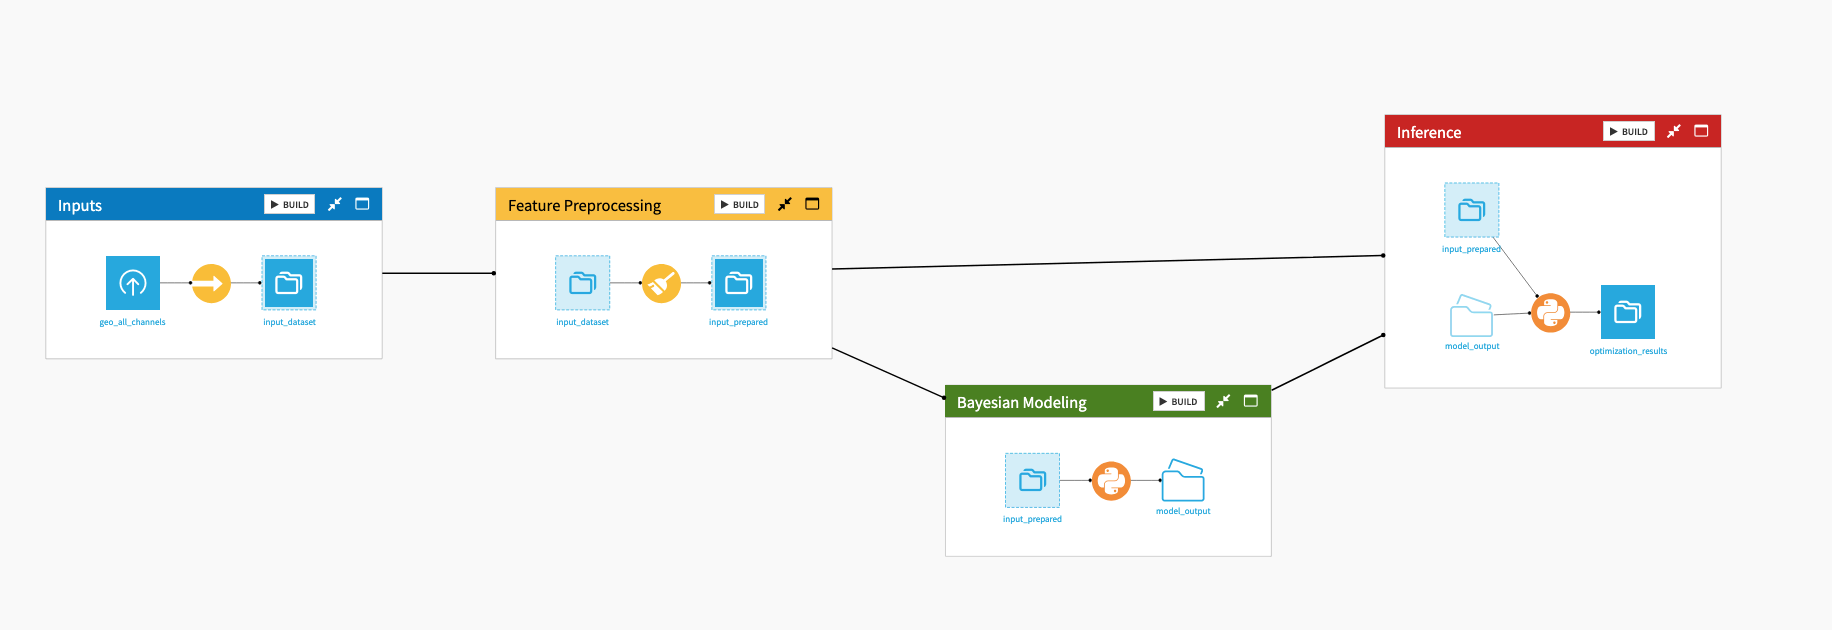
Project Flow#
Data input and preprocessing
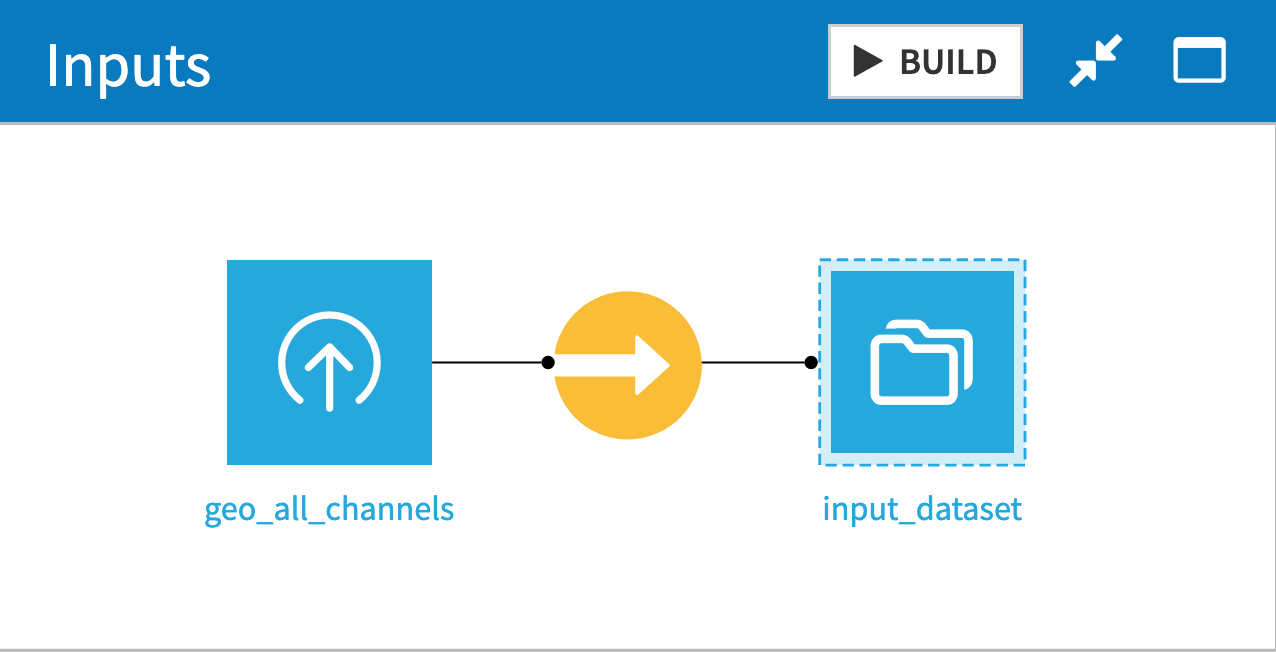
In this Flow zone, we load the input dataset and sync it into the project connection.
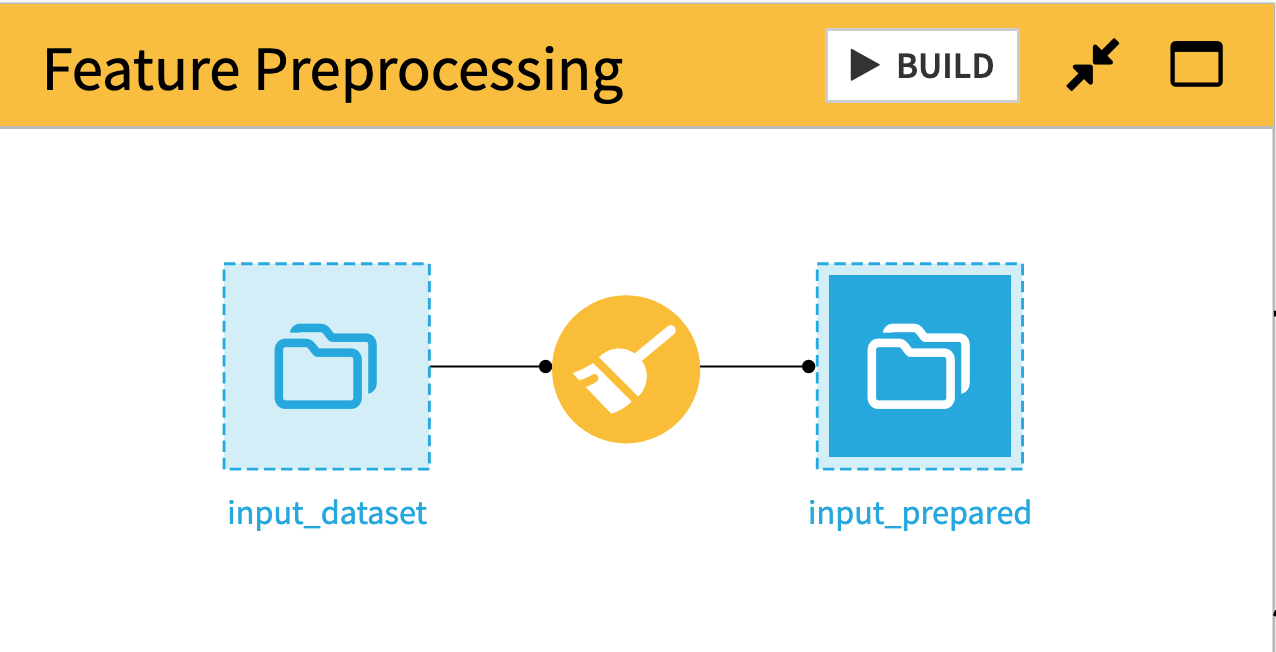
We preprocess the input data to match our use case. For example, we filter by geography, but you can also rename columns, filter on dates, or change the time granularity with an aggregation step.
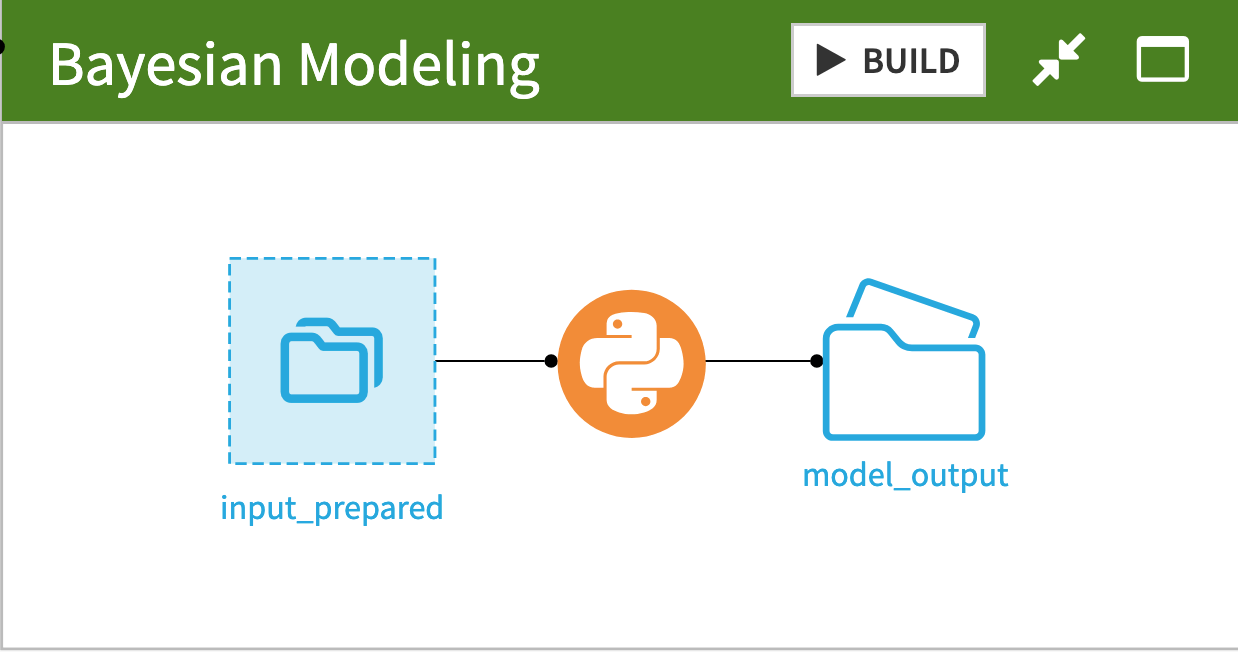
Here, we create and train the Meridian model based on our data. Model configuration, including column selection and training parameters, is handled directly in the code.
Exploring Marketing Mix scenarios#
Once the model is trained, you can use the webapp to explore different cases for your marketing strategy.
Webapp
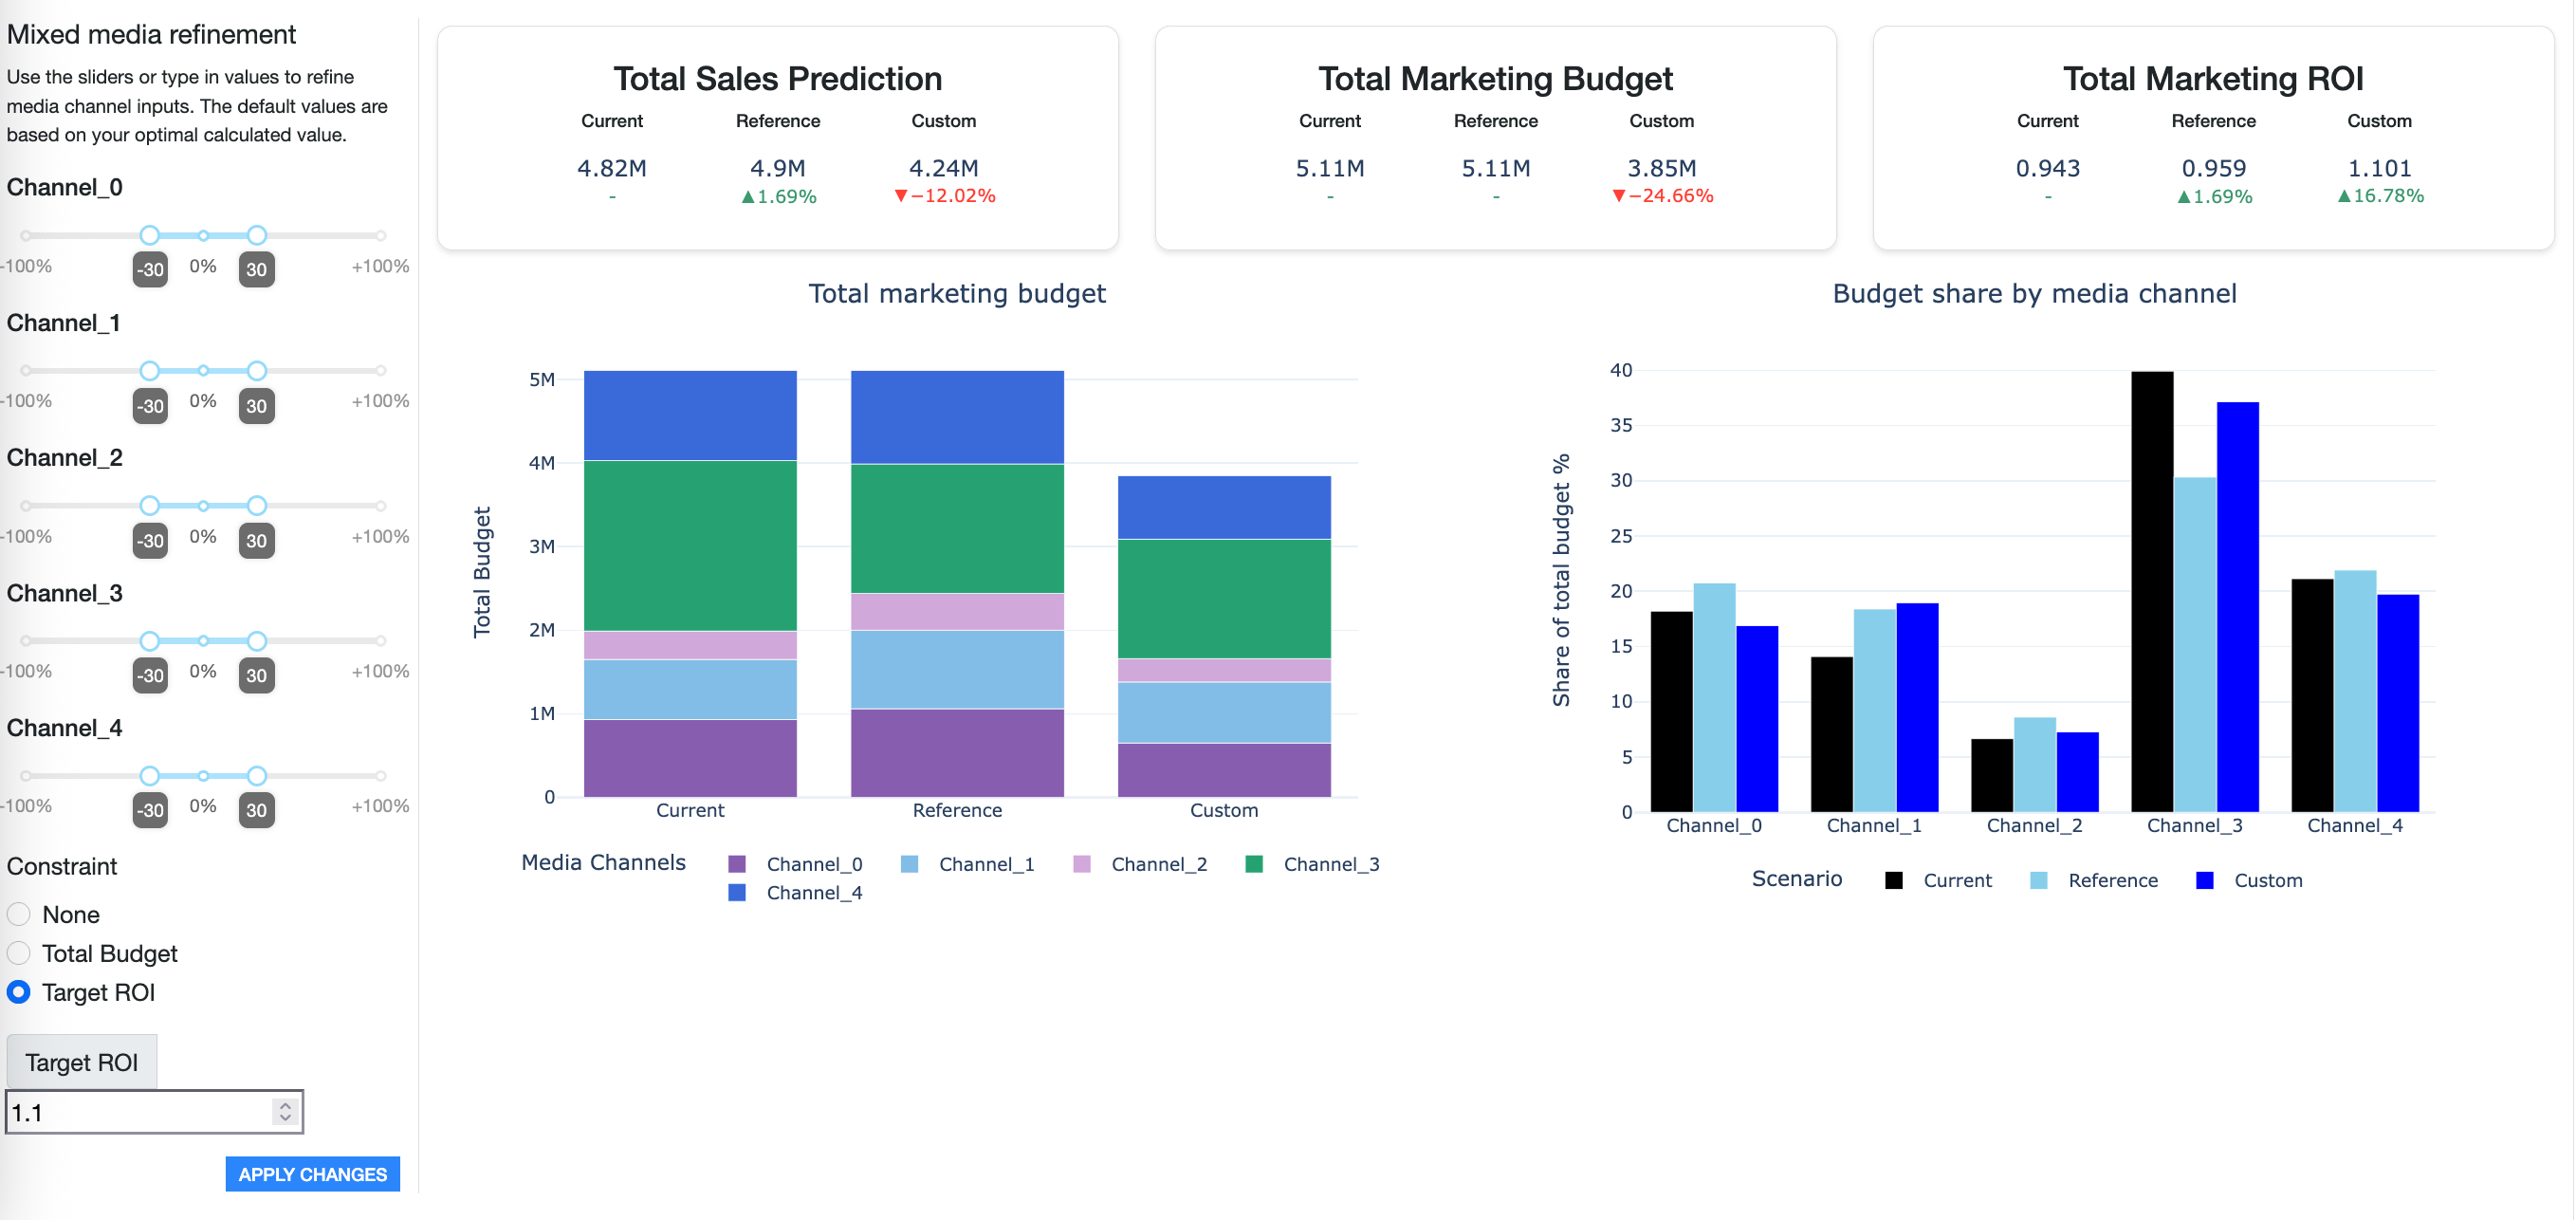
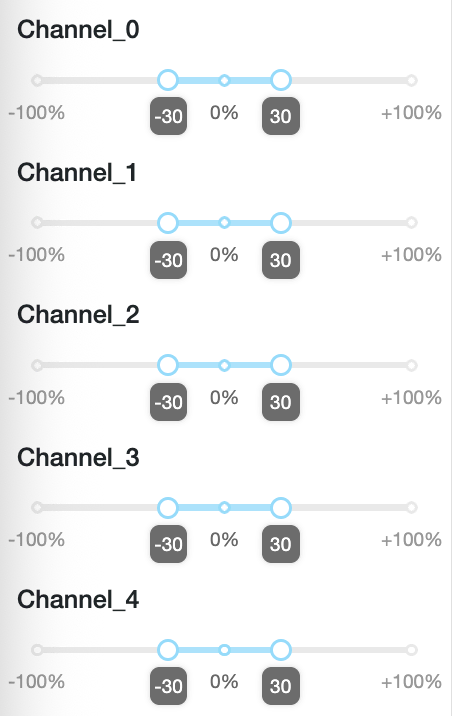
On the left side, you can configure the range of variation that you allow on each marketing channel (a range of 0 would keep the channel share at its historical value). When a new budget optimization is launched, the model will consider those limitations when exploring the possible spend for each channel.
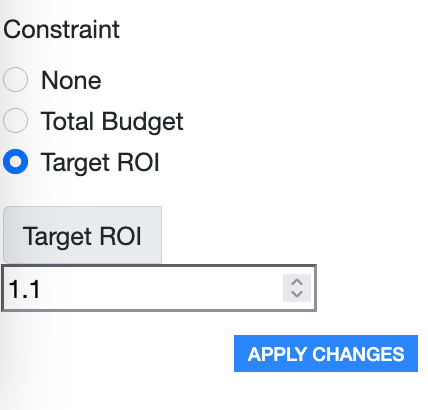
On the bottom left, you can specify an optimization constraint. You can target a specific budget or a marketing ROI (without budget constraint). If “None” is selected, the optimization will try to keep the historical budget.
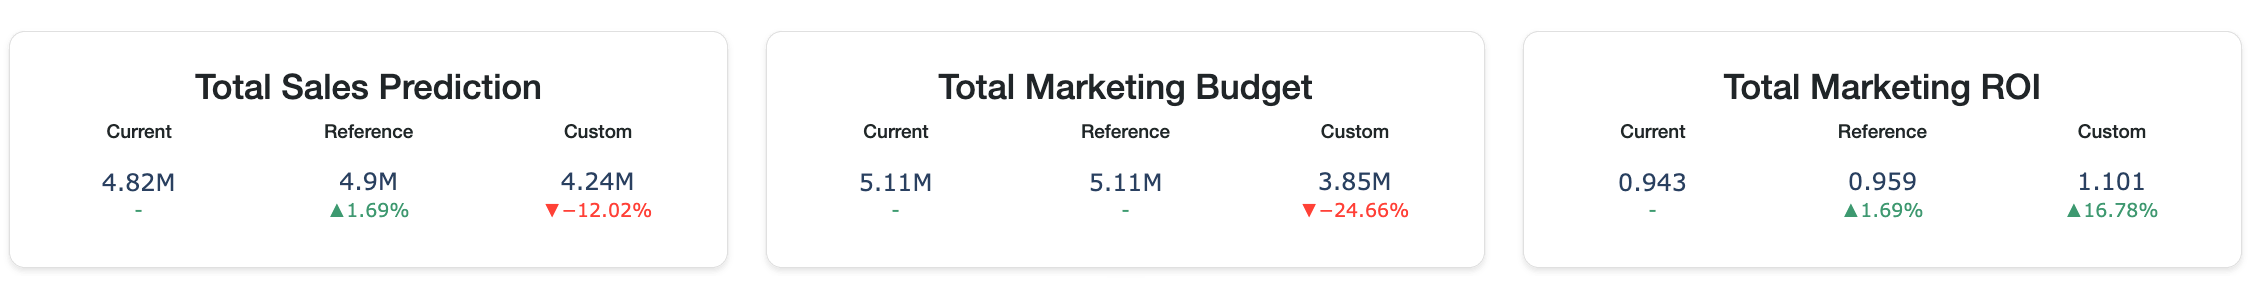
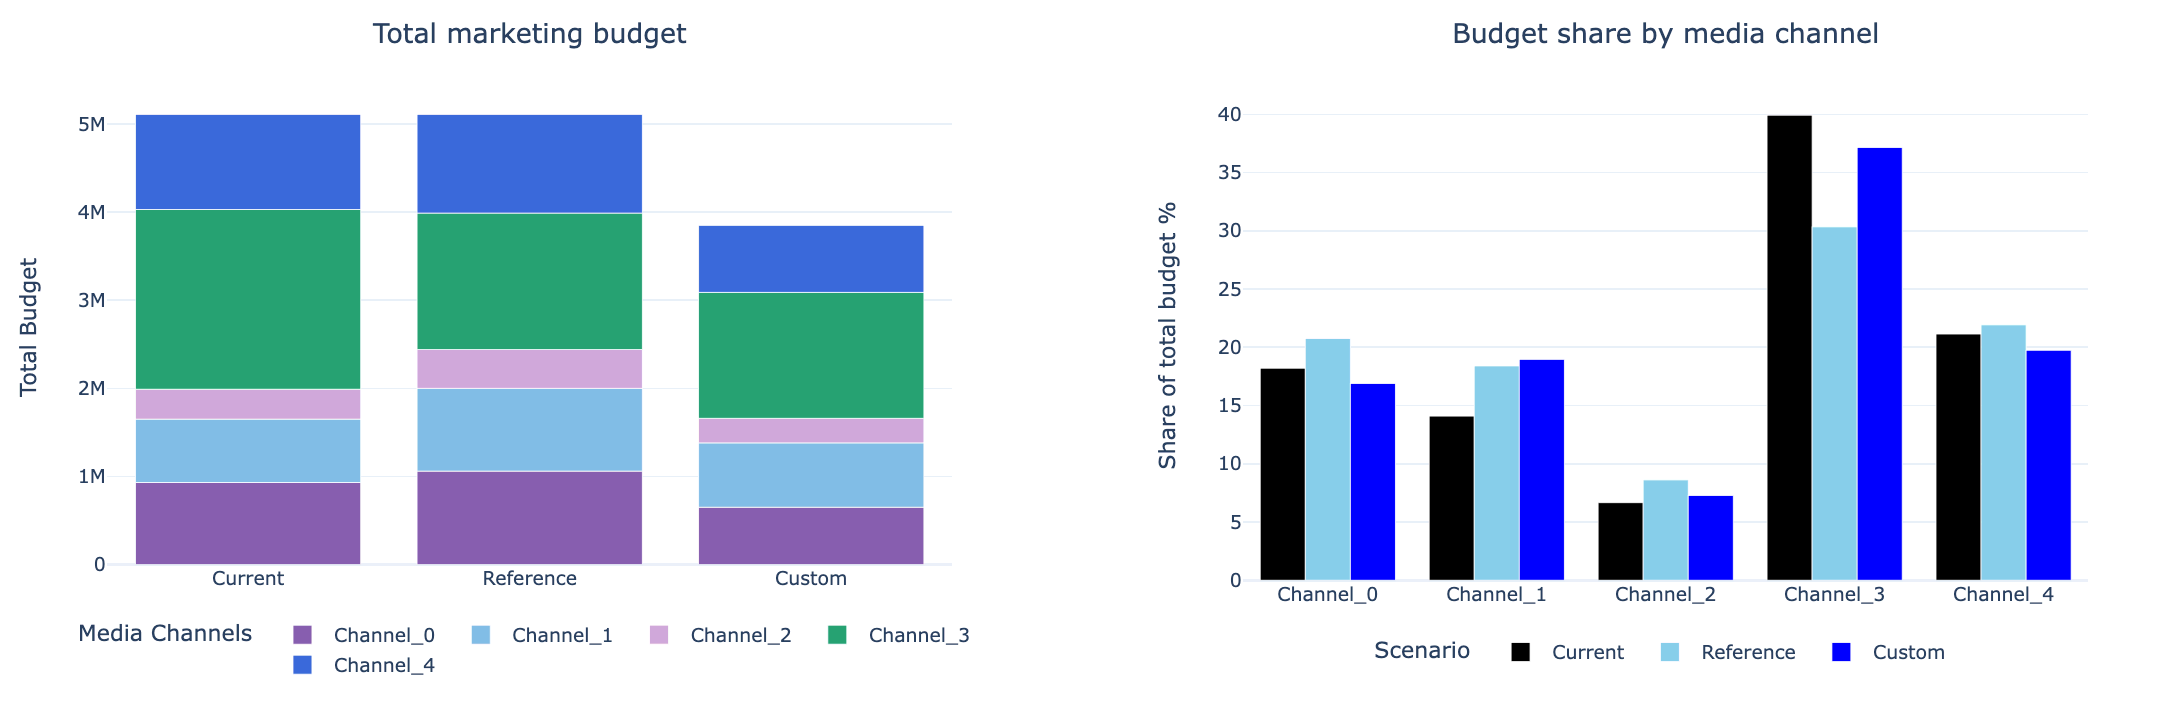
At the top of the screen, you see the predicted total sales over the test period, the total marketing budget, and the marketing ROI.
“Current” represents the results assuming the current marketing strategy (so the same results that happened historically).
“Reference” shows the results of the first optimization based on the generic optimization parameters.
“Custom” is the result of the scenario configured in the webapp.
The central charts show the spending across channels in the three scenarios.
Analyzing the results
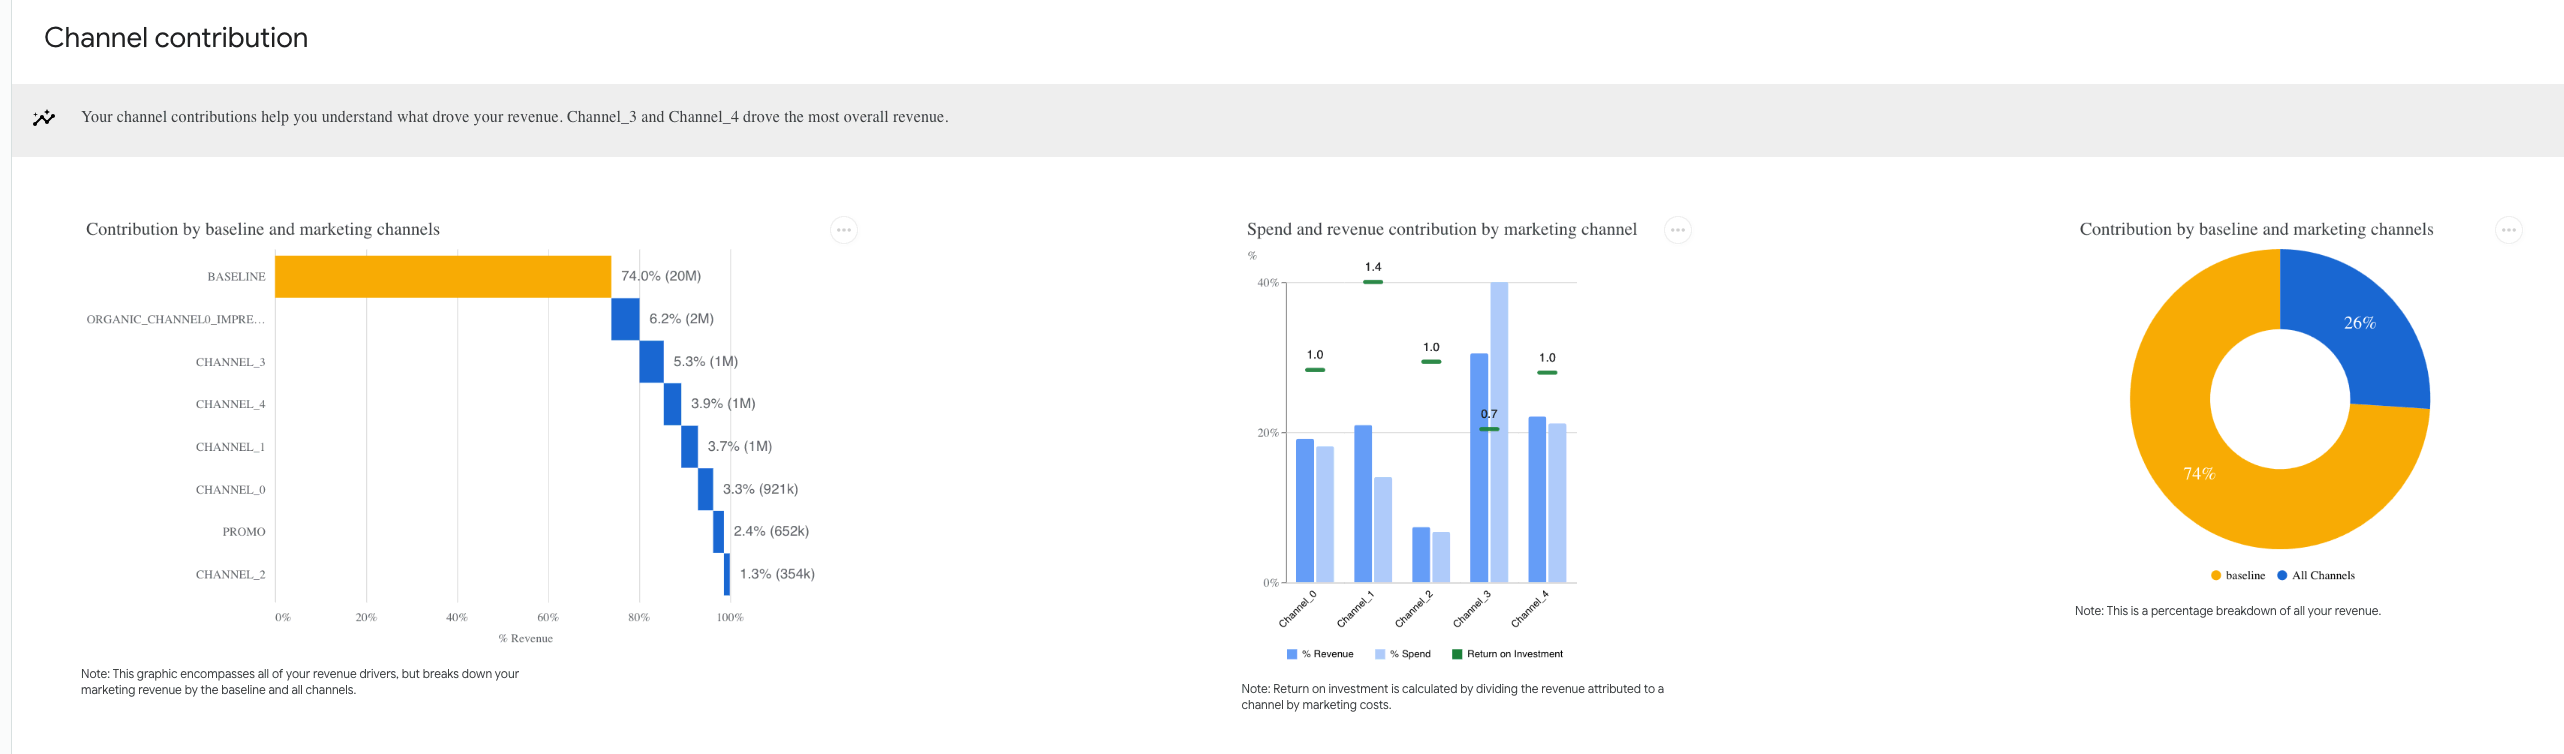
The model summary pages list different metrics about the quality of the model’s training and the impact of the marketing channels. This information reveals each channel’s contribution in terms of predicted ROI and marginal ROI. These metrics can help you make decisions by identifying channels that are saturated (low marginal ROI) and comparing ROI across channels to find the most effective ones.
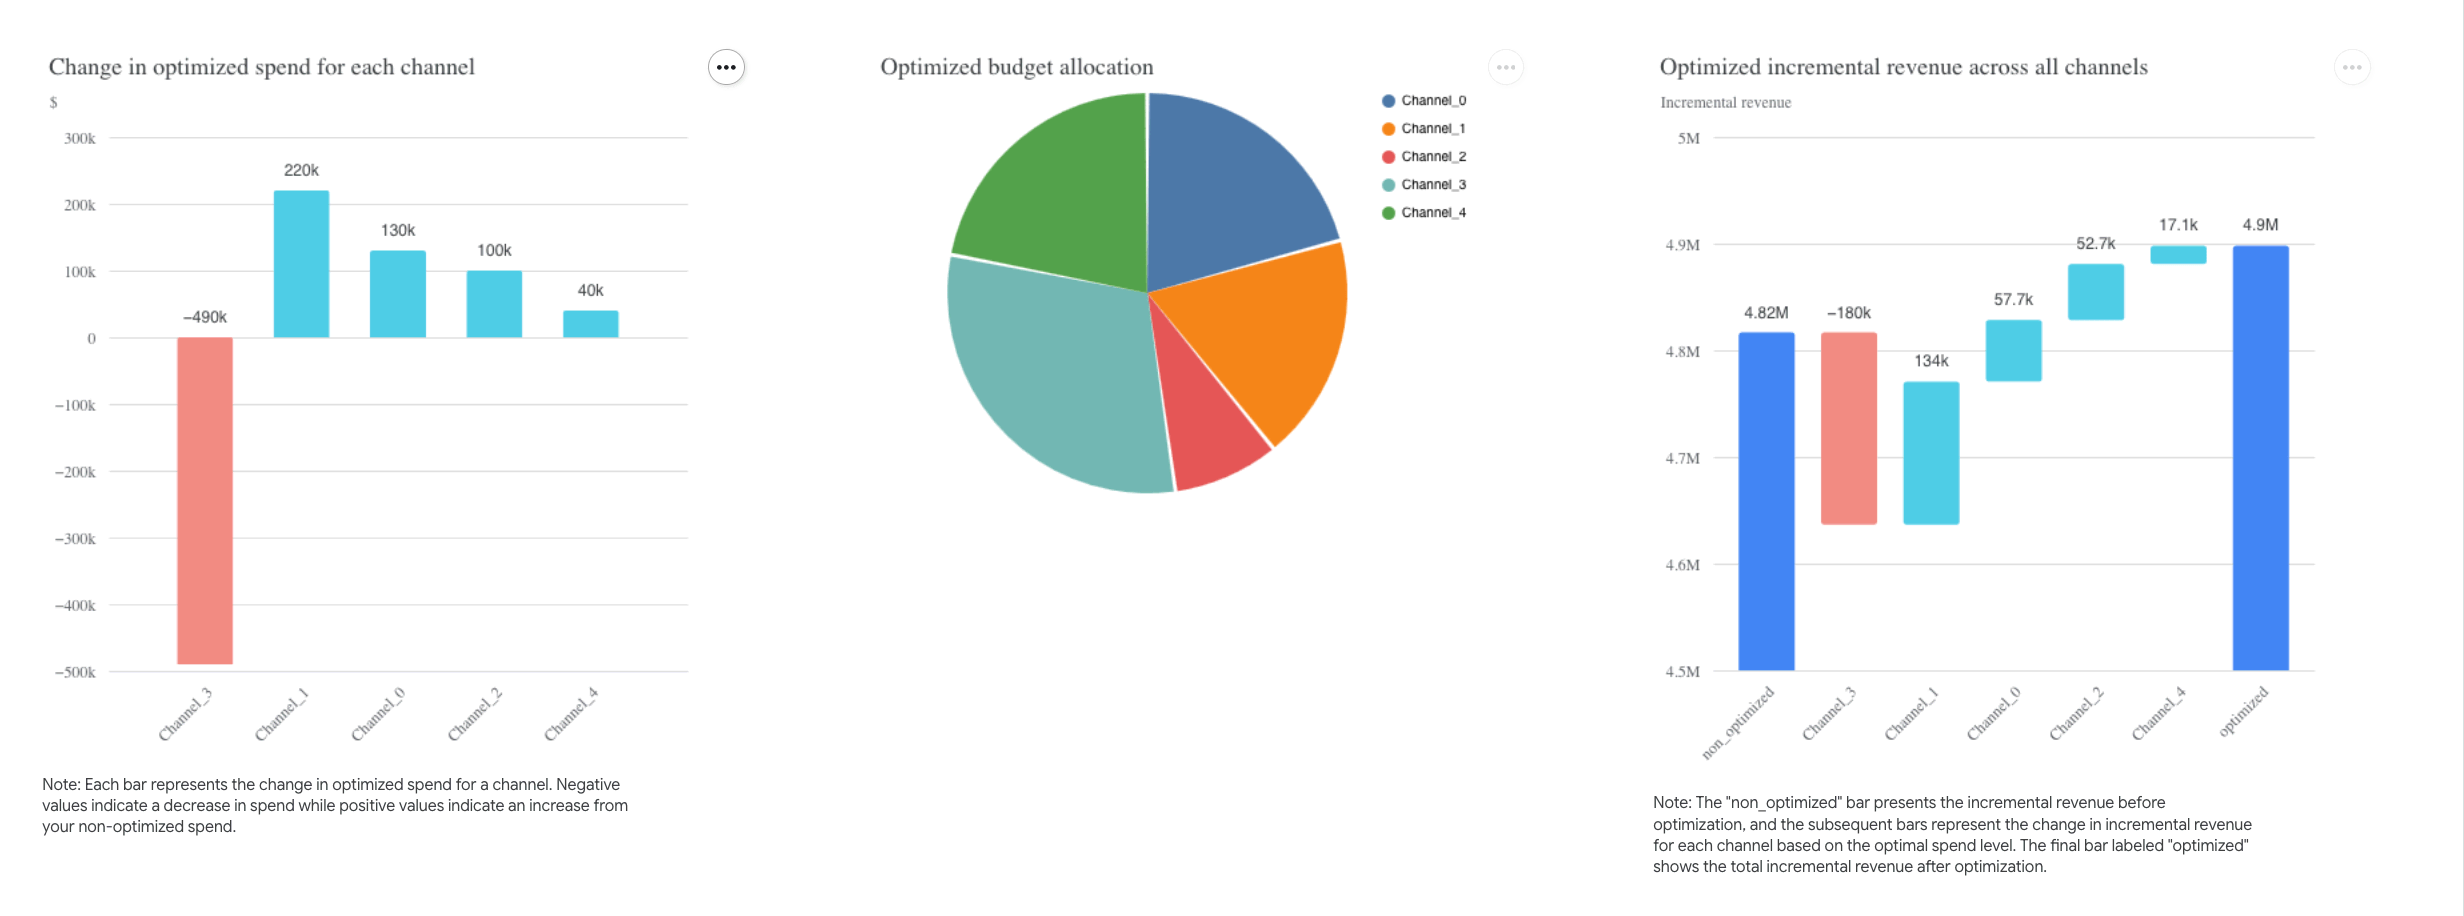
The optimization summary gives the predicted optimal marketing spend based on the optimization characteristics. You can see which channels to reduce and which to increase, and you can validate the impact with the response curves to determine if you should increase the exploration ranges.
Reproducing these processes with minimal effort for your data#
This project helps marketing teams understand how to use Dataiku to find the optimal budget in various contexts.
By using this Solution, you can enable multiple teams in your organization, leading to more efficient marketing campaigns by identifying the most effective spending channels.
This documentation has provided several suggestions on how to derive value from this Solution. Ultimately however, the “best” approach will depend on your specific needs and data. If you’re interested in adapting this project to the specific goals and needs of your organization, Dataiku offers roll-out and customization services on demand.