Solution | Process Mining#
Overview#
Business case#
Process optimization to reduce costs and improve efficiency is a perennial priority for companies. During economic periods in which cost pressures are especially pressing, a focus on process optimization becomes all the more critical to ensure continuing business success and resilience.
The ever-increasing use of technology systems to manage key processes provides previously hard-to-measure opportunities for process analysis and optimization. These systems generate timestamped event logs as a byproduct of their primary task (for example, case management, process execution).
This, in turn, enables a shift from time-consuming and potentially erratic process evaluation techniques (for example, spot checks, time-in-motion studies) to modern, comprehensive, rapid, and statistically driven analytics via process mining. By leveraging event logs, process mining instantly creates a visual and statistical representation of any process, allowing teams to immediately review deviations from the expected process, identify bottlenecks, and monitor the impact of changes.
Installation#
From the Design homepage of a Dataiku instance connected to the internet, click + Dataiku Solutions.
Search for and select Process Mining.
If needed, change the folder into which the Solution will be installed, and click Install.
Follow the modal to either install the technical prerequisites below or request an admin to do it for you.
From the Design homepage of a Dataiku instance connected to the internet, click + New Project.
Select Dataiku Solutions.
Search for and select Process Mining.
Follow the modal to either install the technical prerequisites below or request an admin to do it for you.
Note
Alternatively, download the Solution’s .zip project file, and import it to your Dataiku instance as a new project.
Technical requirements#
To use this Solution, you must meet the following requirements:
Have access to a Dataiku 14+* instance.
Code environment named
solution_process-mining-v1-4-1with Python 3.9+, pandas 2.2, and the following packages:dash==2.9.3 dash_bootstrap_components>=1.0 dash_daq>=0.5 dash_interactive_graphviz>=0.3 dash_table==5.0 Flask-Session==0.5.0 dash_extensions==1.0.9 graphviz==0.17
You must install the open source graph visualization software Graphviz on the same system running Dataiku.
Data requirements#
The event log dataset used as input to the Solution must contain the following columns:
Column Type |
Purpose |
|---|---|
Case ID |
Unique identifier for each process instance |
Activity |
The name of each step in the process |
Timestamp |
When the activity started |
You can enrich the process analysis with the following optional columns:
Column Type |
Purpose |
|---|---|
End Timestamp |
Enables idle time vs. processing time split |
Sorting |
Breaks ties between activities with identical timestamps |
Case Attributes |
Useful for dashboard filters and segmentation |
Walkthrough#
Note
In addition to reading this document, it’s recommended to read the wiki of the project before beginning to get a deeper technical understanding of how this Solution was created and more detailed explanations of Solution-specific vocabulary.
This walkthrough uses real-world data from a loan application process within a Dutch financial institution, sourced from the BPIC Challenge 2012 and pre-loaded into every instance of the Solution as an example event log dataset.
Input and analyze audit logs#
After installation of the Solution, you will find a new Process Mining entry in the Applications section of your Dataiku homepage.
Create a new instance of the Dataiku app.
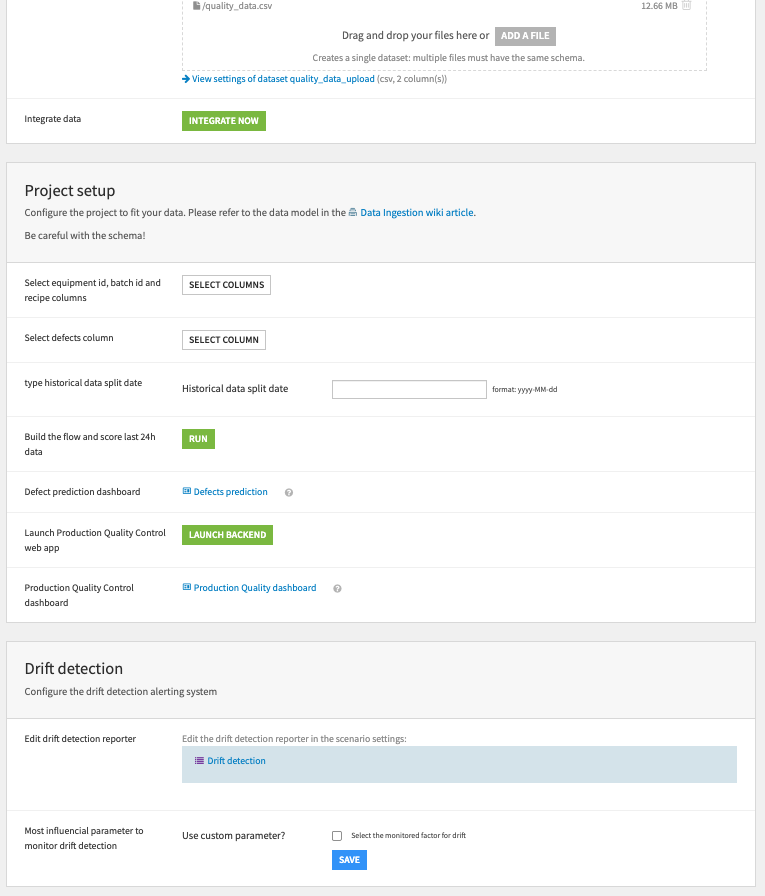
Click to configure the input data with the pre-loaded file, and map columns as follows:
Case ID → case_id
Activity → step
Timestamp → start_timestamp
End Timestamp → end_timestamp
Sorting Column → sequence_id
Case Attributes → amount_requested, execution_touches
Build the instance and open the Data Quality dashboard to validate data integrity. From this point on, you can follow along with the Solution in the Dataiku gallery.
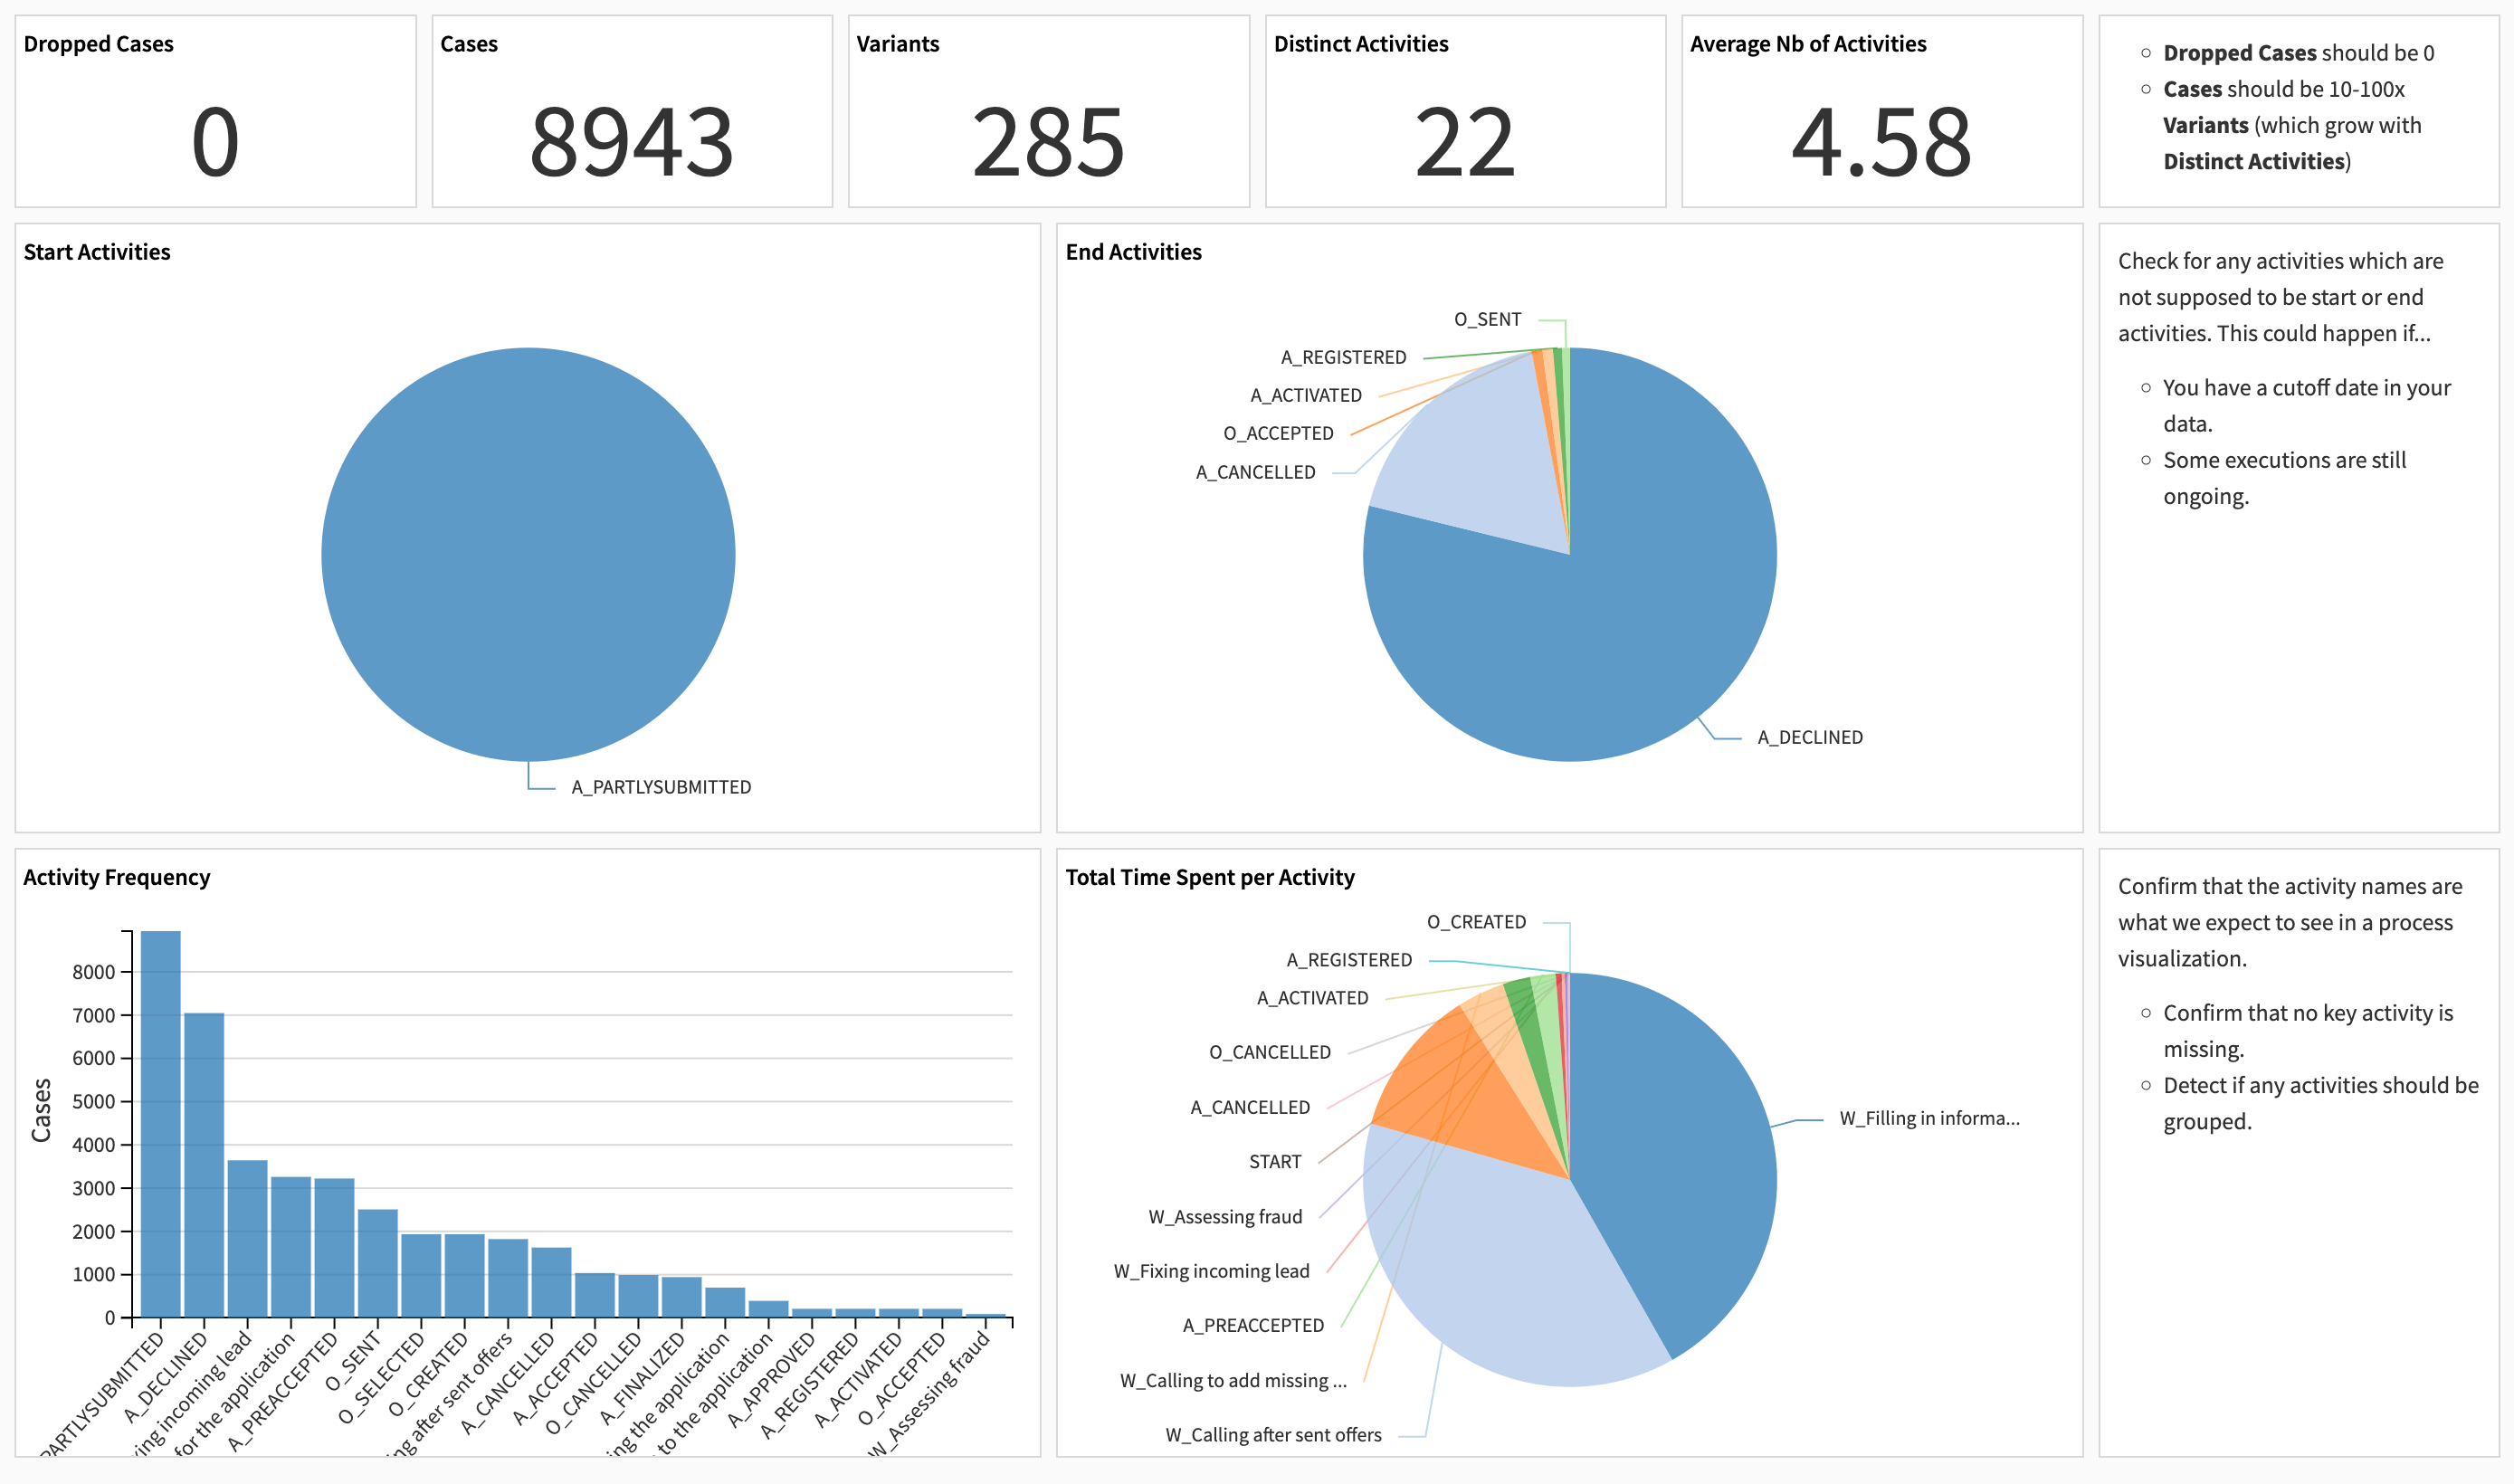
Uncover business insights with the Process Explorer#
Event logs are typically large, messy, and too complex to decipher without the right tools. The Process Mining dashboard addresses this with an interactive Process Graph:
Visualizes process variants (that is, different sequences of activities) in a flowchart-like format.
Built dynamically from process data and enriched with execution metrics.
Focuses on the most frequent variants to surface inefficiencies and anomalies fast.
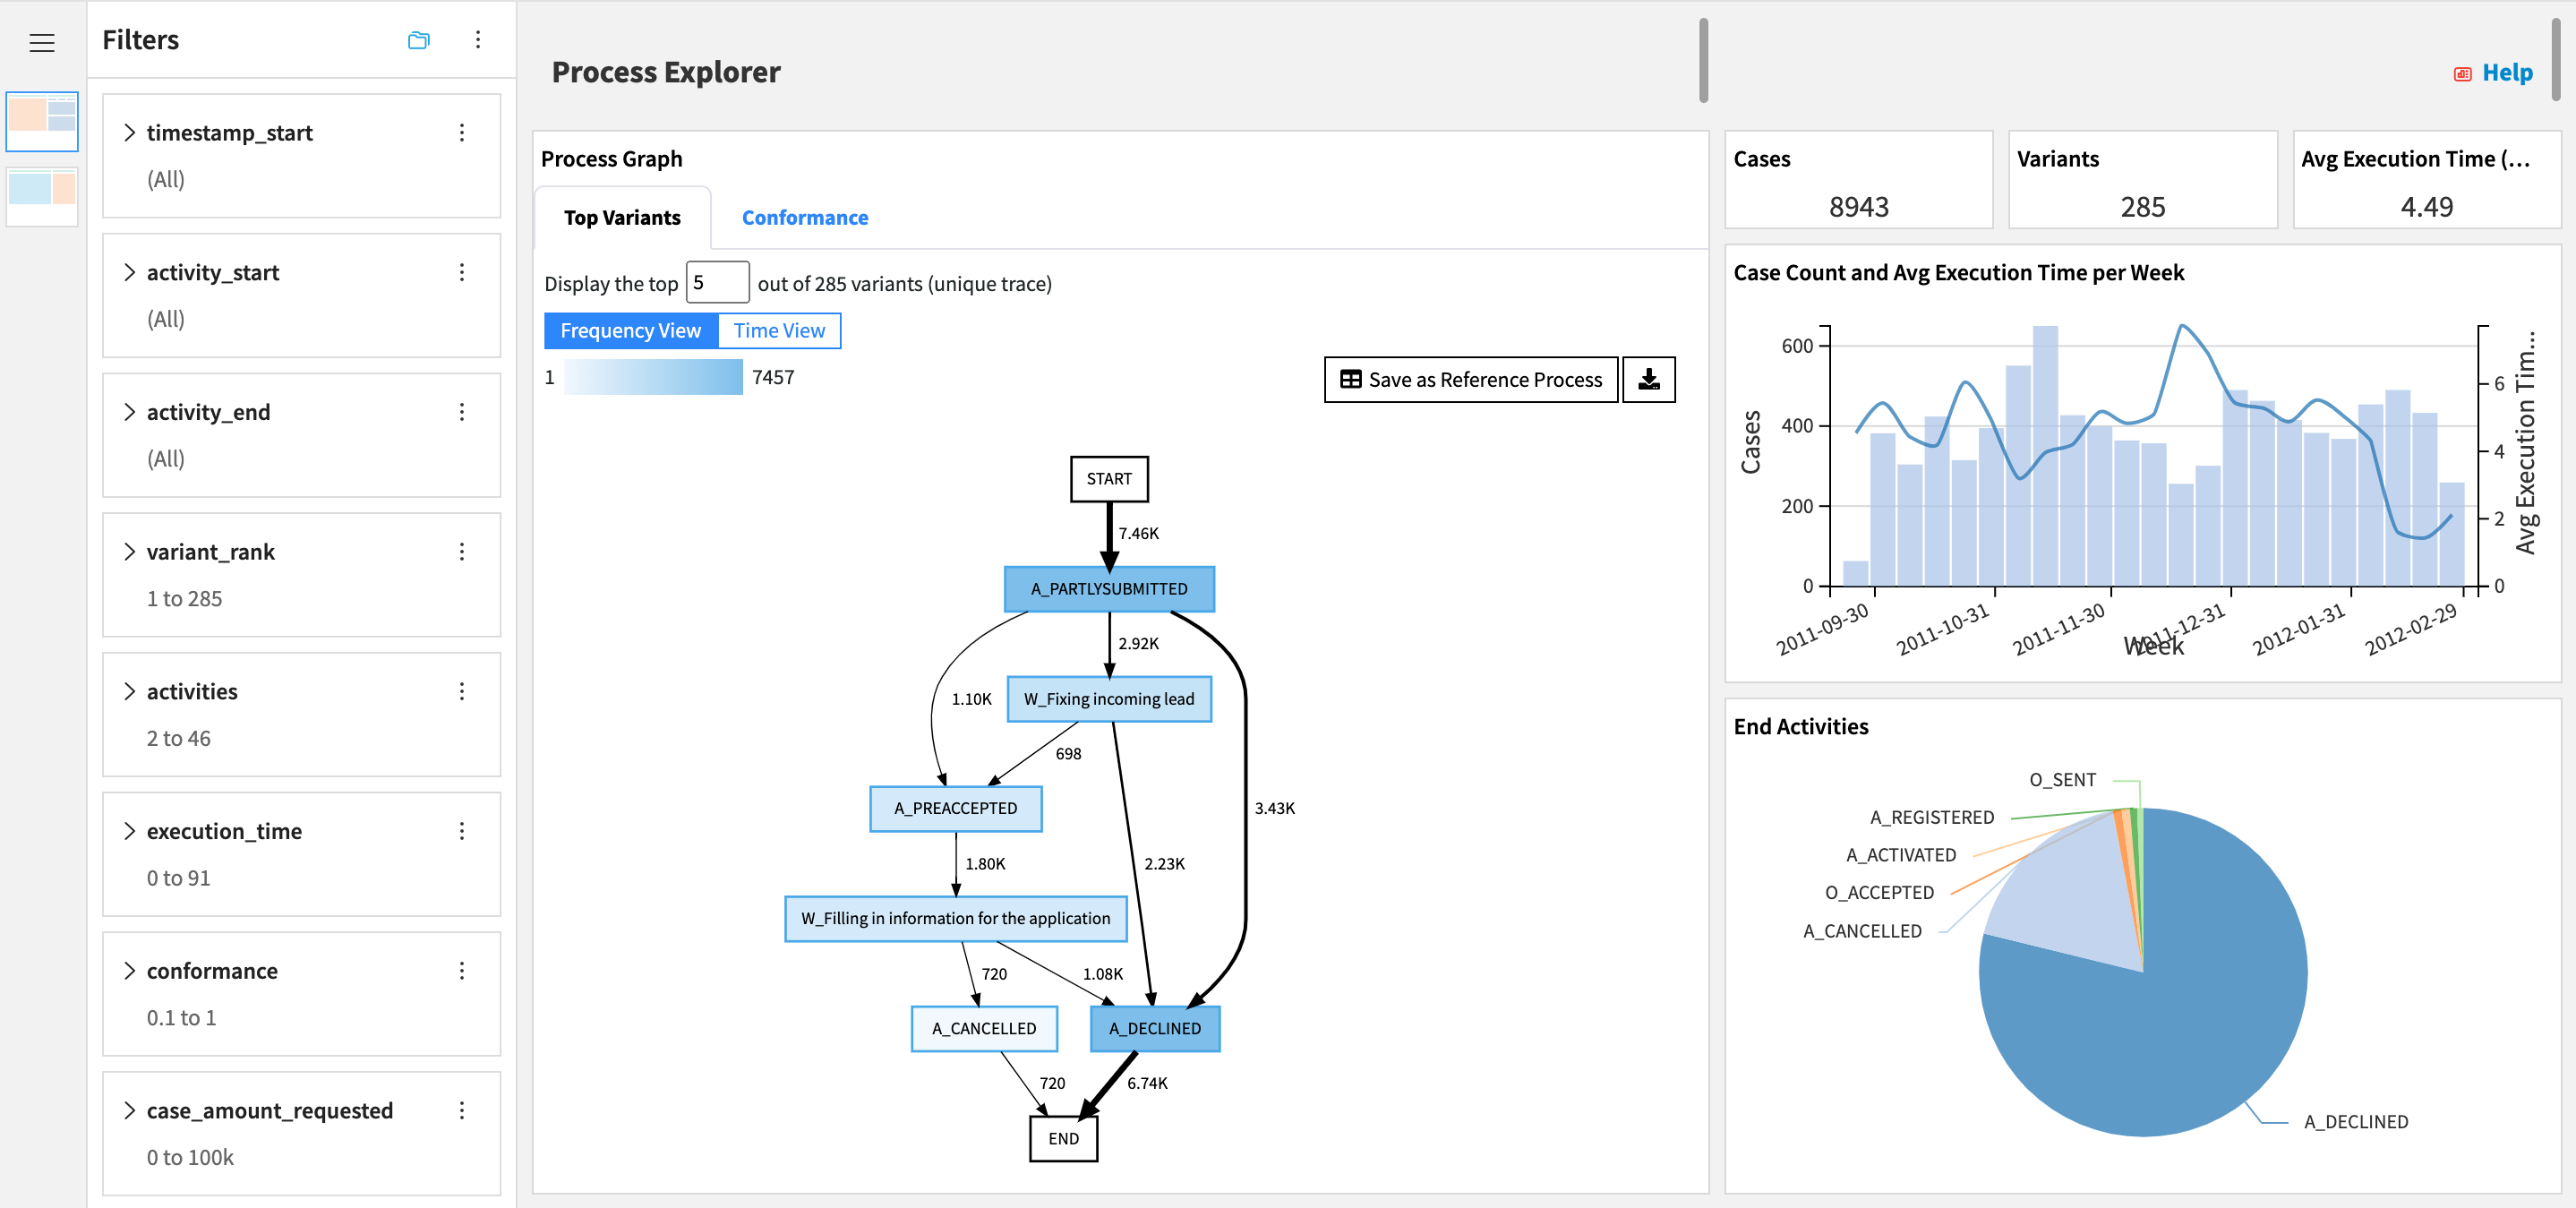
Process owners and analysts can derive business insights within minutes using Dashboard Filters and toggling the Process Graph between Frequency and Time Views. For example, filtering on activity_end = A_DECLINED and the top 50% of loans by amount_requested highlights bottlenecks for rejected high-value applications and helps prioritize process improvement efforts.
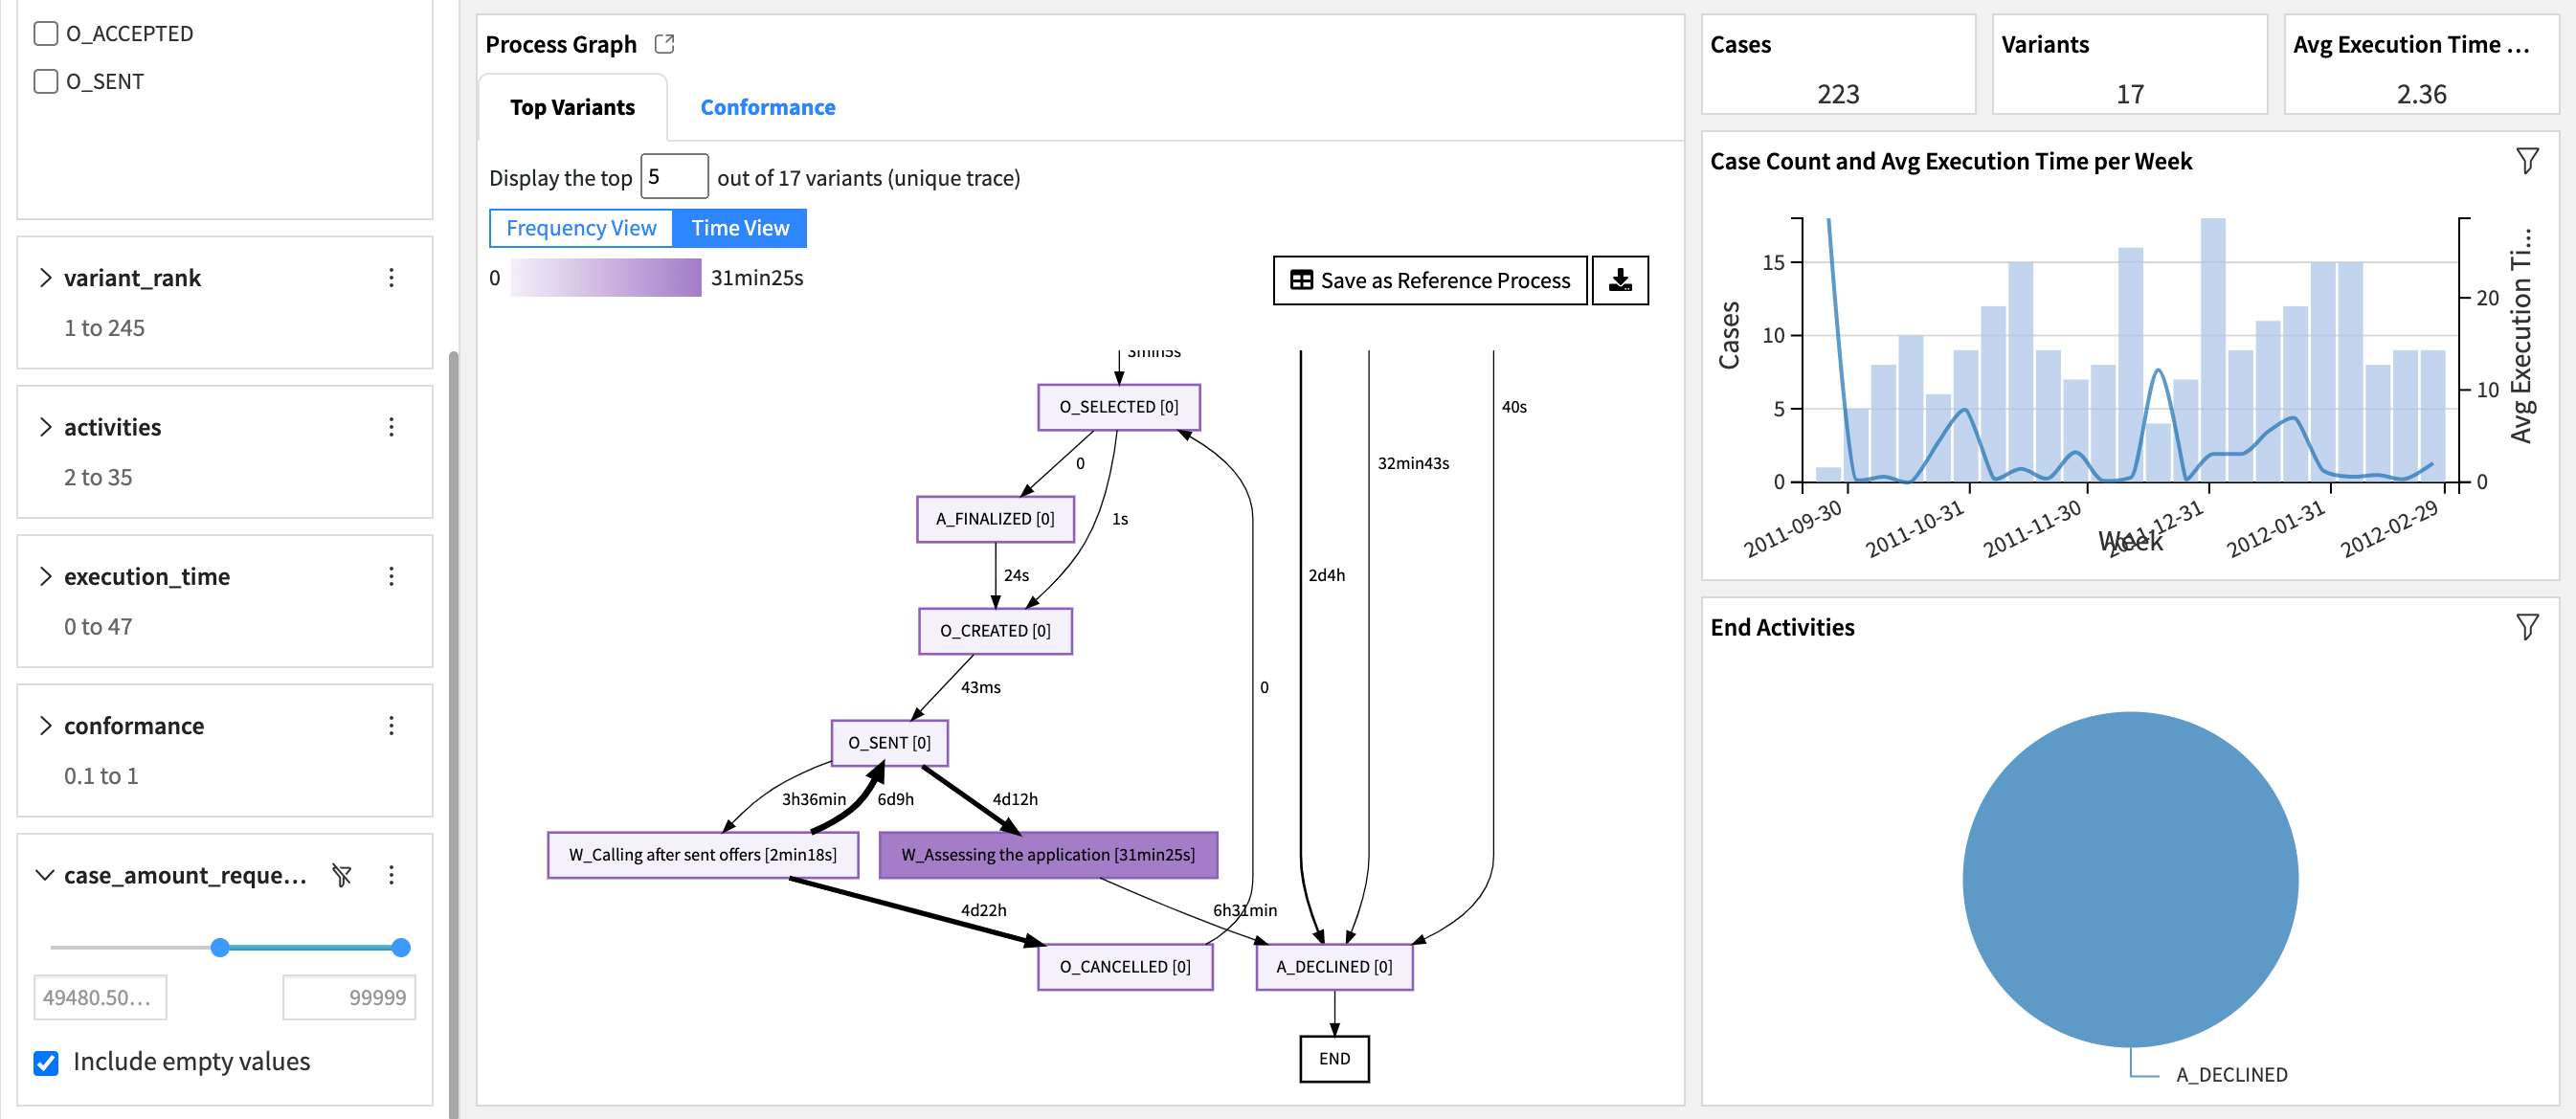
The Process Explorer page of the dashboard also features KPIs and charts that complement the Process Graph with aggregated views of process execution and performance for filtered cases.
Continuous monitoring#
You can continuously monitor the impact of process improvement efforts by configuring a pre-made automation scenario that updates the dashboard when new process data is collected. You can proactively address new issues in process execution by configuring the scenario reporter to alert operation managers via Teams, Slack, or email if KPIs degrade.
Conformance scoring#
Conformance scoring measures how closely each execution follows a defined reference process model (by default, it’s defined as the 5 most common process variants). This helps pinpoint deviations, non-compliance, and broken workflows.
You can use aggregated conformance scores, such as percentage of conforming cases or average score, as additional ways to assess overall process health. They can be added by editing the Process Explorer.
The Process Graph also features a Conformance view that helps visualize top sources of non-conformance via arrows pointing to the SINK meta-activity.
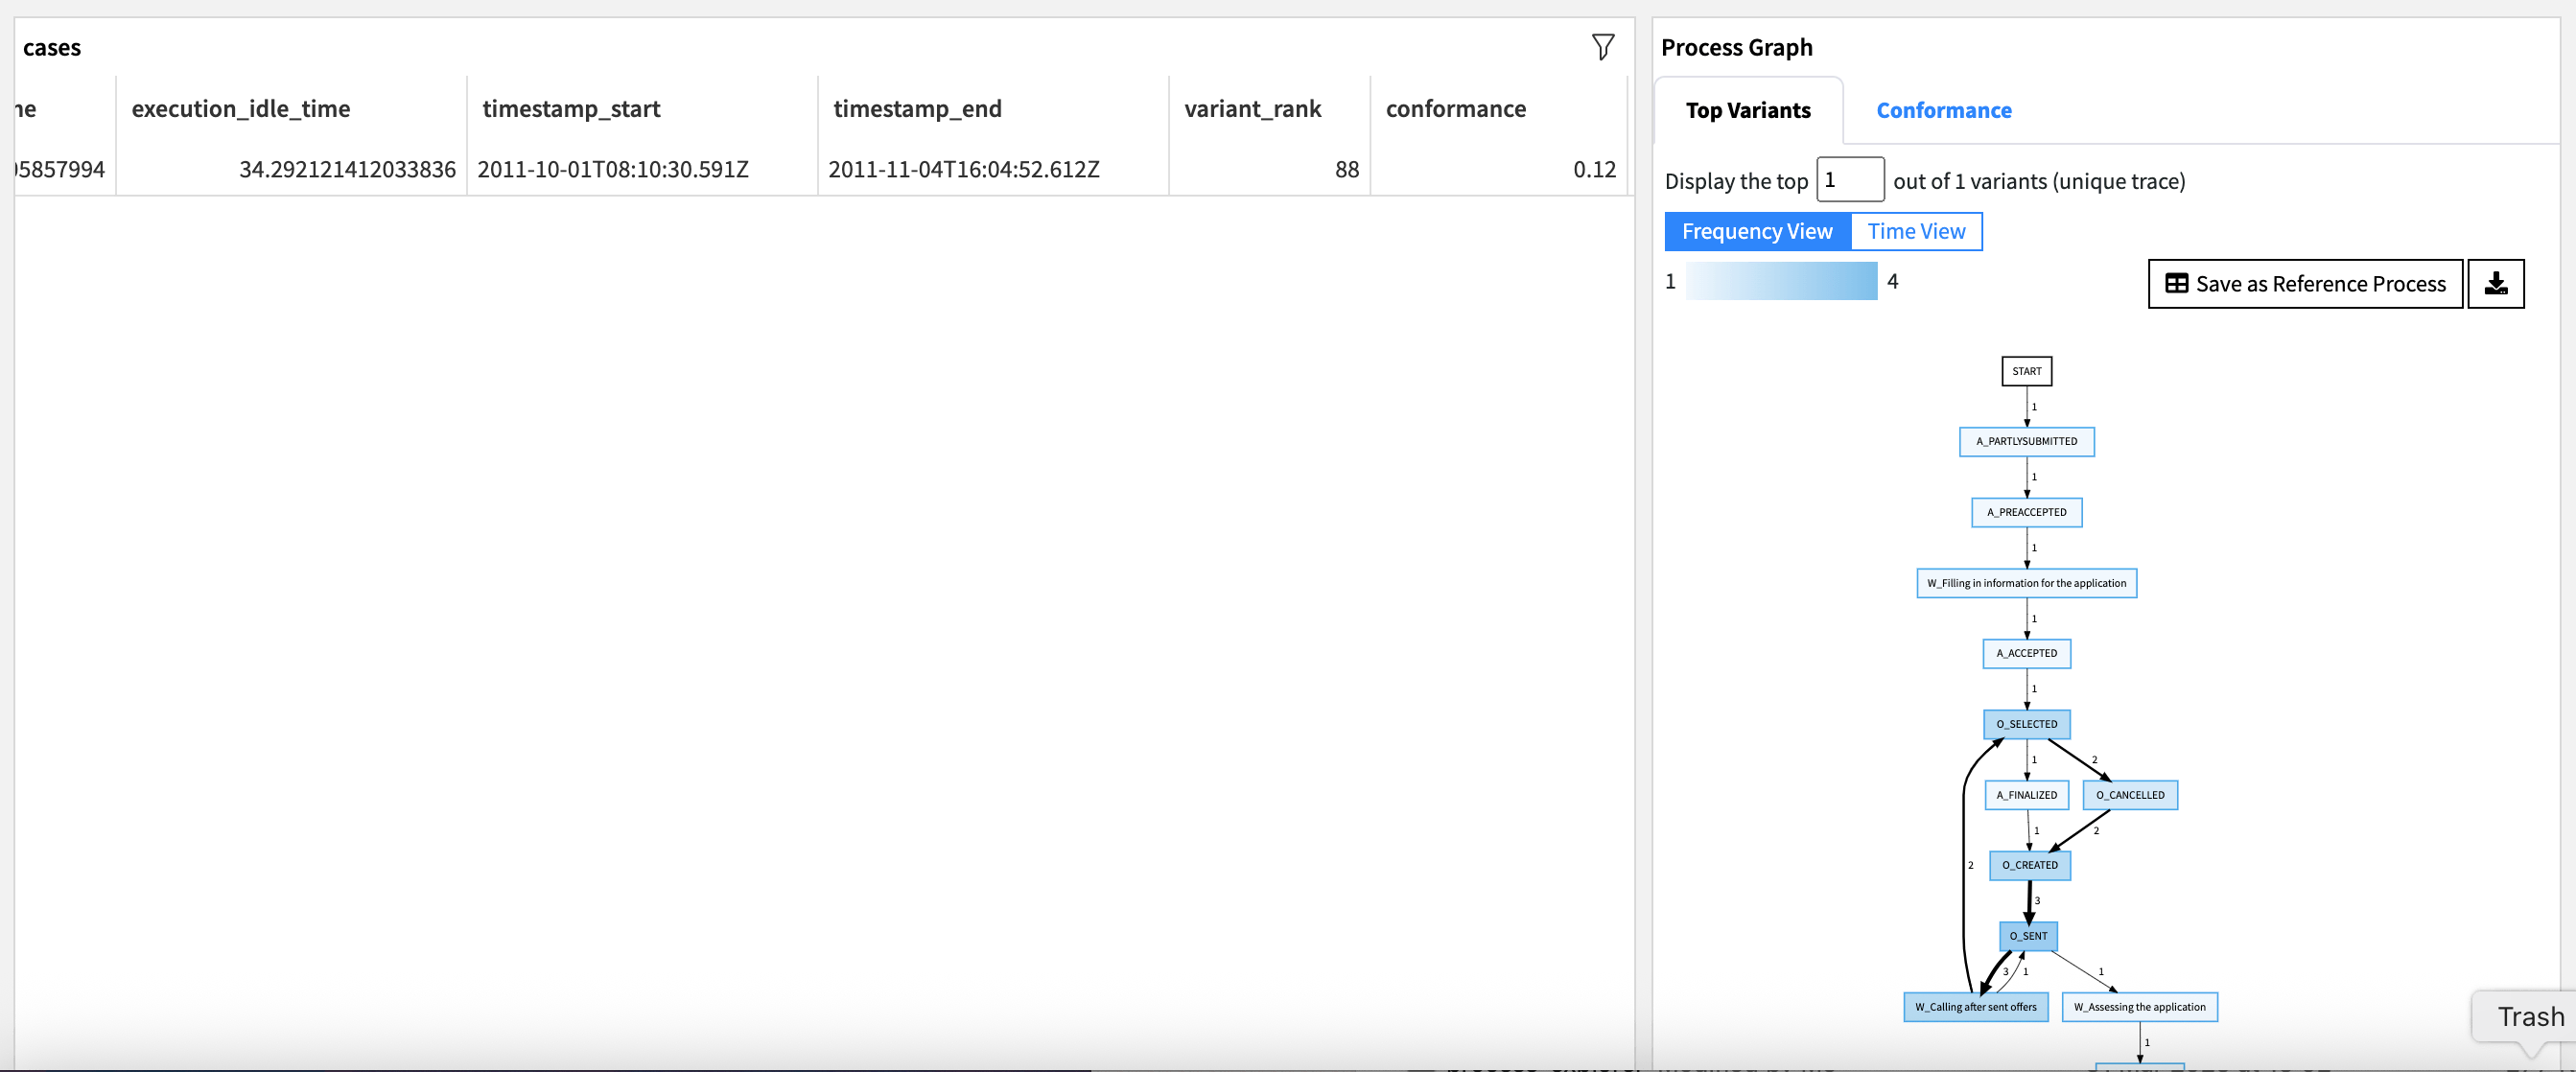
The Case Explorer provides a tabular view of all cases, gives the ability to surface cases with low conformance scores, and to focus the Process Graph on individual cases. In the example from the screenshot below, the selected case’s execution reveals two loops and helps understand the low conformance score.
Advanced process analytics#
Root Cause Analysis:
Process owners and analysts can select an anomalous activity or transition in the Process Graph and export related process data.
Data analysts/engineers/scientists can use the extensive Dataiku analytics toolbox to identify case attribute combinations most likely to lead to this anomaly.
Predictive Analytics: Dataiku’s visual ML provides a no-code Solution to:
Model total execution time.
Understand performance drivers by reviewing feature importance.
Predict time remaining on ongoing cases.
Optimize case routing for faster outcomes.
Reproducing with minimal effort for your own processes#
This Solution equips operations, transformation, and process improvement teams to create visual maps of processes based on readily available event logs. You can apply this to as many processes as desired by creating new instances of the Dataiku app. You can replace the example event log that comes pre-loaded by:
File upload (great for quick experimentation).
Direct database connection (great for production usage).
In summary, Dataiku’s Process Mining Solution can influence the decisions of various teams in any organization, by supporting them with smarter and more holistic strategies to deep-dive into processes.
The various no-code capabilities of the Dataiku platform can also accelerate:
Raw event log data preparation
Dashboard customization to meet the needs of specific teams and processes
Root cause analyses
AI process optimization efforts
This documentation has provided several suggestions on how to derive value from this Solution. Ultimately however, the “best” approach will depend on your specific needs and data. If you’re interested in adapting this project to the specific goals and needs of your organization, Dataiku offers roll-out and customization services on demand.

