
Solution | Financial Forecasting#
Overview#
Business case#
The financial forecasting processes managed by finance teams play a central role in supporting companies to make appropriate cost management and investment decisions. Yet 40 percent of CFOs feel their forecasts aren’t accurate and that the process takes too much time. To be more precise, less costly to produce forecasts are of immediate value.
However, connecting to the data and tapping into the different techniques needed to achieve them can feel out of reach. This can be a result of too little time available to setting up a new forecasting project or a lack of confidence in the statistical and machine learning techniques involved.
Enhancing the efficiency of financial forecasting requires:
Improving the capacity for finance teams to access data and automate data pipelines. Rather than relying on manual checks and merges via spreadsheets, teams can streamline their processes, save time and reduce errors, allowing them to focus more on analysis and decision making.
Easing the comparison of traditional and advanced statistical / machine-learning forecasting techniques, with simple tests and selection of appropriate drivers, developing more accurate projections alongside full ownership and explainability.
Dataiku’s Financial Forecasting Solution offers finance teams an opportunity to confidently transition through a shift in their business impact while retaining full control of process and outputs.
Installation#
From the Design homepage of a Dataiku instance connected to the internet, click + Dataiku Solutions.
Search for and select Financial Forecasting.
If needed, change the folder into which the Solution will be installed, and click Install.
Follow the modal to either install the technical prerequisites below or request an admin to do it for you.
Note
Alternatively, download the Solution’s .zip project file, and import it to your Dataiku instance as a new project.
Technical requirements#
To use this Solution, you must meet the following requirements:
Have access to a Dataiku 13.1+* instance.
A Python 3.9+ code environment named
solution_financial-forecastingwith the following required packages:
pmdarima == 2.0.2
numpy==1.22.4
urllib3<2
Data requirements#
The input data should be separated into two distinct groups of datasets: historical_* and to_forecast_* datasets with the same time-frequency:
Three historical datasets: historical time series data about the financial variable to forecast, manual forecasts, and drivers.
historical_actual_value_dataset
historical_forecasts_dataset
historical_drivers_dataset
Two to_forecast datasets: time series data about the period we want to forecast, including drivers’ expected values and manual forecasts.
to_forecast_forecasts_dataset
to_forecast_drivers_dataset
These datasets include the following features:
Feature |
Description |
|---|---|
date |
Sequence of dates taken at successive equally spaced points in time. |
actual_value |
Historical value of the quantitative variable the user wants to forecast. |
category |
Subcategories into which the target value is split. |
manual_forecast |
Forecasts figures computed manually by the user. |
driver_n_name (optional) |
Company specific or macroeconomic information chosen by the user. |
Two approaches to revenue forecasting#
You can approach revenue forecasting in two main ways:
Approach |
Usage |
Dataiku Solution |
|---|---|---|
Bottom-Up |
This method predicts the quantity of “product” sold at a granular level (for example, units per product or category) and multiplies by price to estimate revenue. Forecasts are based on prior sales data and drivers at equal or greater granularity, such as weather, holidays, or customer/product attributes. |
|
Top-Down |
This method forecasts total revenue directly for a business unit, without using |
Financial Forecasting (this one) |
Each approach lends itself to different industries and expectations. Top-down approaches are most often seen when firms are selling bundles of products, or generating streams of revenue, such that counting individual products with consistent specific prices isn’t well matched to their business reality.
Workflow overview#
You can follow along with the Solution in the Dataiku gallery.
The project has the following high-level steps:
Configure the project with data and adjustments via the Dataiku app.
Clean and prepare financial data.
Explore historical data to identify trends and seasonality.
Create two distinct forecast options and cross-evaluate performance.
Visualize financial forecasts to compare approaches and analyze the relationship between drivers and value.
Walkthrough#
Note
In addition to reading this document, it’s recommended to read the wiki of the project before beginning to get a deeper technical understanding of how this Solution was created and more detailed explanations of Solution-specific vocabulary.
Tailor the project to your needs#
To begin, you’ll need your own instance of the Dataiku app associated with this Solution.
From the waffle (
 ) menu of the Design node’s top navigation bar, select Dataiku Apps.
Search for and select the application with the name of this Solution.
Then, click Create App Instance.
The project includes sample data. You need to replace it with your own data, assuming that it adopts the data model described above. You can do this in one of two ways:
Upload data directly from your filesystem in the first section of the Dataiku app.
Connect to your database of choice by selecting an existing connection.
In both options, when loading in the data, be sure to refresh the page so that the app can dynamically take your data into account.
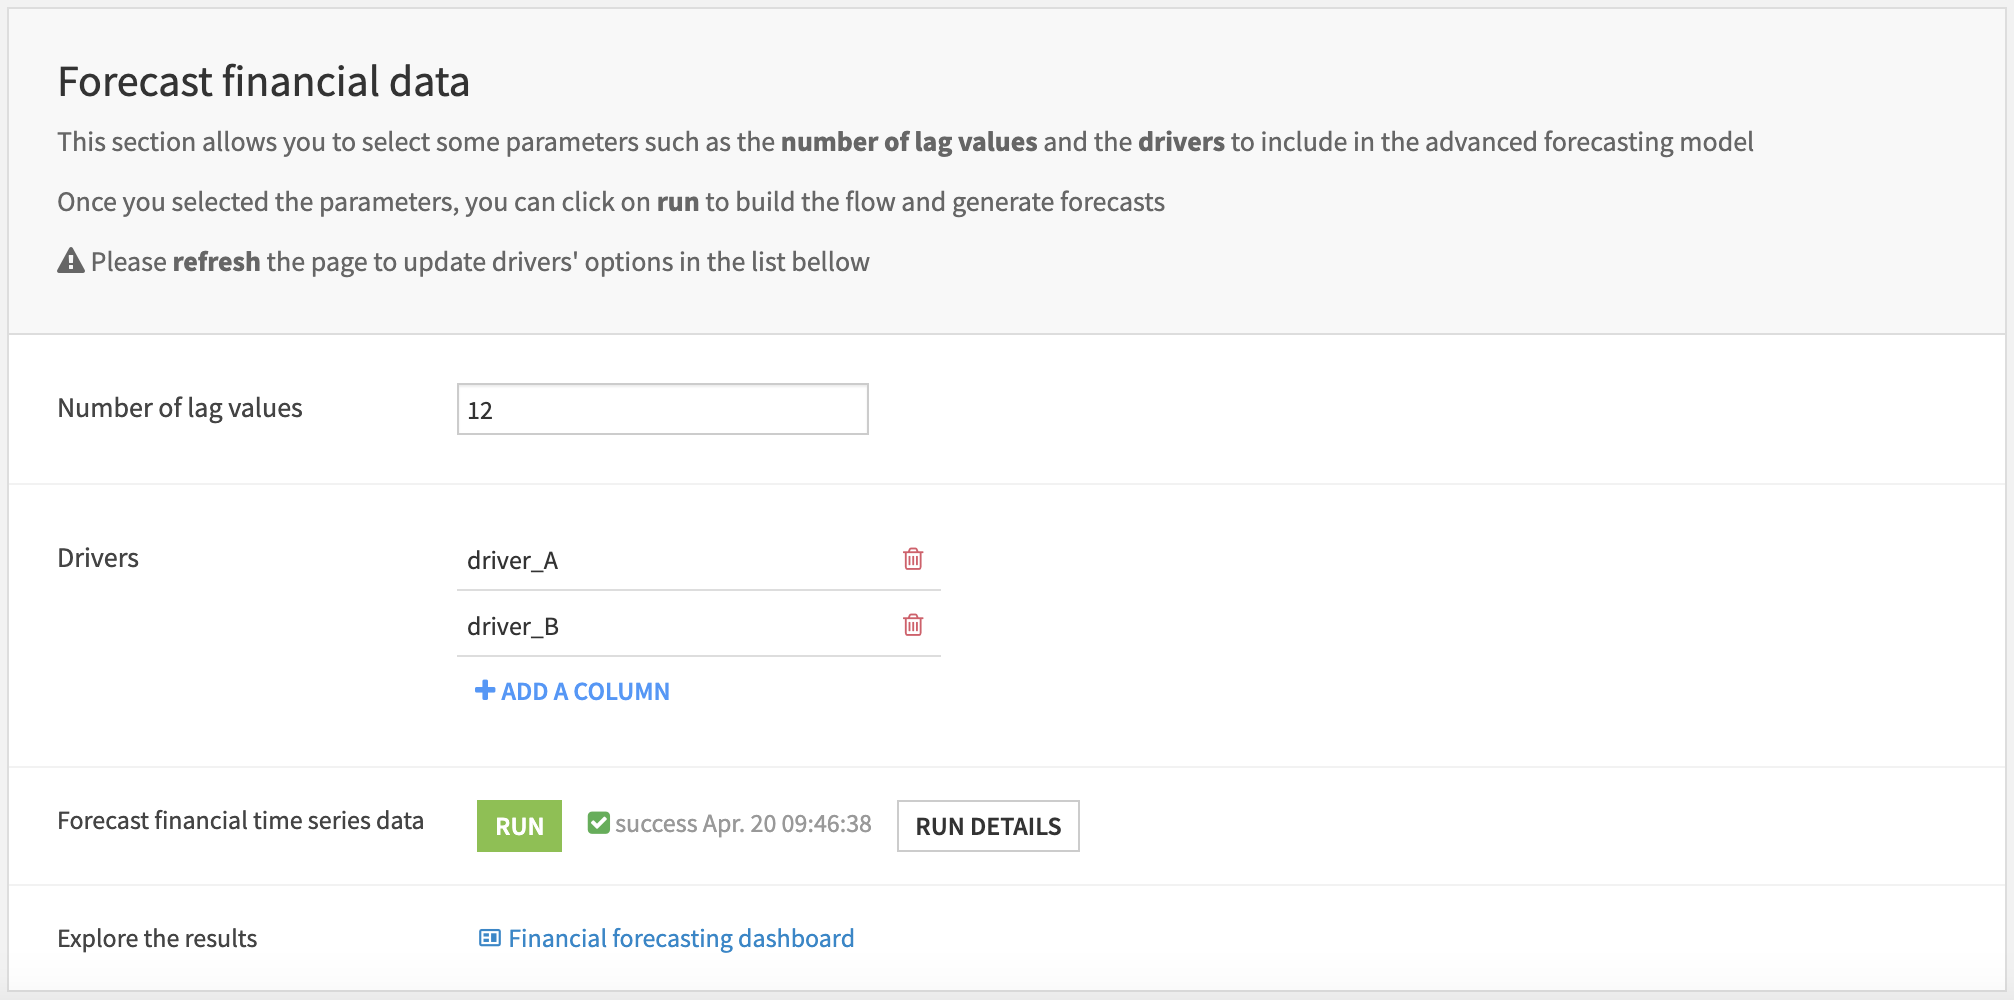
With your data selected and loaded into the Flow, you can move to the final app section Forecast financial data. Here you can select the number of lag values and the drivers from your historical data to include in the advanced forecasting model.
Clicking Run will initiate a series of scenarios that rebuilds the entire Flow and updates the dashboard. If you’re only interested in the dashboard, you can skip the following sections which will dive into the underlying Flow that supports the Dataiku app.
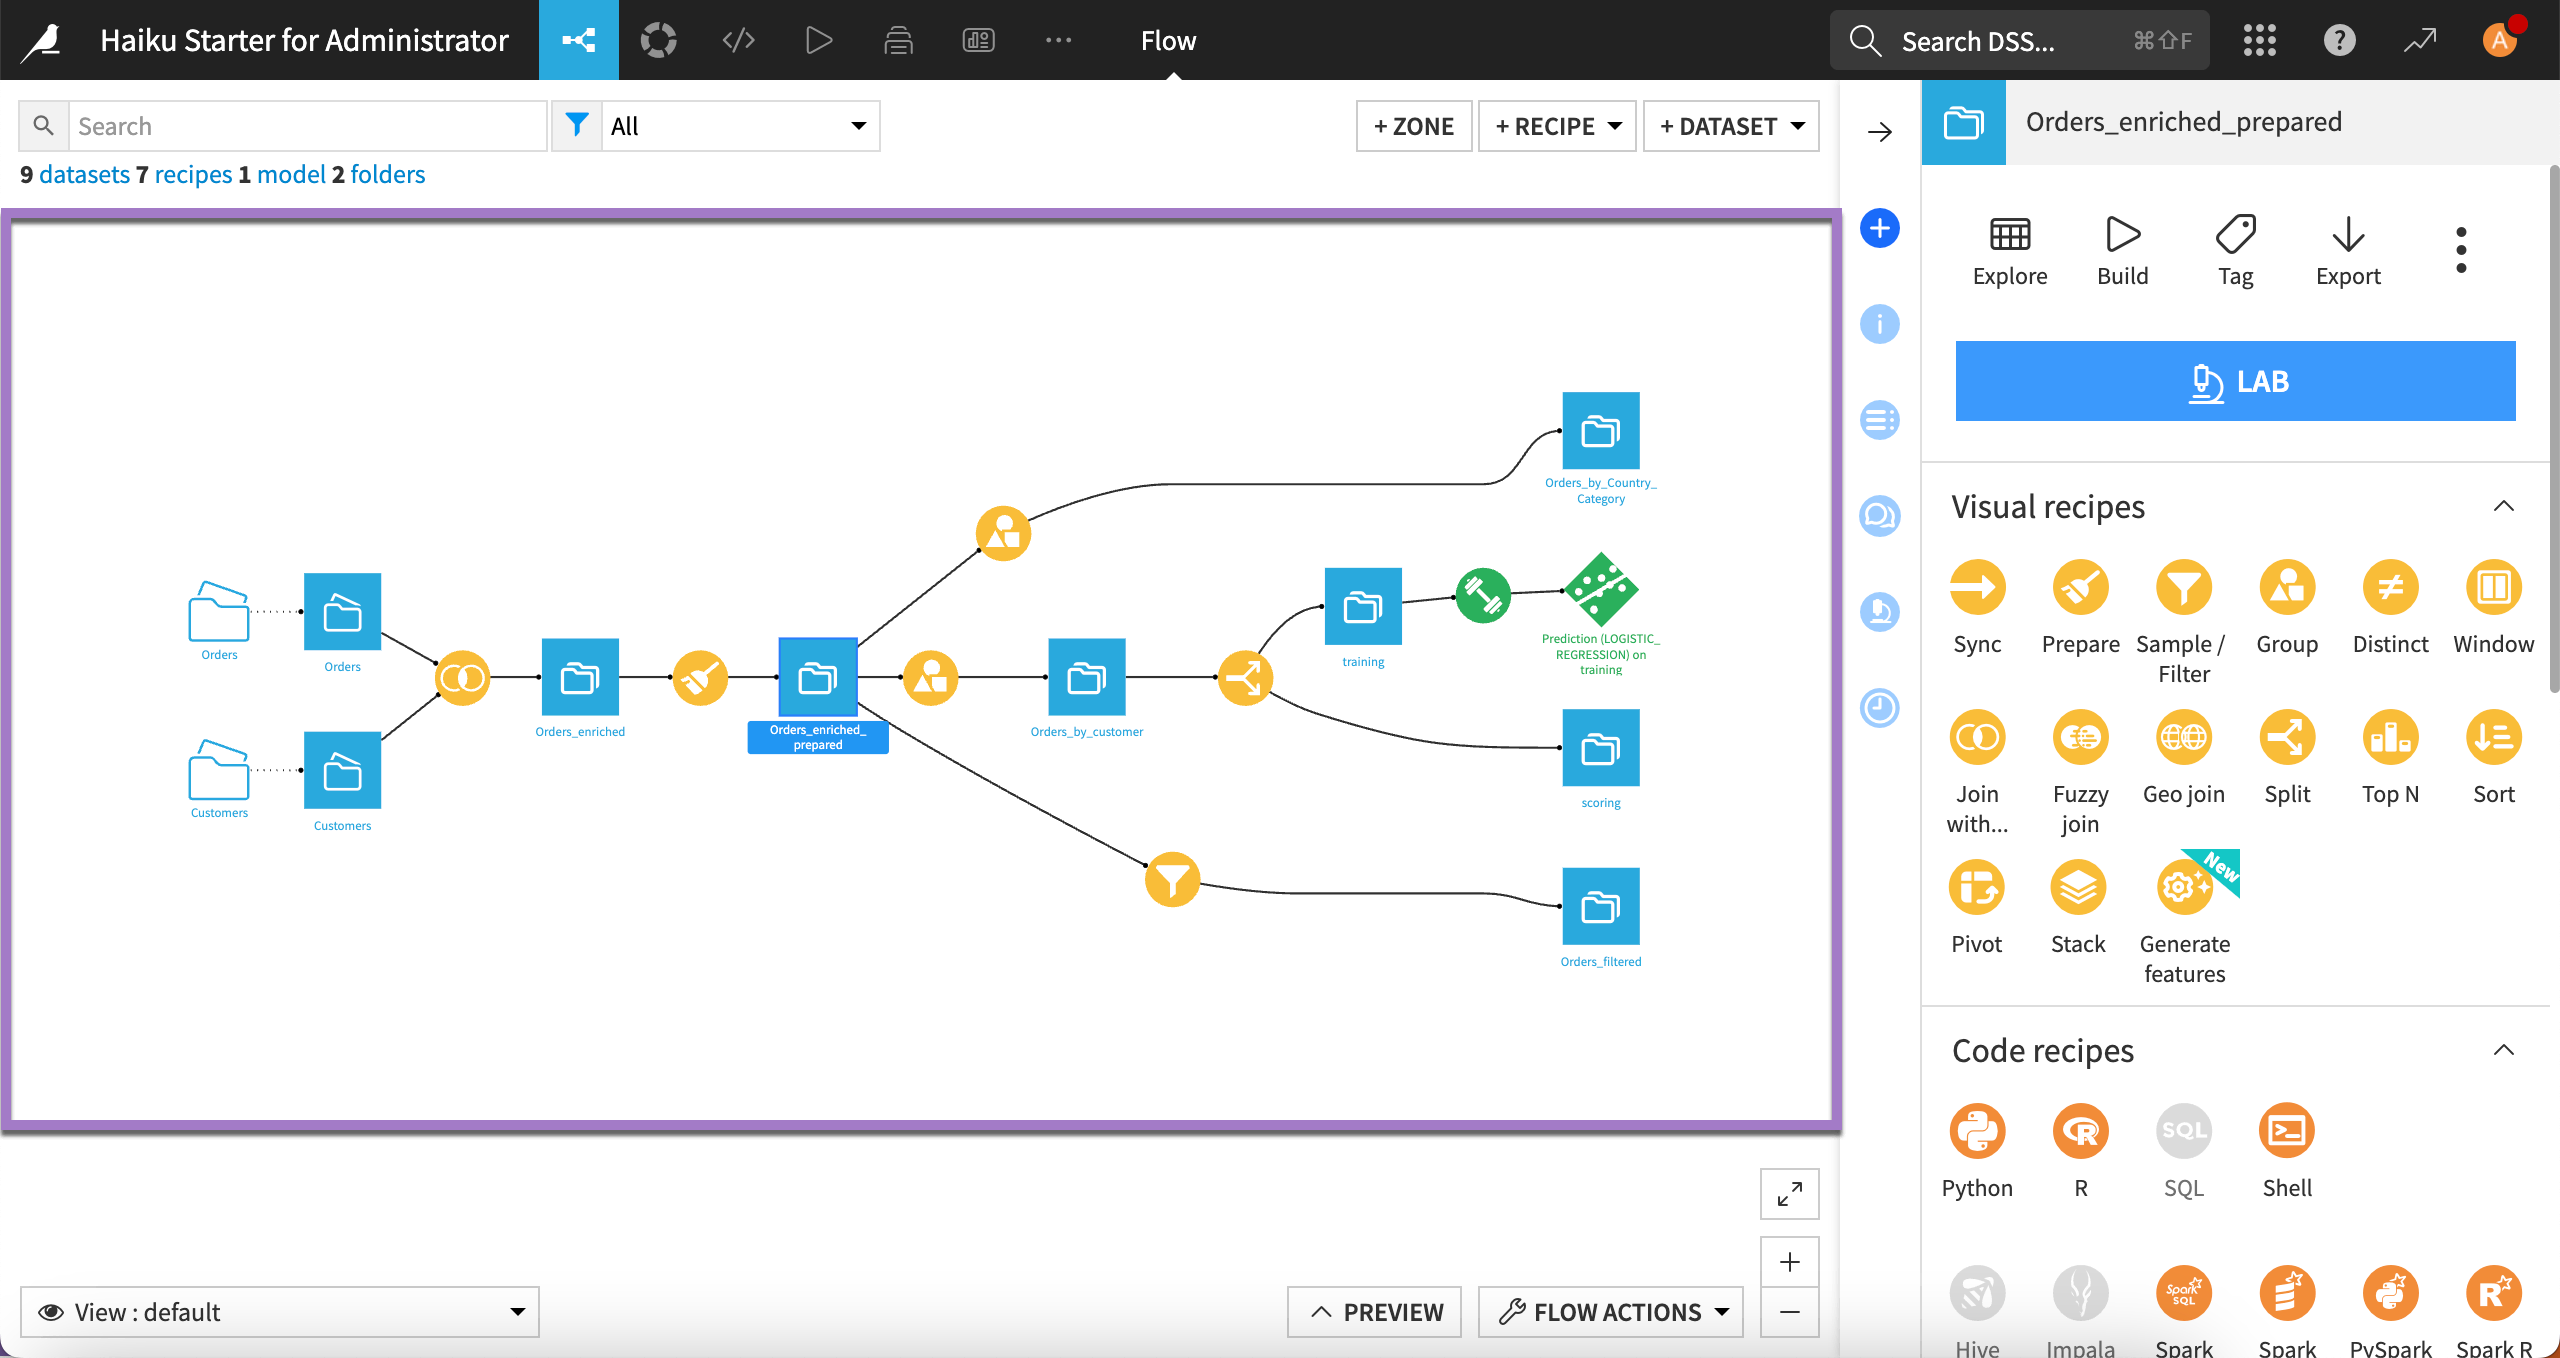
Cleaning and preparing historical financial data#
This Solution includes ten Flow zones for data preparation and cleaning. We won’t go into heavy detail for each Flow zone. You can find this information in the project wiki. However, at a high level, the first seven Flow zones found toward the start of the Flow perform data normalization and lag values creation from the originating input datasets.
To deal with potential differences in the magnitude of values within each provided category, the project uses a min-max normalization technique on the target variable. By applying a linear transformation on the original time series data, it scales numeric features into a given range (for example, 0 to 1 or -1 to 1).
Since we’re working with time series data, lag value creation is an important part of data preparation to rationalize historical data against a given reference point. In this Solution, compute lag values refer to the number of previous periods used by the advanced forecast method to predict the value of the next horizons.
After training, validating, and scoring forecast models, three final data preparation Flow zones flag the date of the last actual value, convert normalized values back into actual values, and prepare data for metric calculations. These three Flow zones are important to shape data into a format suitable to generate visualizations and metrics for the dashboard.
Identifying trends in historical data#
Before training a financial forecasting model, it’s important first to explore your historical data. Doing so allows you to manually identify trends and seasonality of the financial values to be forecasted.
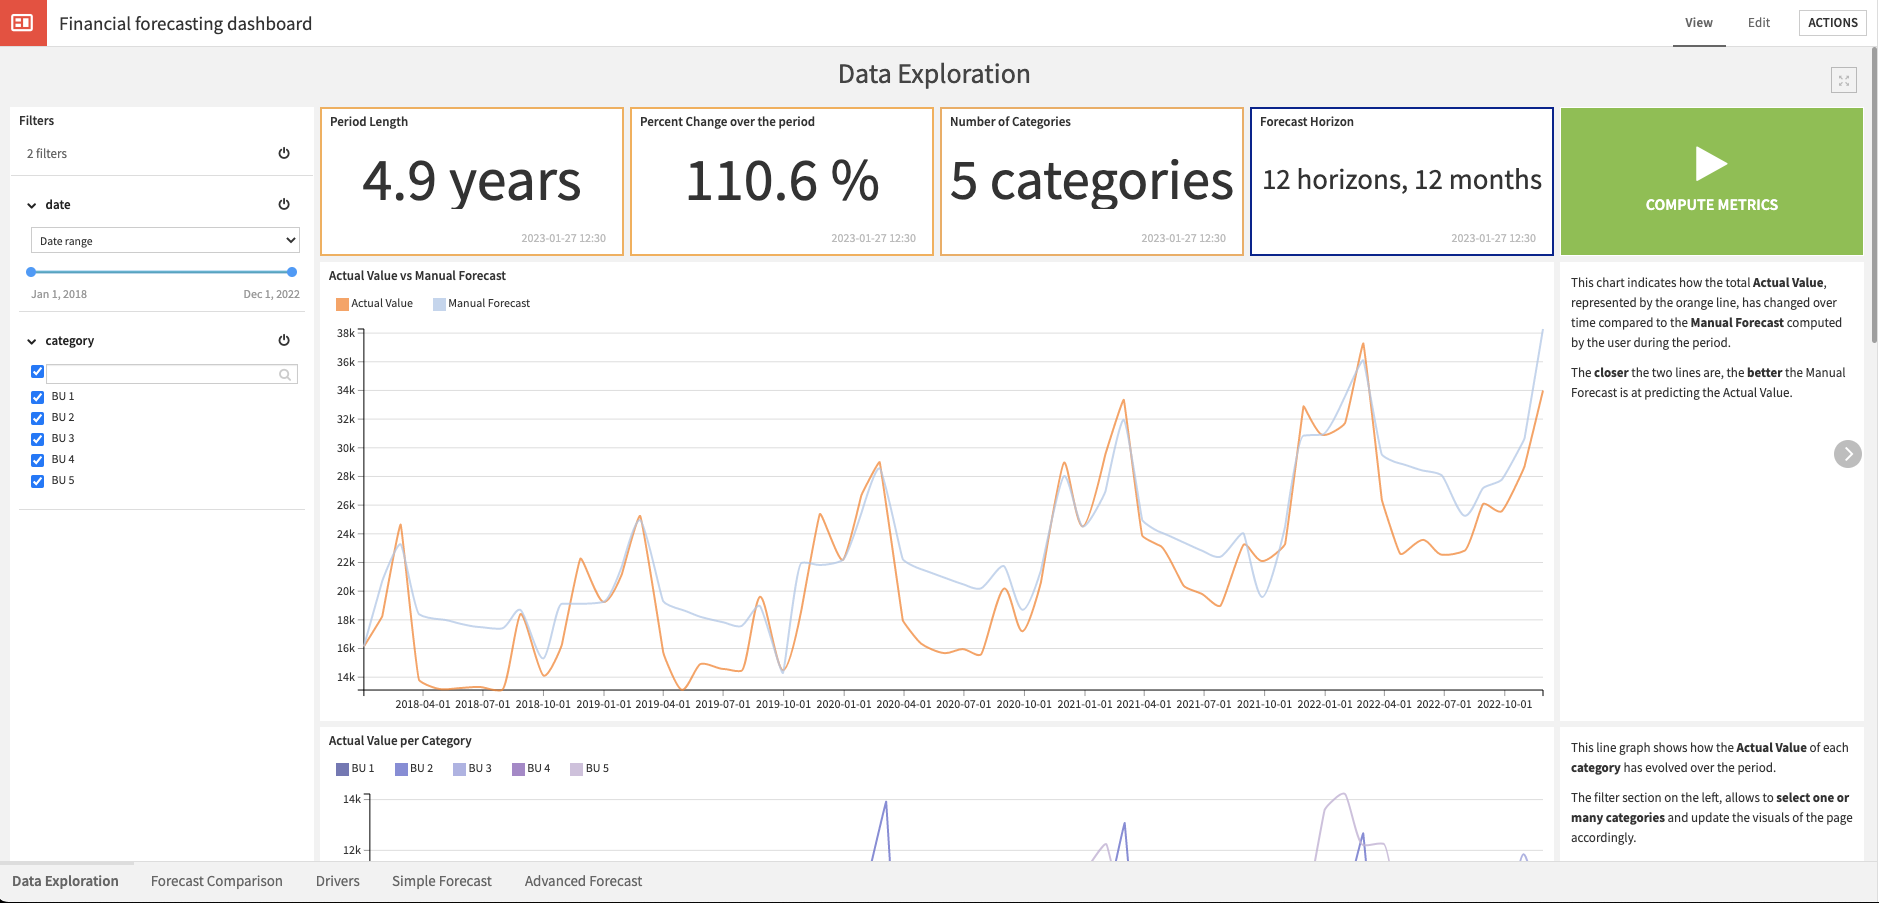
The Exploratory data analysis Flow zone computes all metrics and values needed to generate charts for the Data Exploration page of the dashboard. Here you can zoom in on specific categories, filter data by date range and category, and compare actual values against manual forecast values over time.
Additionally, you can see a breakdown of the actual value by category and the percentage of change in actual values over a period of time. Explanation boxes accompany each graph of this page.
Simple and advanced forecasting#
This Solution creates two distinct forecasts:
The simple forecast uses time series models to forecast future values over the next horizons per category.
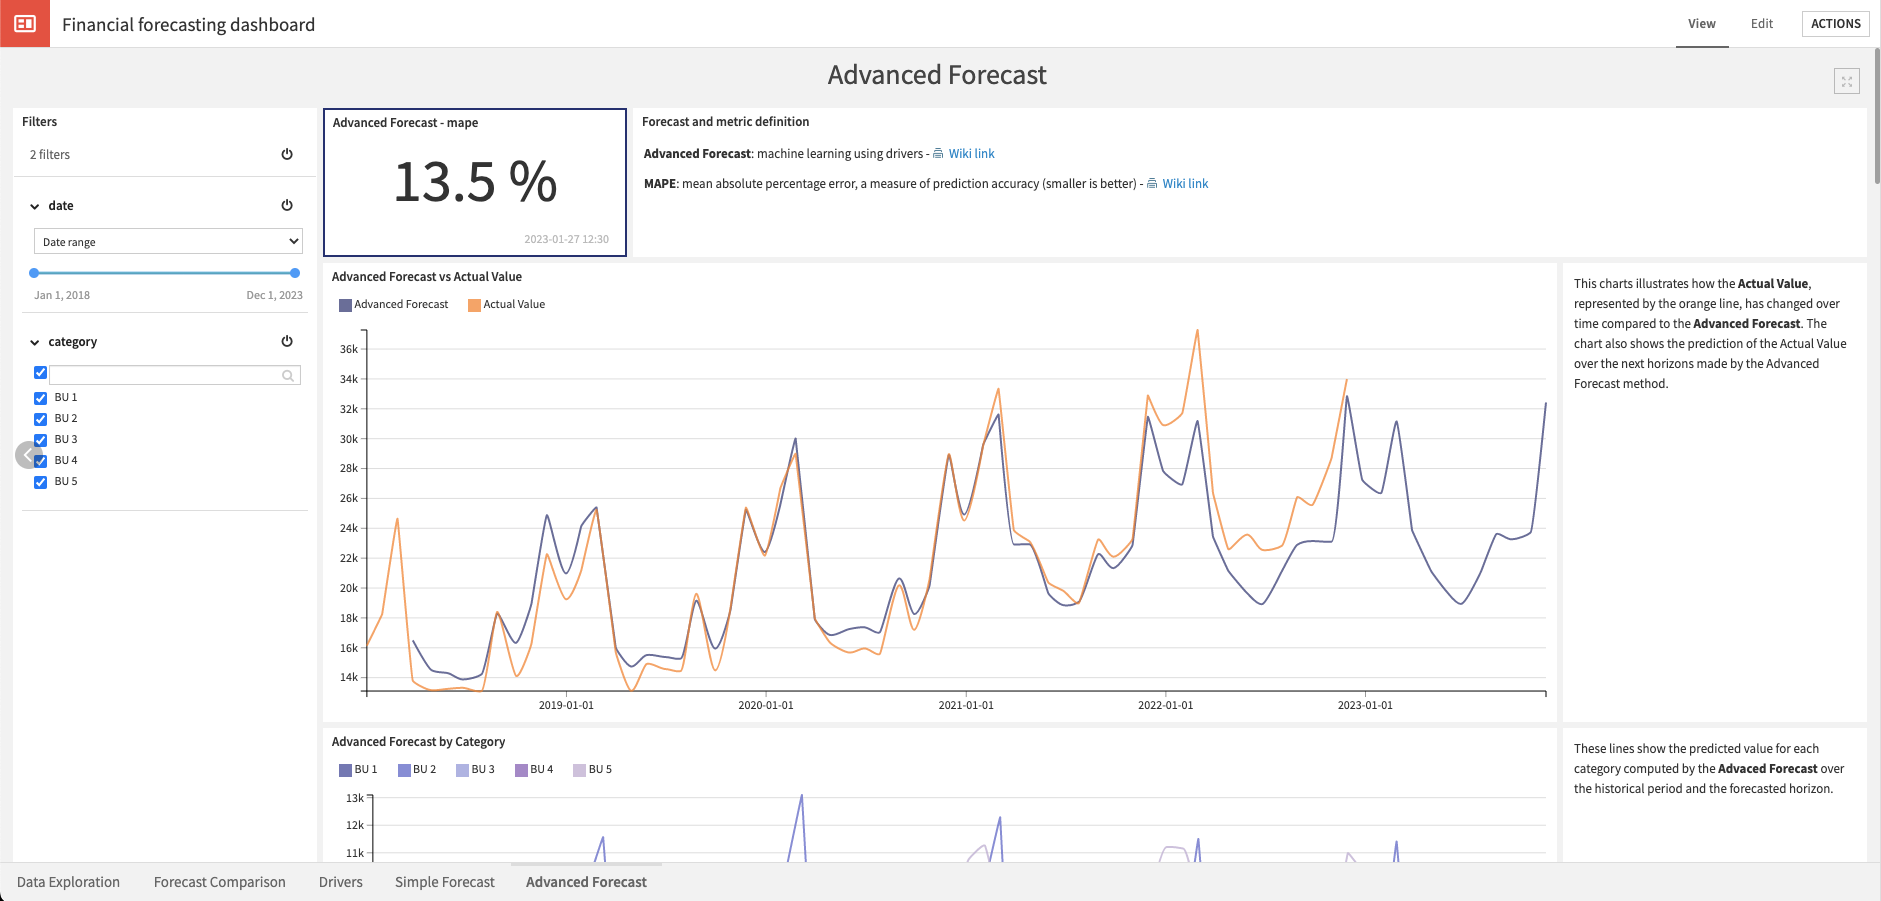
The advanced forecast uses an extra random tree regression model to forecast the next horizons.
The simple forecast creates an ARIMA model for each category using the AutoARIMA functionality in Python to select the best parameters. The creation of this forecast provides an initial approach for financial forecasting. On its own, it can still be a valuable comparison point against manual forecasting in terms of accuracy and time saved for finance teams. Additionally, the forecast and horizon values output by the simple forecast are included as predictors in the advanced forecast.
The advanced forecast uses an extra random tree regression model, which samples a random threshold at which to do the normal splits that occur in a random forest model. If you set lag values and drivers when inputting parameters to the Dataiku app, the advanced forecast will also take these inputs into account when training the model.
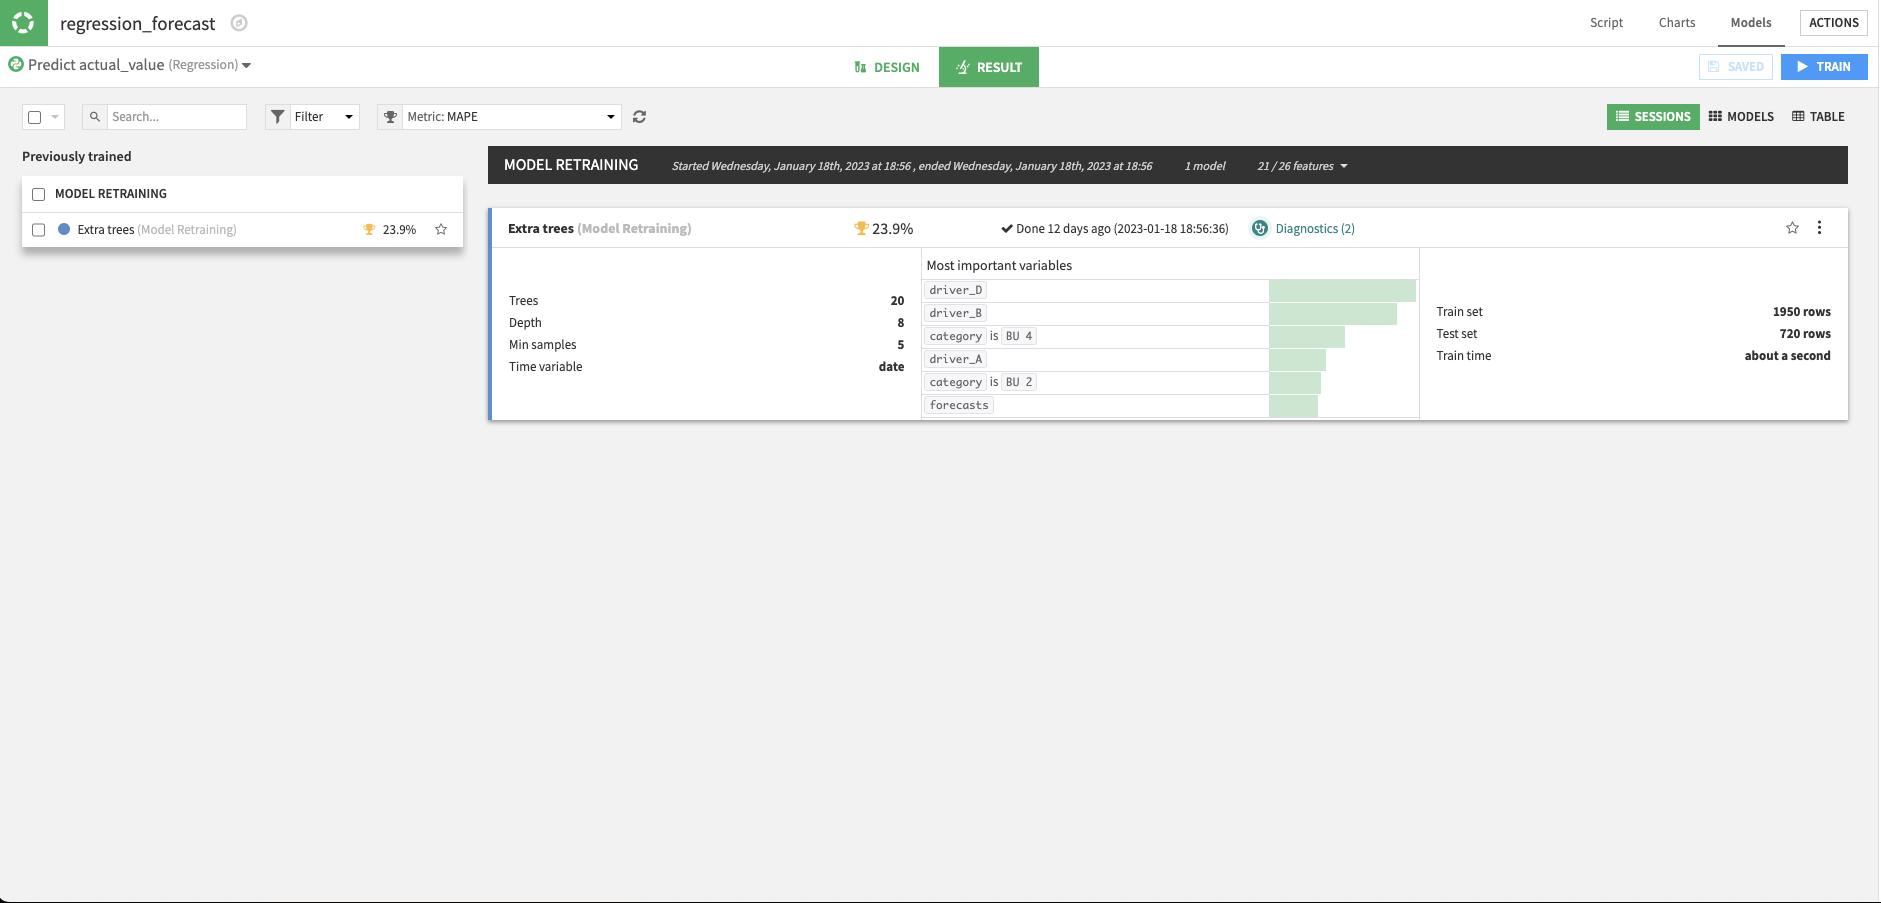
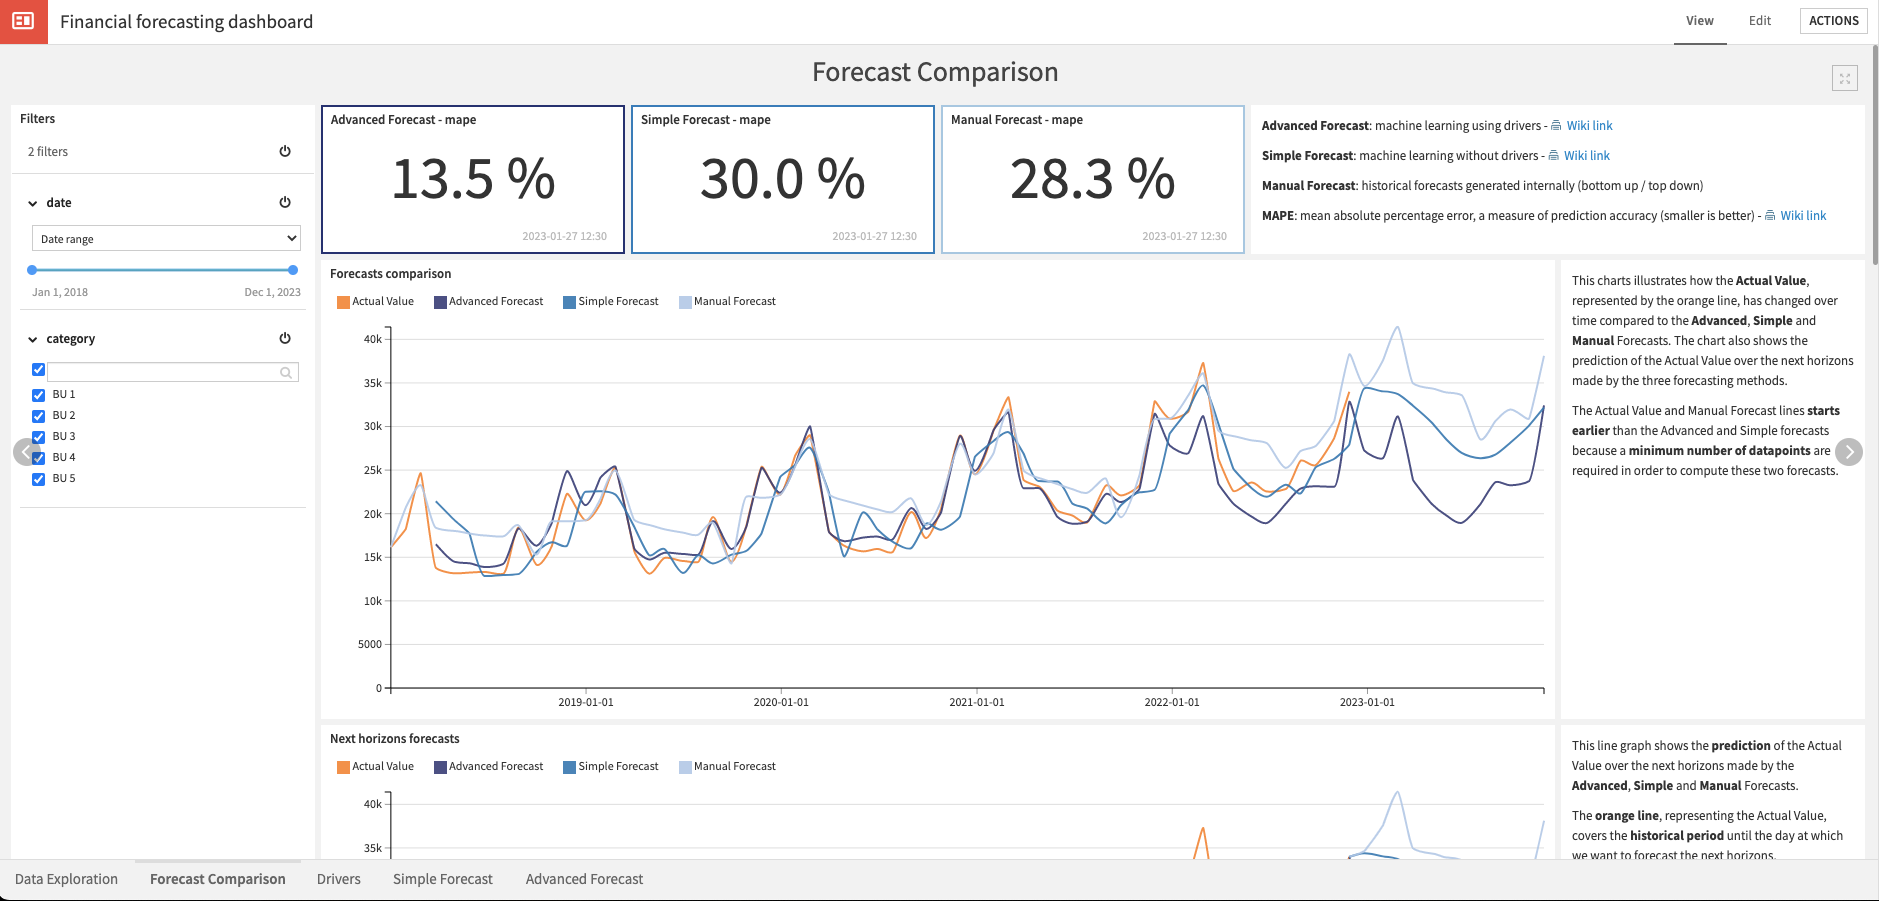
The inevitable question is, which approach is better? In anticipation of this question, this Solution computes the mean absolute percentage error (MAPE) to compare the performance between the forecasting methods (including manual forecast). The lower the MAPE, the better the forecast is. On the data used here, the advanced forecast performed the best, but performance can differ based on your data and additional improvements you may make to the model.
Visualize approach comparisons and drivers#
In the same dashboard as the previously mentioned Data Exploration page, you can find four other pages to support your understanding of the Solution approaches and outputs. Filters are available on every page by date, category, and/or driver.
The Forecast Comparison page presents the results of all forecasting approaches (simple, advanced, and manual). It provides a side-by-side comparison of their MAPE, the alignment to the actual value overall, and by category. You can also analyze the performance of forecasts over different time horizons and gain insights into cumulative errors and average error percentages.
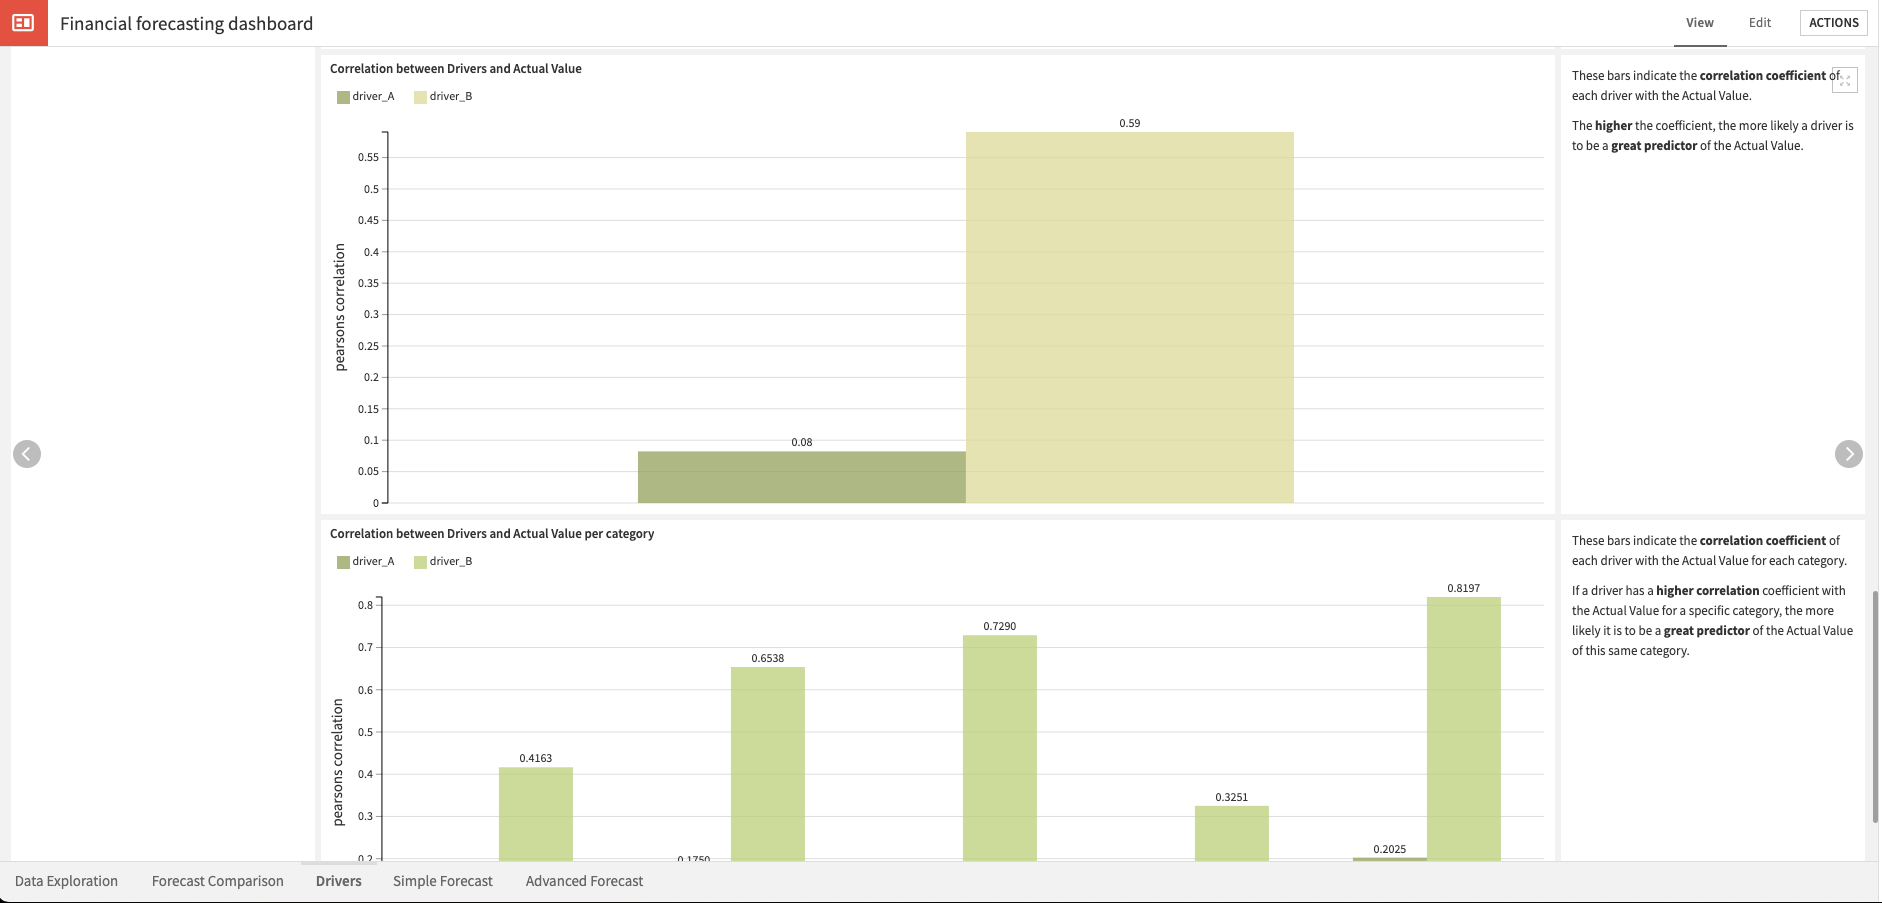
With the Drivers page, you can analyze the relationship between drivers contained in the data (and selected by the Dataiku app) and the actual value. Through this, you can determine which drivers may have a potential positive or negative impact on the advanced forecast. Users interested in running multiple analyses with different drivers can either:
Re-run the Dataiku app with new parameters for each analysis.
Create multiple app instances, each with their own desired set of drivers.
The final two pages Simple Forecast and Advanced Forecast offer isolated metrics and visualizations per approach type regarding their accuracy, as well as information about the models through explainability visualizations.
Responsible AI considerations#
This financial forecasting Solution is intended for use at a business level. You shouldn’t use it to evaluate individual performance. Misuse of this Solution, such as using it to make decisions that may lead to individual potential harm, may result in inaccurate or unreliable forecasts.
Reproducing these processes with minimal effort for your data#
This project equips finance teams to improve accuracy and reduce the required effort for forecasting processes using Dataiku. By creating a singular Solution that can benefit and influence the decisions of various teams in a single organization, you can design smarter and more holistic strategies to transform existing forecasting processes, automate and streamline workflows, and focus on more strategic tasks.
This documentation has provided several suggestions on how to derive value from this Solution. Ultimately however, the “best” approach will depend on your specific needs and data. If you’re interested in adapting this project to the specific goals and needs of your organization, Dataiku offers roll-out and customization services on demand.