
Solution | AML Alerts Triage#
Overview#
Business case#
Anti-money laundering (AML) processes are complex and multifaceted, and generate large numbers of alerts which teams must investigate. Most generated alerts are ultimately not escalated for further review. Reducing the total number of false-positive alerts is a complex and heavily regulated process.
Improvements in AML processes must occur at many points in the chain. A modular Solution that you can incorporate into existing Flows to more efficiently process existing alerts is a means to improve detection rates and reduce alert fatigue, acting as a first step to AML setup efficiency.
This “adapt and apply” Solution supports financial crime analysts in their initial assessments through risk likelihood prioritization. Solution insights also include other elements which analysts can use as a starting point to review the effectiveness of used business rules. This can pave the road to further AML set-up reinforcement.
Installation#
From the Design homepage of a Dataiku instance connected to the internet, click + Dataiku Solutions.
Search for and select AML Alerts Triage.
If needed, change the folder into which the Solution will be installed, and click Install.
Follow the modal to either install the technical prerequisites below or request an admin to do it for you.
Note
Alternatively, download the Solution’s .zip project file, and import it to your Dataiku instance as a new project.
Technical requirements#
To use this Solution, you must meet the following requirements:
Have access to a Dataiku 12.0+* instance.
The downloadable version uses filesystem managed datasets and the built-in Dataiku engine as the only processing engine. You can improve the performance by remapping all connections to Snowflake. In particular, you can optimize daily batch computation time from 2 hours to a few minutes by switching from filesystem managed datasets to Snowflake connections, thereby enabling the use of an in-database SQL engine.
Data requirements#
This example works with a fictional financial services company called Haiku Bank. It uses their data to illustrate the steps to prioritize AML alerts. This project defines alerts at a transaction level. Within the initial alerts datasets, you will find transaction IDs, alert IDs, and the label is_escalated for historical alerts. Additionally, there is a segments input dataset, which represents client categories defined using KYC.
Important
We intend this project to serve as a template to guide development of your own analysis on Dataiku’s platform. You shouldn’t use the results of the model as actionable insights. The data provided with the project may not be representative of actual data in a real life project.
Workflow overview#
You can follow along with the Solution in the Dataiku gallery.
The project has the following high level steps:
Join and prepare the input data.
Train an alert triage model.
Conduct rules based triage in parallel.
Monitor the performance of the model over time.
Enable compliance teams to understand the models they use via interactive Model Explainability in a pre-built Dashboard.
Automate the full pipeline to react to score new alerts, monitor model performance over time, and retrain the model with new data.
Walkthrough#
Note
In addition to reading this document, it’s recommended to read the wiki of the project before beginning to get a deeper technical understanding of how this Solution was created and more detailed explanations of Solution-specific vocabulary.
Gather input data and prepare for training#
The first two Flow zones of the project are straightforward.
The Input Flow zone brings in six initial datasets:
alerts_history is combined with new_alerts via a Stack recipe. All alerts in the new_alerts dataset are obviously missing values for the is_escalated column since they haven’t yet been classified.
Similarly, transactions_history and new_transactions are stacked together. New transactions correspond to the last day’s transactions, but both datasets share the same schema.
This zone also combines client information (accounts) with segments representing KYC created client categories.
This project includes scenarios that you can configure to trigger based on changes to these initial datasets. Additional work is needed to update the project to connect to updating datasets. Within the first Flow zone, some additional data preparation handles email addresses, IP addresses, and home addresses.
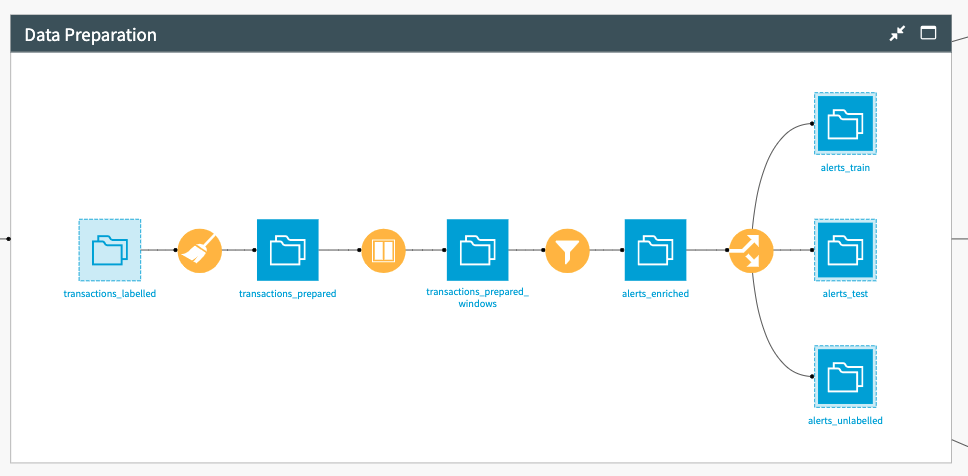
Next, the Data Preparation Flow zone sequentially processes the data to create some additional features for the model’s feature engineering. A first Prepare recipe creates the age of the customer. Then, a Window recipe creates all major features that will be important for the model. The data is additionally filtered to keep only alerts before being split into three datasets:
Dataset |
Description |
|---|---|
alerts_train |
Contains the bulk of the data. |
alerts_test |
Contains the last 4 weeks of data (the split is done automatically via a project variable set by the scenario Evaluate Model). |
alerts_unlabelled |
Contains the unlabeled alerts from the last day. |
Training an alert triage model#
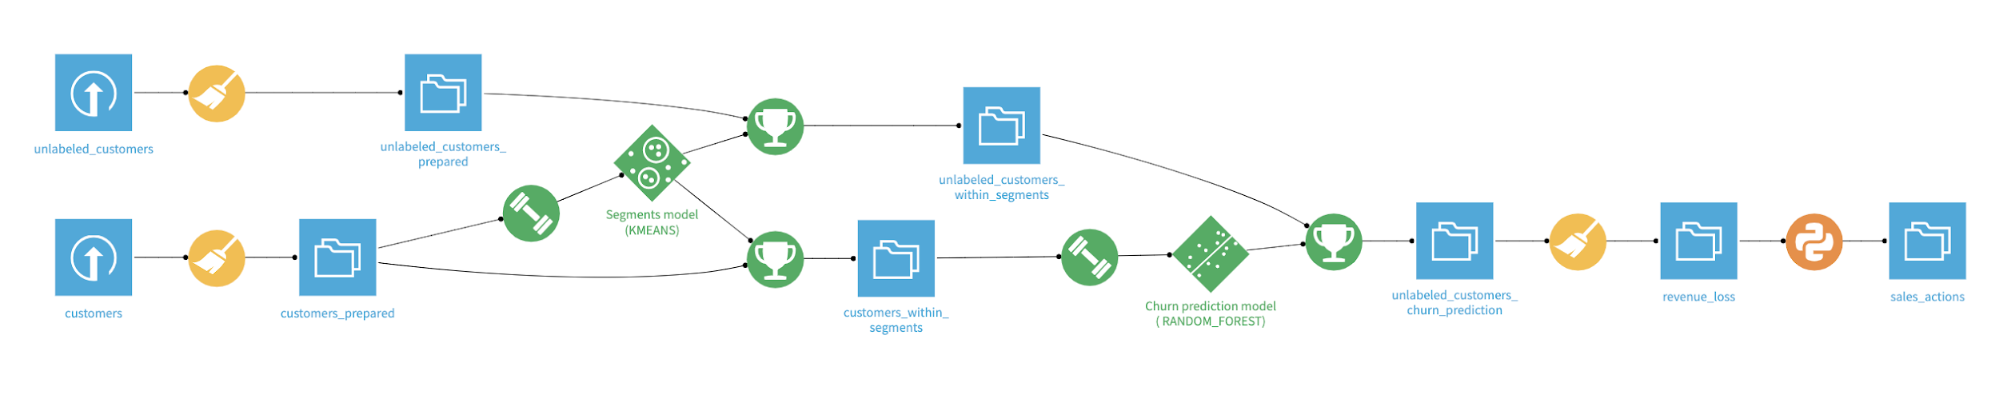
The Alert Triage Flow zone takes as an input two datasets: alerts_train and alerts_unlabelled. It trains a two-class classification model that predicts the previously mentioned is_escalated variable.
The dataset is imbalanced with around 4% of 1 and the remaining of 0. It uses class weights as a weighting strategy. The model includes all variables that make sense. It processes them in a standard way (dummy encoded for categories and normalized for numerical variables).
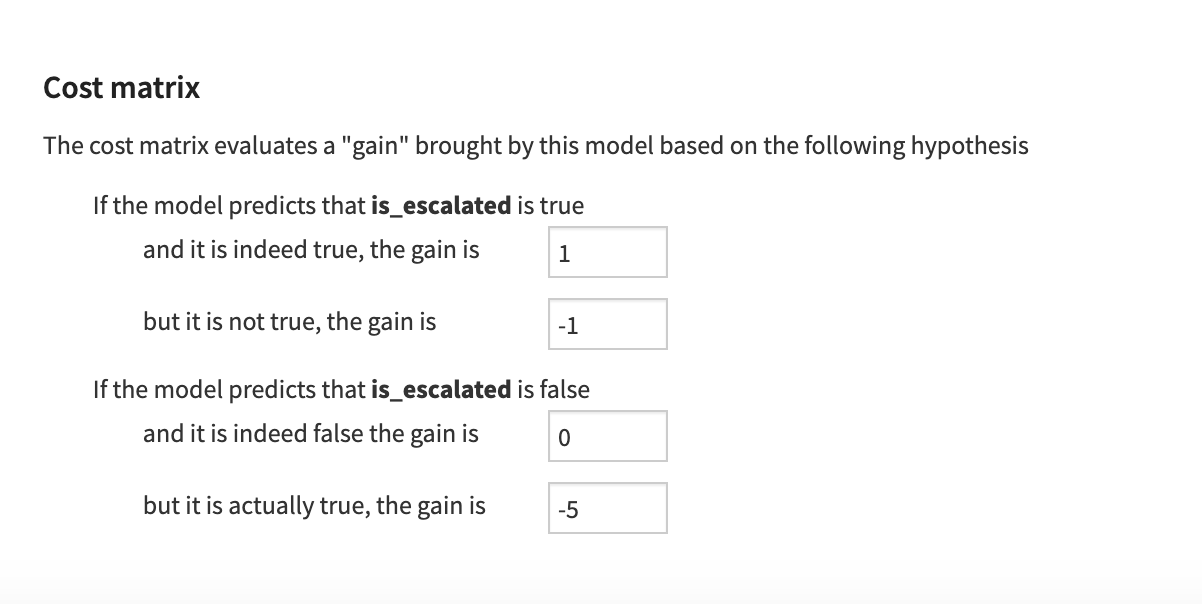
The design part of the model chooses a custom cost matrix function to optimize the threshold. Thus, false negatives are heavily weighted. True positive and false positive have the same weight, but with opposite signs. Therefore, the user can input how important each of the metrics is within the parametrization of the model.
We ultimately selected the XGBoost algorithm because it shares the same performance as the random forest algorithm while being lighter. Looking at the variable importance of the model, orig_is_escalated_avg is the most important variable, which makes sense because past escalated alerts influence the escalation of new alerts.
The deployed model is then used to score the new alerts. The main output from this scoring is the proba_1 column, which you can interpret as a priority. Compliance officers would first investigate the high priority alerts before processing the ones further down the list. Thus, the scored alerts are sorted by priority and represent the output of the project that will be used elsewhere.
Using a rules-based approach for alerts triage#
In parallel to the machine learning model for alert triaging, the Solution also generates some rules-based priority scores for new alerts in the Rules Based Triage Flow zone. There are two parallel branches in this Flow zone. In the first branch, a Prepare recipe uses a predefined formula on the transactions_unlabelled dataset. The full dataset is then sorted based on the resulting priority score to place alerts with the highest priority score first.
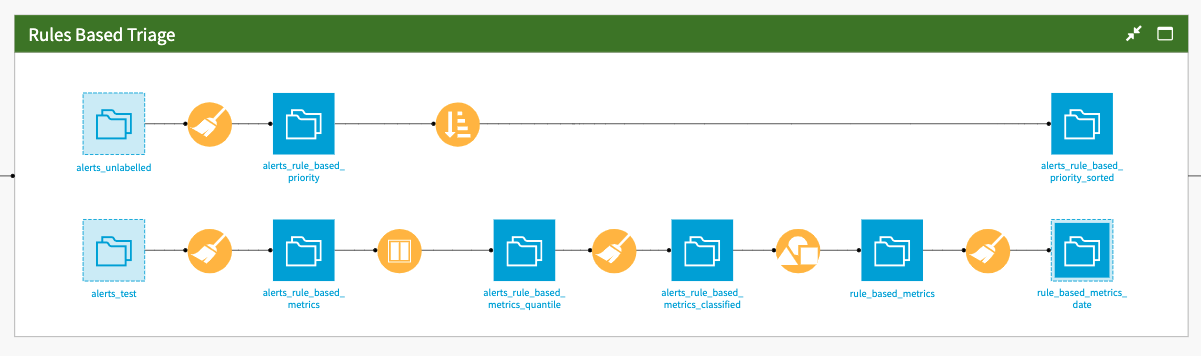
The second branch once again uses the same predefined formula in a Prepare recipe on the alerts_test dataset to evaluate the performance of this rule. It then compares it to the machine learning model. As the Solution uses a Prepare recipe and not a visual ML model to prioritize alerts, we can’t use the Evaluate recipe to compute metrics. Instead, the Solution applies the same rule as for the unlabeled alerts for the test alerts and computes the needed aggregates using the Group recipe. Finally, the Solution computes the false positive and false negative rates before appending results each time a new evaluation is executed.
Long term model performance#
The Solution ends with the Model Drift Flow zone where the model’s performance over time is monitored. It ensure neither the model nor the data has drifted too much. Using the alerts_test dataset, it computes the performance metrics of the model on data made of the last four weeks of alerts and hasn’t been used in the model training.
As time goes by, the model will become more and more outdated with regards to the updated test data. It uses an Evaluate recipe to compute all the standard metrics to evaluate the performance of a binary classification model. A Prepare recipe removes unnecessary metrics and creates the ones that are most relevant to the business, namely the false positive rate and the false negative rate. The two subsequent recipes pick the oldest and the most recent evaluations and then computes the difference between them for each of these values.
It also compares the performance metrics from the rules-based prioritization with the ML-based prioritization. You can create a trigger on the output of the model drift performance to retrain the model when it has drifted too much.
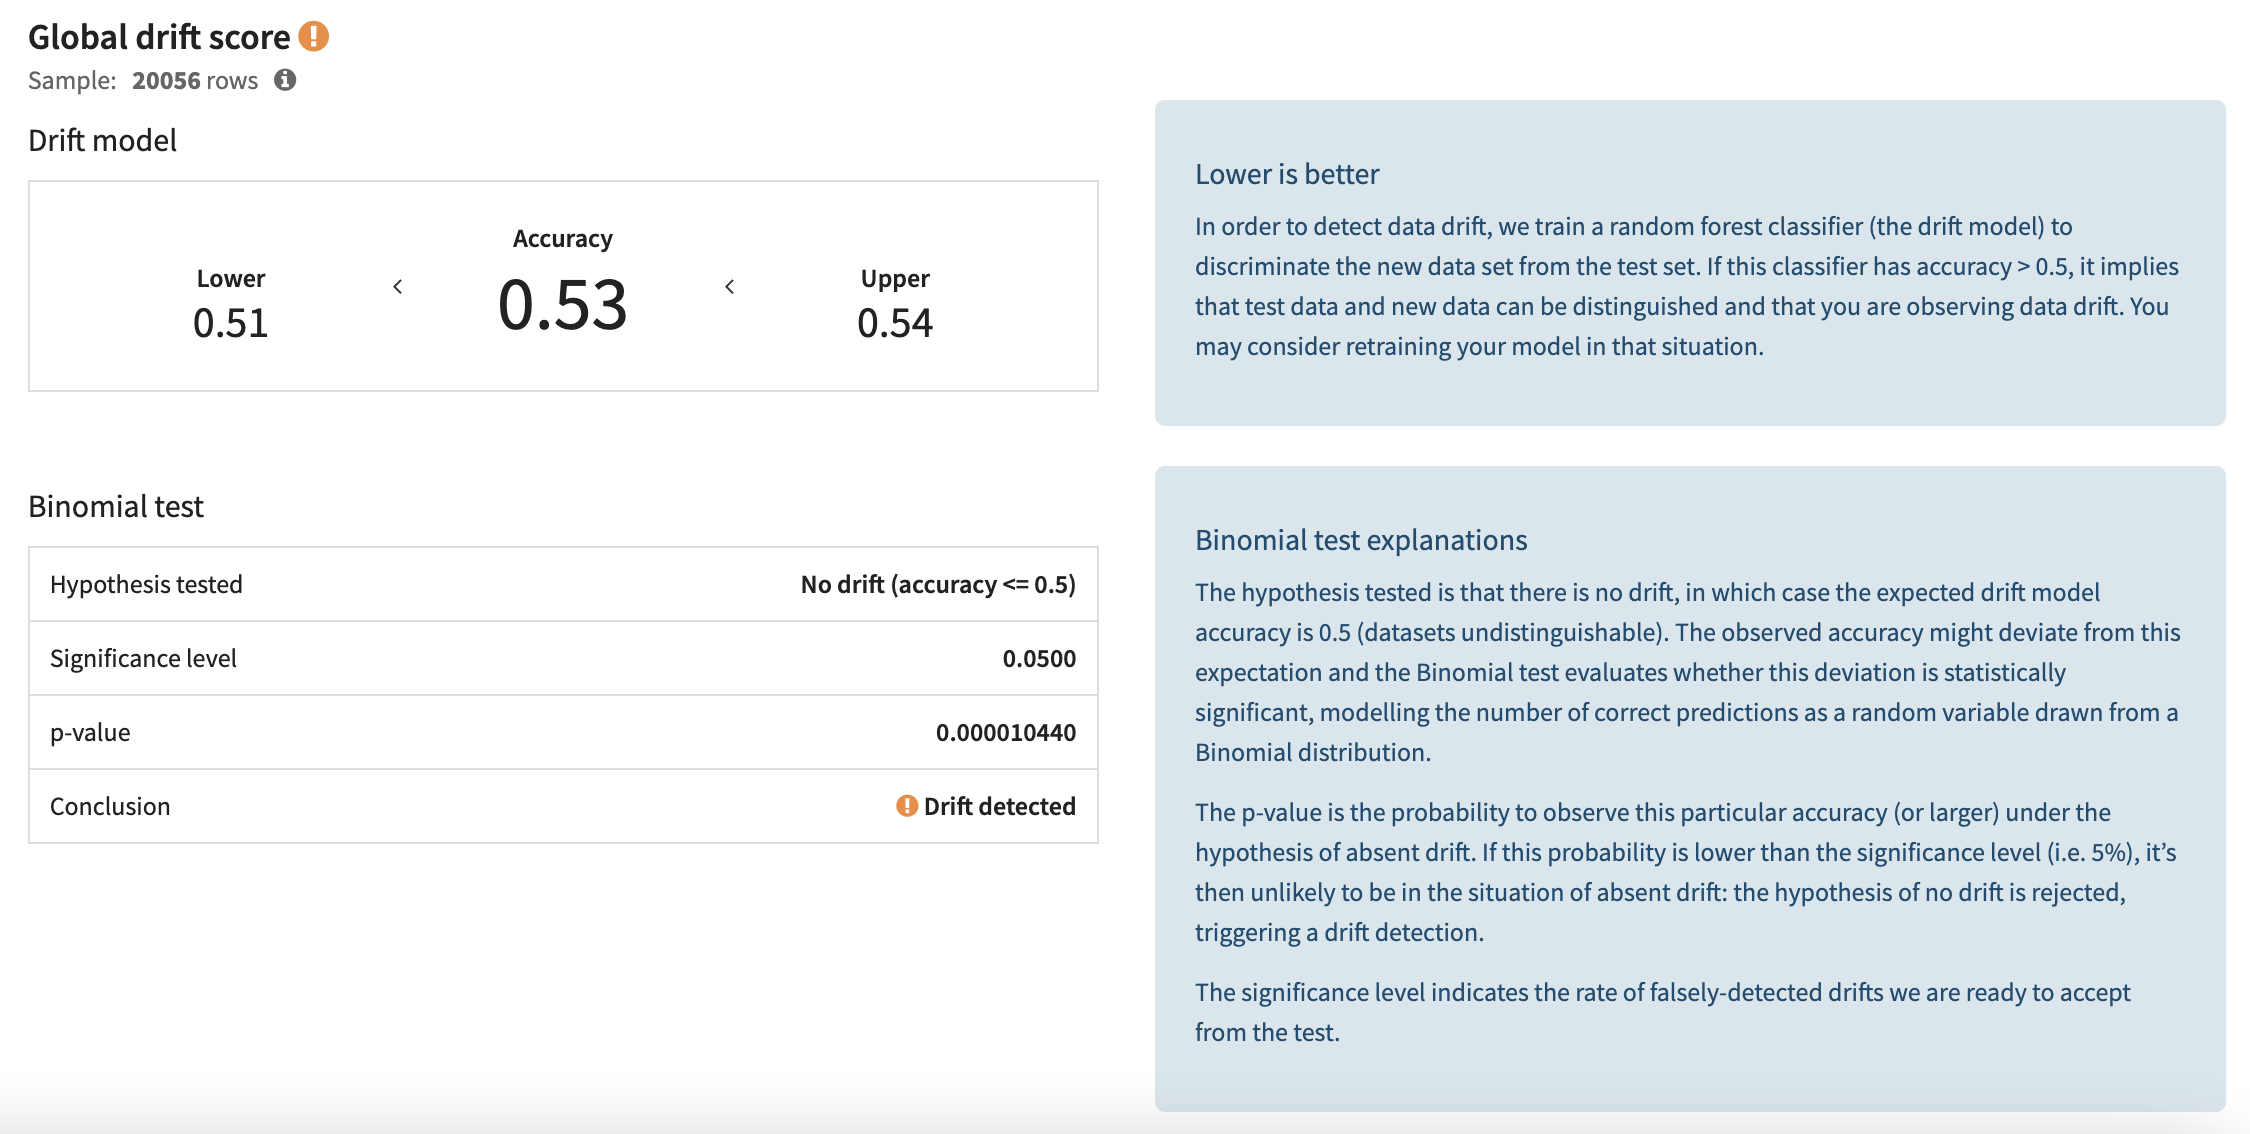
The upper part of the Flow zone also conducts data drift analysis. First, the alerts_validation dataset is created in the same way as in the model. The Solution then leverages the Evaluate recipe from the model evaluation store. It computes the data drift between the validation dataset used for the training at the moment when the model was deployed and the most recent validation dataset.
At the first iteration, there is no data drift because the two datasets are identical. Then as data drifts over time, the drift model accuracy increases, meaning that it’s getting easier to discriminate between the two datasets. When the drift exceeds 0.5, the user should start worrying about the drift and consider training again with fresher data.
Enable compliance teams with pre-built explainability dashboards#
A key component of the AML process is the ability of compliance teams to understand precisely how the models they’re using behave and ensure the models won’t break under certain conditions. The pre-built project dashboard includes several components that you can use to investigate the trained model.
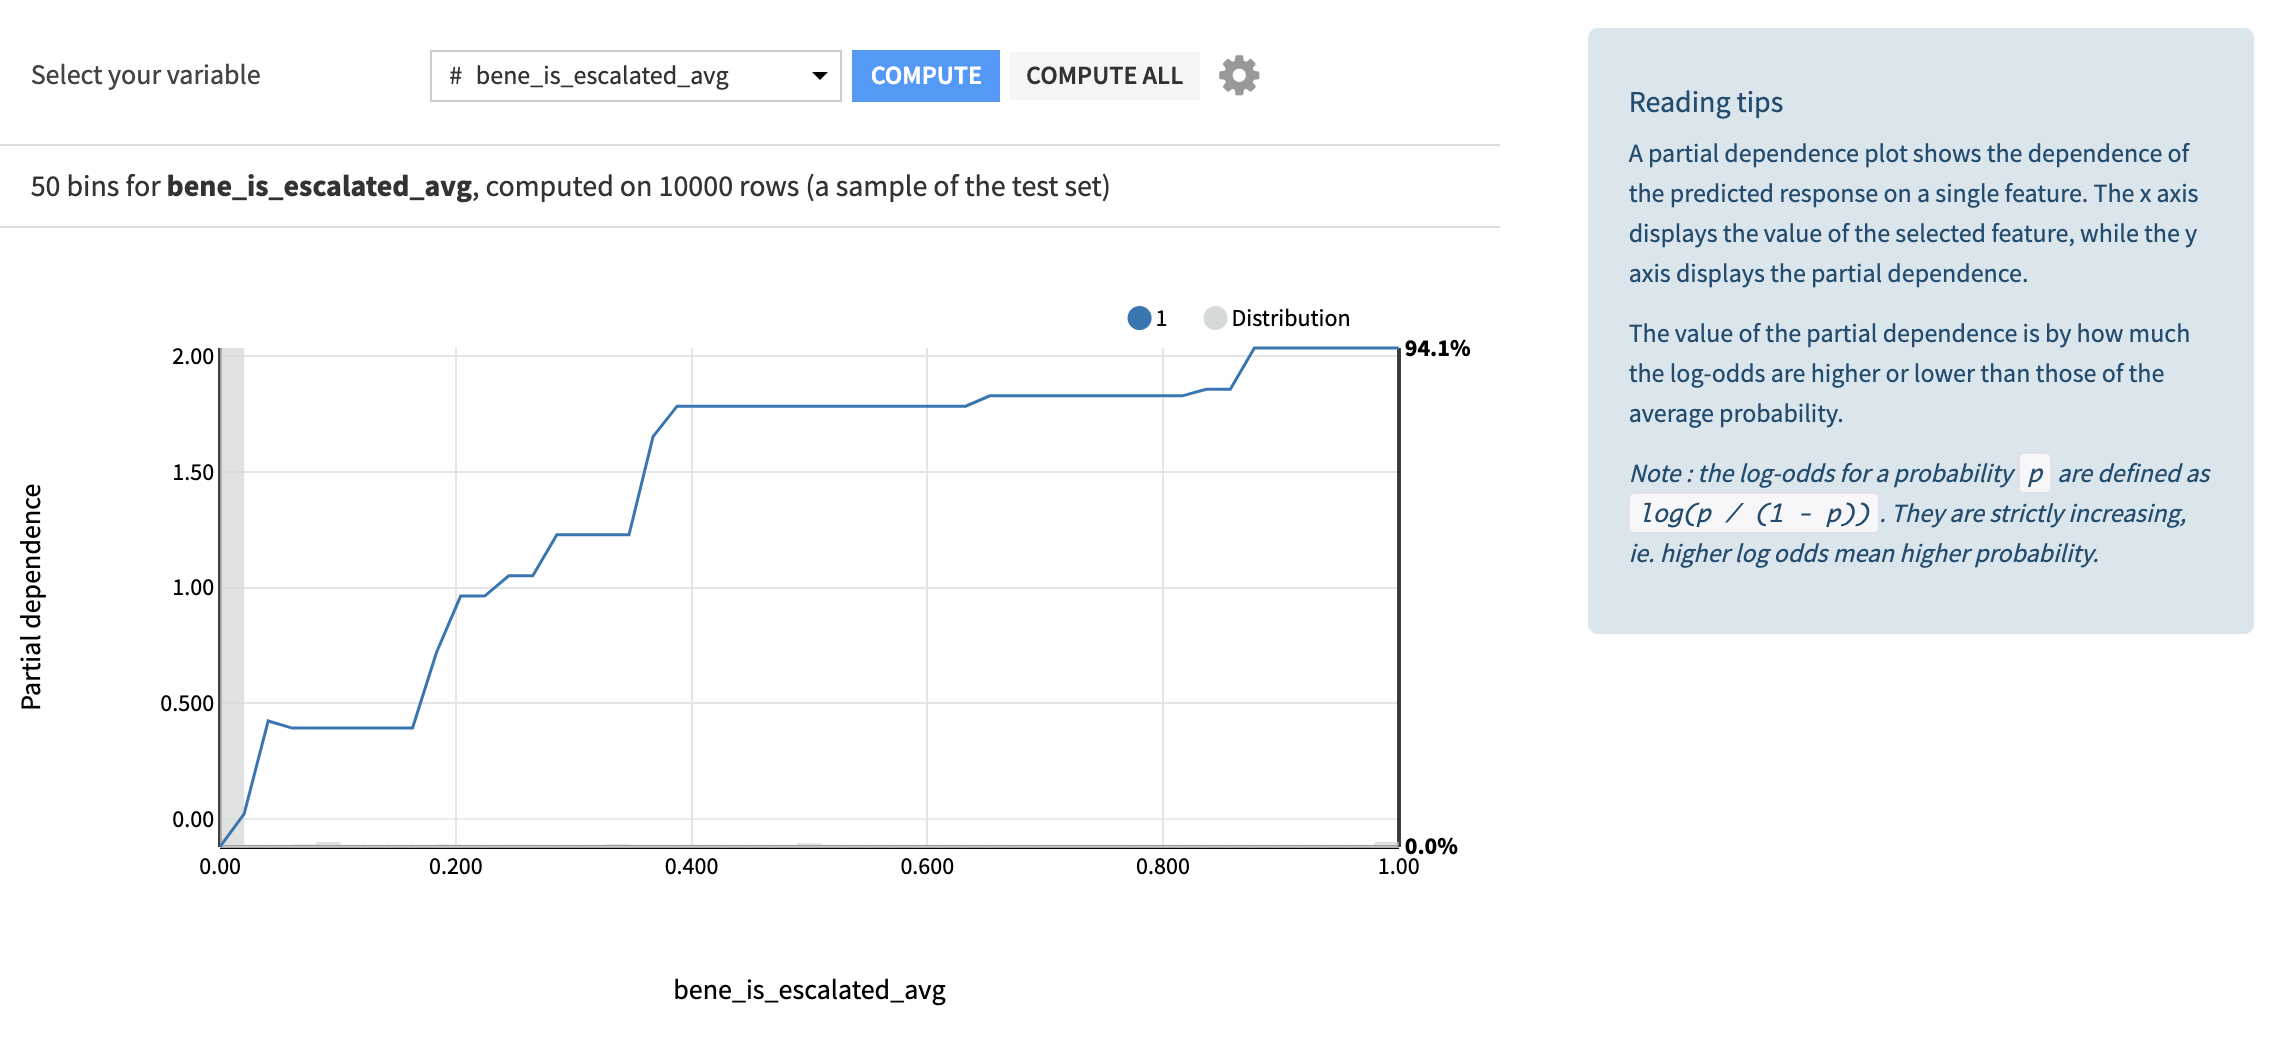
In the Global Explanation tab of the dashboard, you can analyze the model via feature importance analysis and partial dependence plots. Surprising results in the importance or dependence values for certain variables warrants further investigation into the model. Enabling compliance teams to have access to these graphs allows them to use their invaluable knowledge to additionally evaluate model performance.
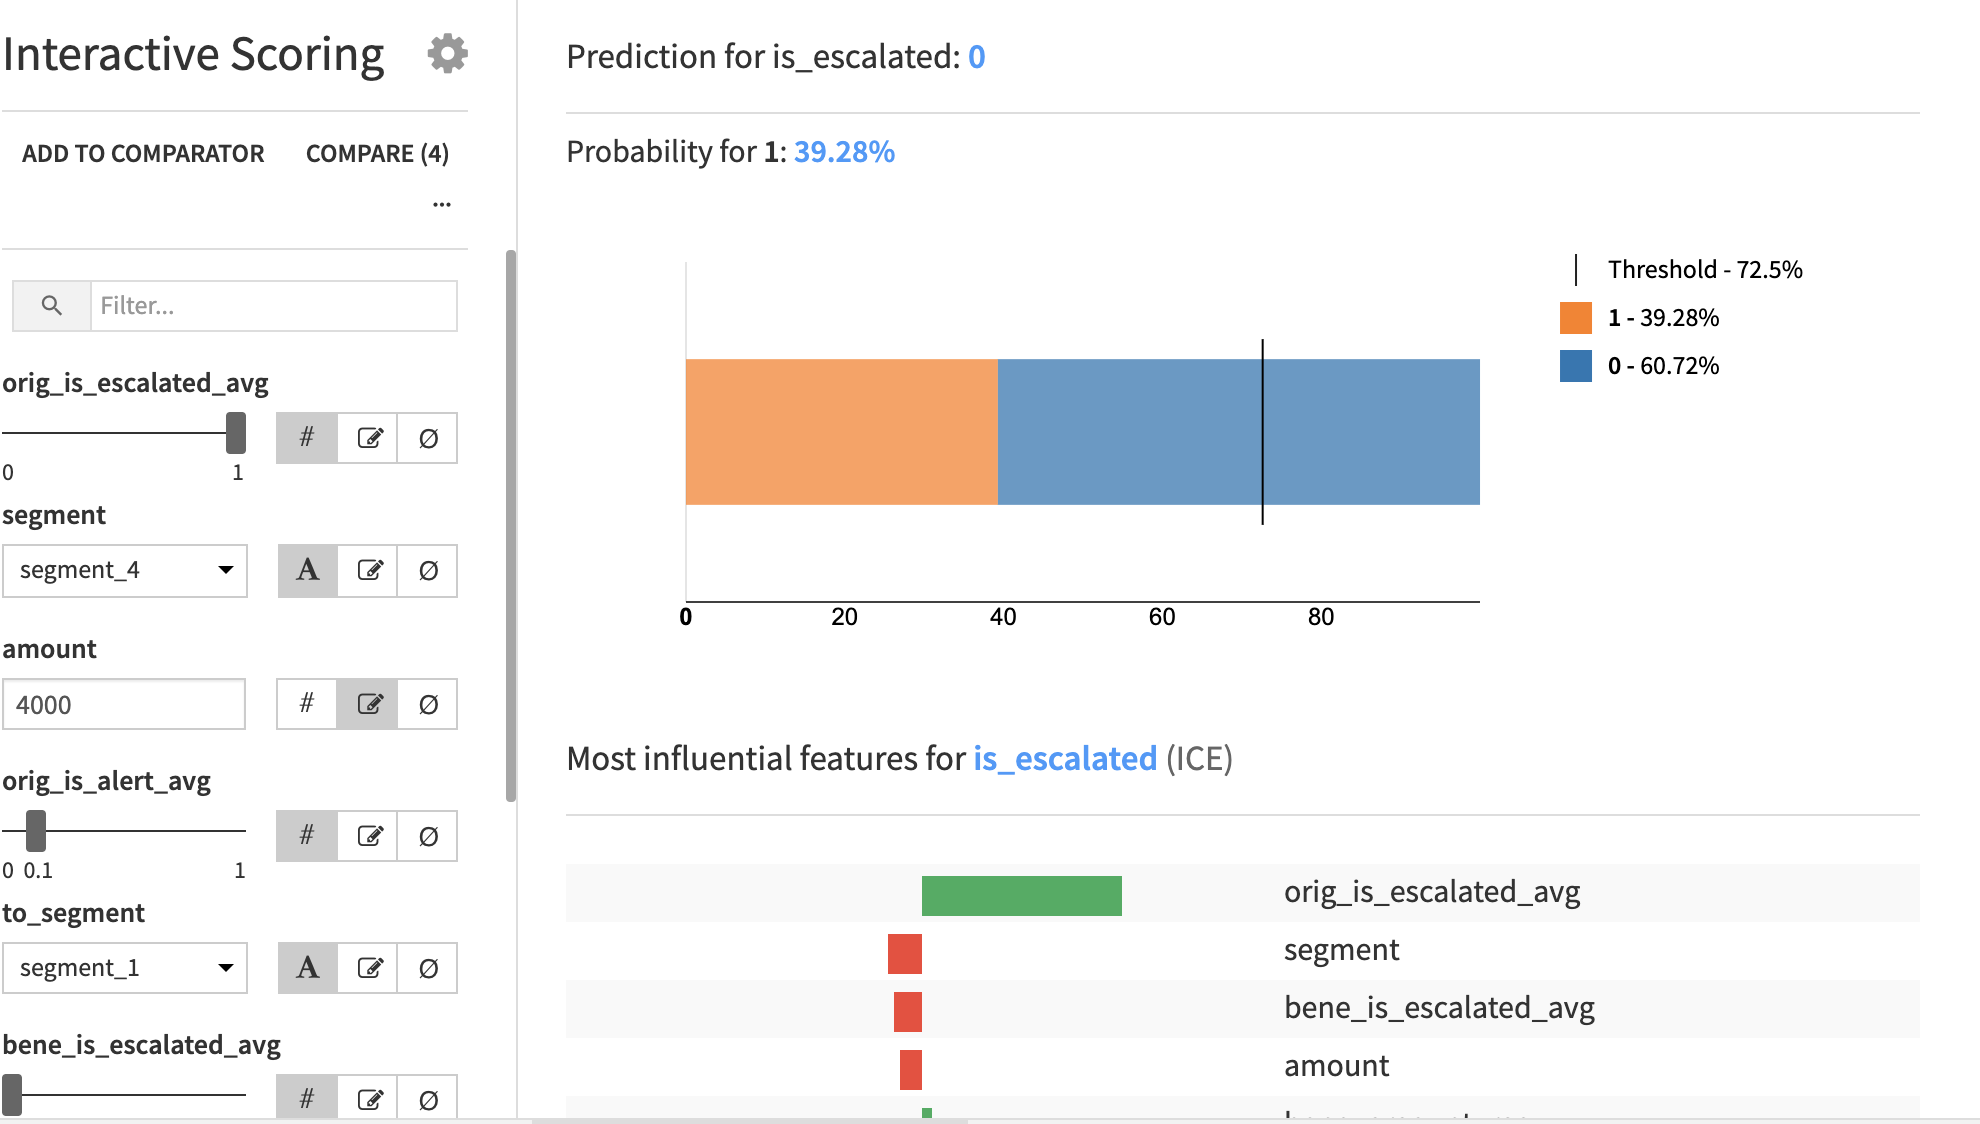
The Individual Explanations tab allows you to dig a bit deeper on the model performance. Users of the dashboard can interactively change model features and see the output from the model. Additionally, users can see how changes to the model feature values impact probability and influential features. A final view in this dashboard focuses on how to use individual explanations to detect patterns in how the top and bottom predictions have been made.
As previously mentioned, model and data drift should be continuously monitored. You can do this using auto-trigger scenarios for re-training, the Drift tab of the dashboard (where the model is evaluated each time new data comes in through the Model Evaluation Store), and the results view of the saved model.
Reproducing these processes with minimal effort for your data#
This project equips compliance teams to supplement their existing AML processes by prioritizing alerts with Dataiku. By creating a singular Solution that can benefit and influence the decisions of a variety of teams in a single organization, you can design smarter and more holistic strategies to prioritize investigations, avoid additional regulatory burden, and provide insights for reviewing business rules.
This documentation has provided several suggestions on how to derive value from this Solution. Ultimately however, the “best” approach will depend on your specific needs and data. If you’re interested in adapting this project to the specific goals and needs of your organization, Dataiku offers roll-out and customization services on demand.