
Solution | Pharmacovigilance#
Overview#
Business case#
The efficiency of post-market drug safety surveillance functions plays a critical role in reinforcing patient safety and ensuring successful drug launches. Compliance with safety reporting and surveillance requirements (Good Pharmacovigilance Practice) is a mandatory regulatory obligation. Failure to appropriately report, detect, and address adverse drug reactions can result in patient harm, drug recalls, and significant costs.
As the volume/velocity/variety of safety reporting data grows, it’s becoming essential for global safety teams at drug manufacturers, health outcomes research institutions, and regulatory bodies alike to adopt new analytics-driven approaches that can be automated at scale to improve early signal detection and reliability in the pharmacovigilance process.
This plug-and-play Solution aims to provide a ready-to-use interface to accelerate the discovery of potential adverse drug reaction (ADR) signals. It uses statistical metrics to generate disproportionality metrics on drugs and adverse events paired across various populations.
Installation#
From the Design homepage of a Dataiku instance connected to the internet, click + Dataiku Solutions.
Search for and select Pharmacovigilance.
If needed, change the folder into which the Solution will be installed, and click Install.
Follow the modal to either install the technical prerequisites below or request an admin to do it for you.
Note
Alternatively, download the Solution’s .zip project file, and import it to your Dataiku instance as a new project.
Technical requirements#
To use this Solution, you must meet the following requirements:
Have access to a Dataiku 13.3+ instance with a built-in Python3 environment (or create a Python3 code env).
To benefit natively from all the Dataiku app automation, you will need to reconfigure one of the following connections:
PostgreSQL
Snowflake
Data requirements#
Two managed folders contain the inputs of this Solution. Such folders are helpful for storing data structures unsupported by Dataiku standard Flow objects.
Managed folder |
Description |
|---|---|
Product Drug Names |
Contains the Product.txt file which is imported by default from Orange Book. It contains a list of drugs and pharmaceuticals that the U.S. Food and Drug Administration (FDA) has approved as both safe and effective. |
Input Files |
Requires (at least) 5 datasets as .txt files to be imported from FDA Adverse Event Reporting System (FAERS). These five datasets contain adverse vent reports, medication error reports, and product quality complaints resulting in adverse events that were submitted to the FDA. |
Workflow overview#
You can follow along with the Solution in the Dataiku gallery.
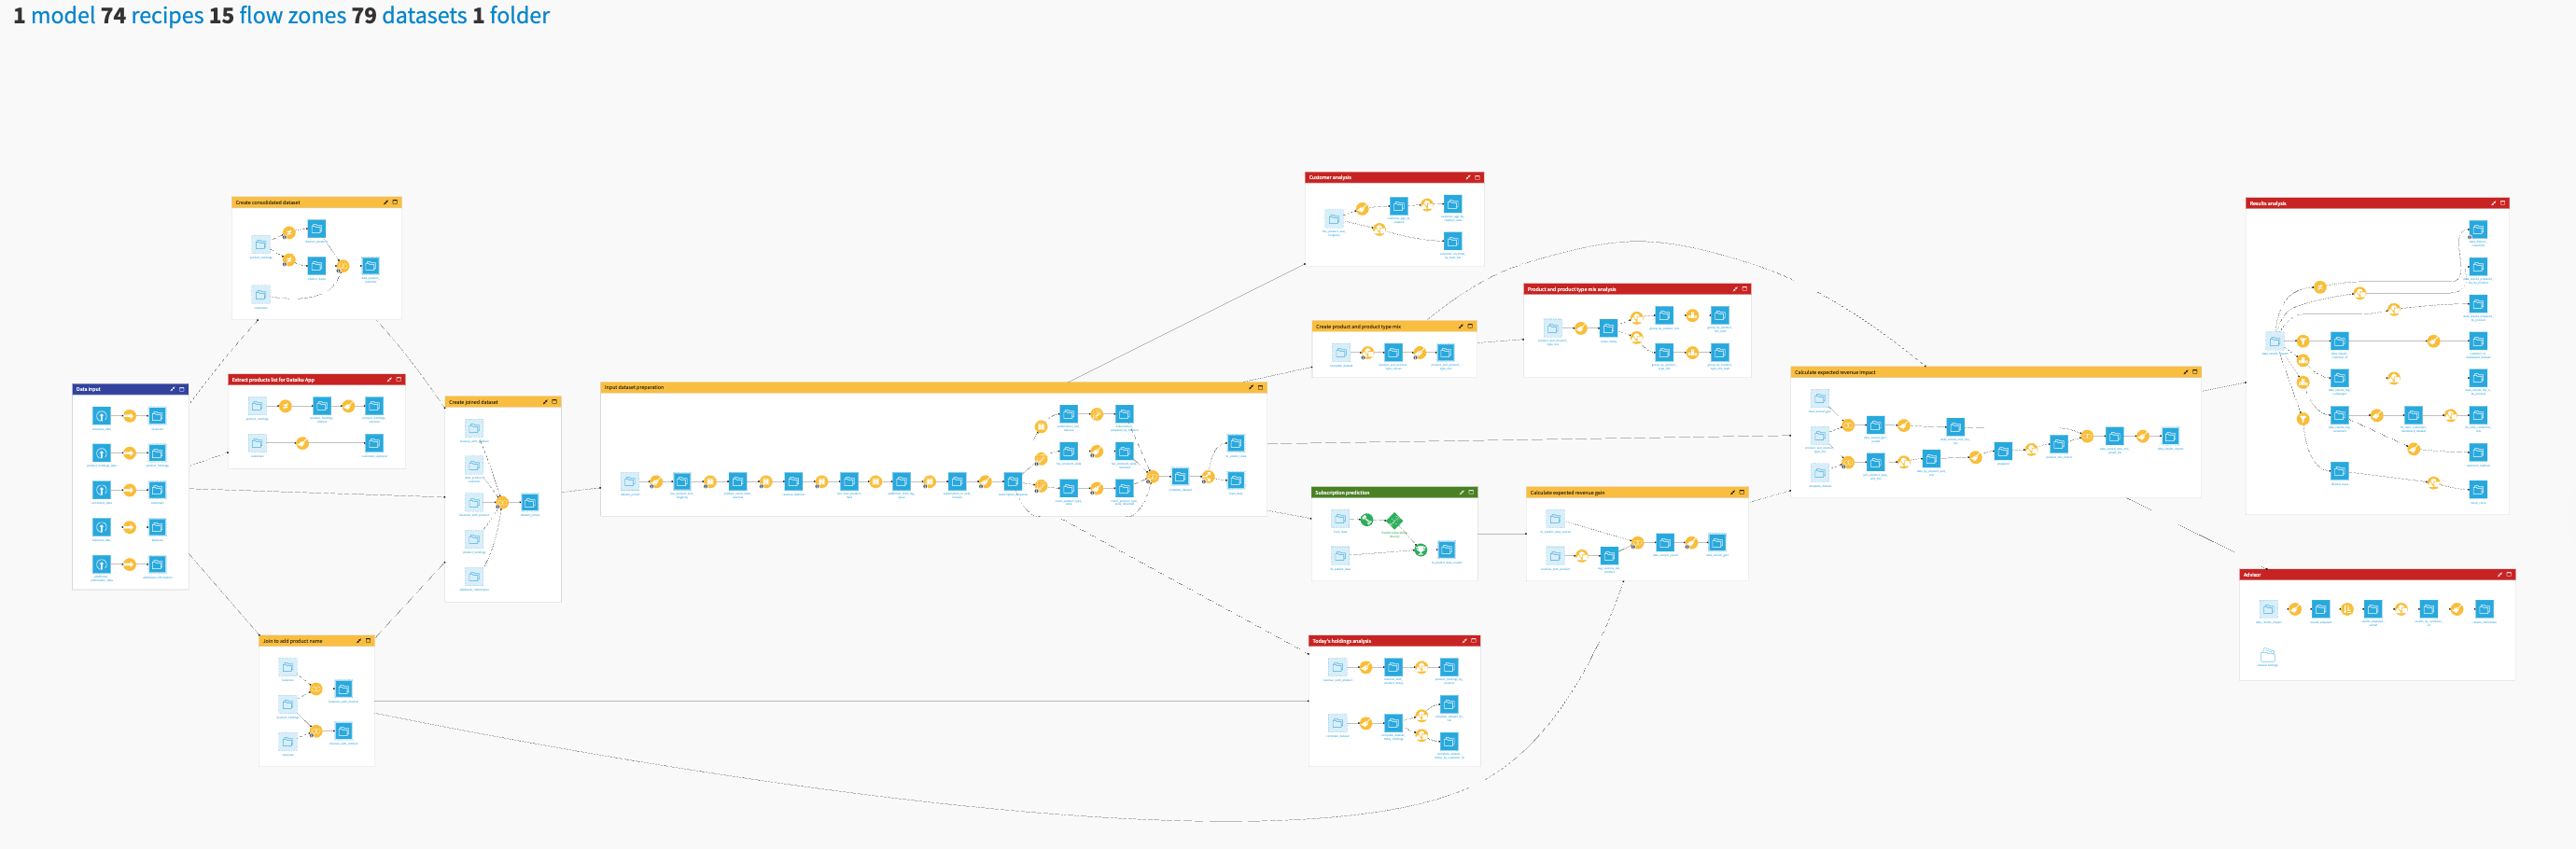
The project has the following high-level steps:
Ingest data files.
Process the data, detect duplicate reports, and filter on demographic, drug, reaction, and report characteristics.
Identify and visualize patterns in safety data.
Calculate metrics for statistical inference and signal detection.
Analyze new insights with a Dataiku app.
Increase regulatory compliance with early detection of potential ADR signals.
Walkthrough#
Note
In addition to reading this document, it’s recommended to read the wiki of the project before beginning to get a deeper technical understanding of how this Solution was created and more detailed explanations of Solution-specific vocabulary.
Plug and play FAERS quarterly data files#
You can upload the aforementioned input files to the Solution either directly into the managed folders or via the Dataiku app interface. Following upload, you can reconfigure the connections of the Flow and select to anonymize the manufacturer and drug names for confidentiality reasons. The Input Files Flow zone applies two Python recipes to the initial managed folders:
Python recipe |
Description |
|---|---|
compute_FDA_products |
Parses FDA standard drug name .txt file to a data frame and export a dataset object. |
Faers_data_ingestion |
Parses and accesses ASCII (.txt) files and converts them to data frames. The process includes file name checks to a pre-specified regex condition and further mapping of column codes to standard terms. |
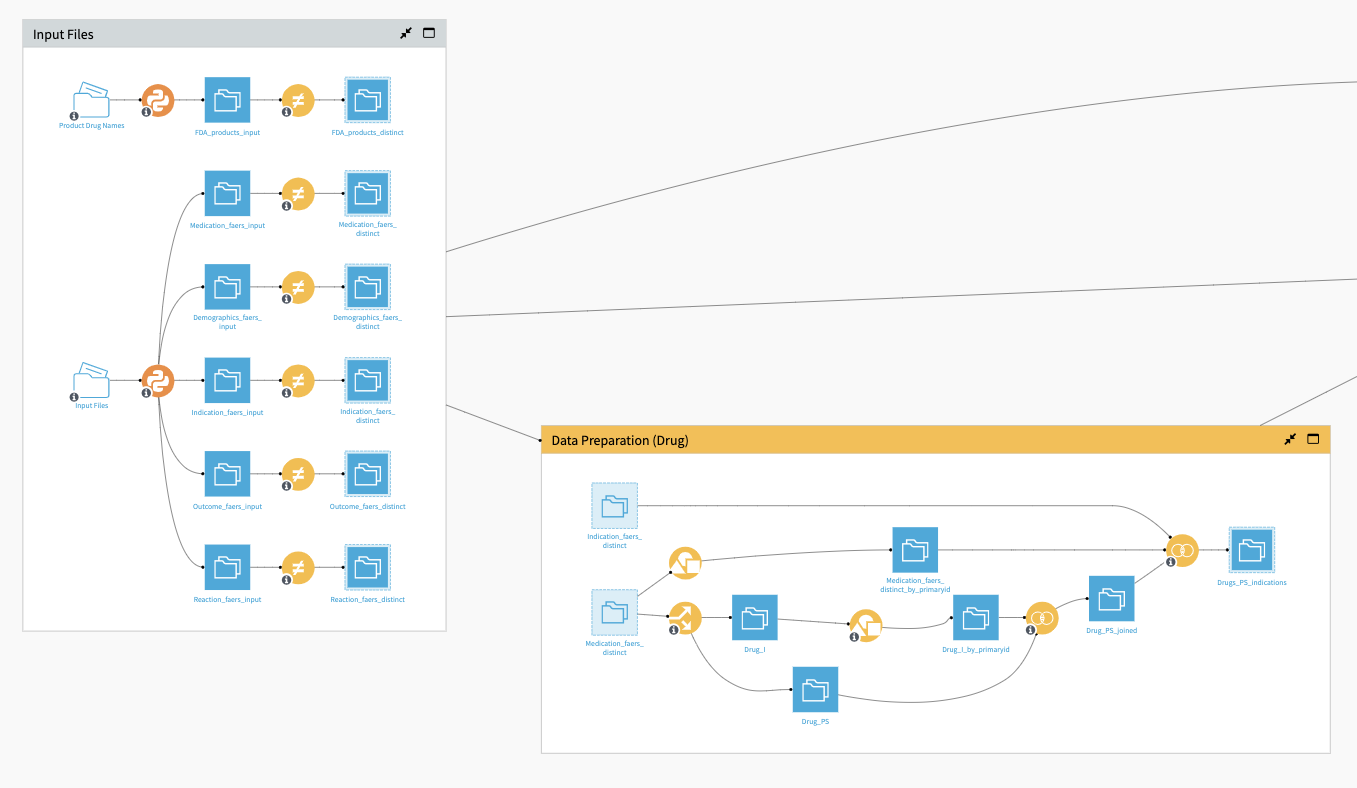
In this Flow zone, visual Distinct recipes are also used to keep the values necessary for running the remainder of the Flow and generating statistical analyses.
The Data Preparation (Drug) Flow zone extracts information from drug interactions and joins it with the indication dataset using visual Split, Group, and Join recipes.
Once you have imported and cleaned the initial data, you’re ready to begin aggregating the data.
Setting the data for visual insights#
The Data Standardization (Drug) Flow zone takes as input the previously prepared dataset of drug interactions joined with indications and a dataset of FDA product names. The Flow joins these two datasets together, and uses the FDA drug name to standardize any misspellings in the FAERS data.
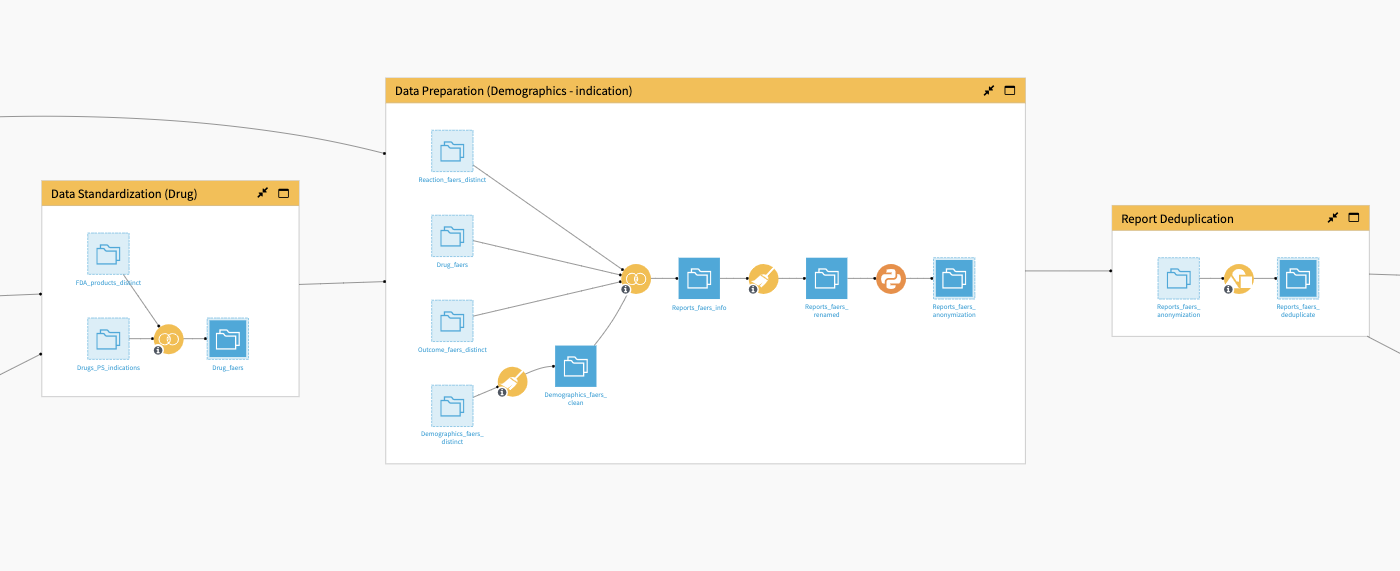
Moving along to the Data Preparation (Demographics) dataset, the Flow takes the FAERS’ reaction, outcome, and demographics datasets and the joined drug name dataset from the previous Flow zone as inputs. A visual Prepare recipe applied to the demographic data cleans age, country, and date features.
The Flow then joins this to the other three datasets and computes a feature to represent the seriousness of an event based on outcome codes. Additional recipes calculate metrics on the number of adverse events and anonymizes the manufacturer and drug name (if selected in the Dataiku app).
The database contains information provided voluntarily by healthcare professionals, consumers, lawyers, and manufacturers. Accordingly, duplicates are a common mistake. Hence, multiple parties per event may duplicate adverse event reports. These reports may be more likely to contain incorrect information if submitted by a non-medical professional. Report Deduplication updates column names and removes any record duplication.
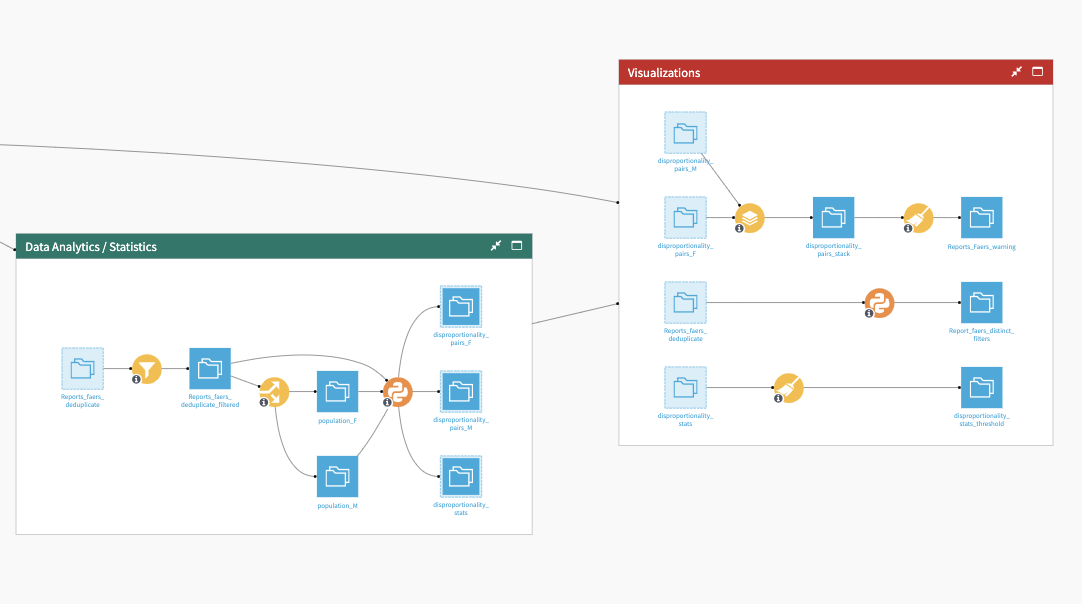
The Data Analytics/Statistics Flow zone filters data using user-specific variables and splits the entire dataset into cohort subpopulations. A Python script generates final statistics used in the dashboard. This script:
Applies pre-filtering on adverse event frequency.
Computes the measure of disproportionality statistics for each drug and adverse event pair
Outputs individual dataset objects used for further comparison and signal detection.
The Visualizations Flow zone brings the three output datasets from the previous Flow zone, along with the output from Report Deduplication. This Flow zone processes the output datasets to generate warnings about potential drug adverse event signals and visual insights. Final datasets generate a number of graphs published in the Pharmacovigilance analytics dashboard.
Explore general trends from data analysis#
The project’s dashboard provides insights into general trends in the data. There are both Descriptive Analytics and Statistical Analysis insights available in the Pharmacovigilance analytics dashboard to support decision-making. The first two tabs are dedicated to Descriptive Analytics:
Tab |
Description |
|---|---|
Metrics |
Shows the number of records after data preprocessing, top values for drugs, adverse events, and manufacturers. After importing the Solution, all metrics in this tab will show errors. This is the intended behavior. You can resolve it by clicking the Run Now button and refreshing the dashboard once the scenario is complete. |
Safety Report Analytics |
Delivers visualizations of safety report trends by gender, age, seriousness, outcome, and reporters. You can use filters to focus on specific column values from the visualized datasets. 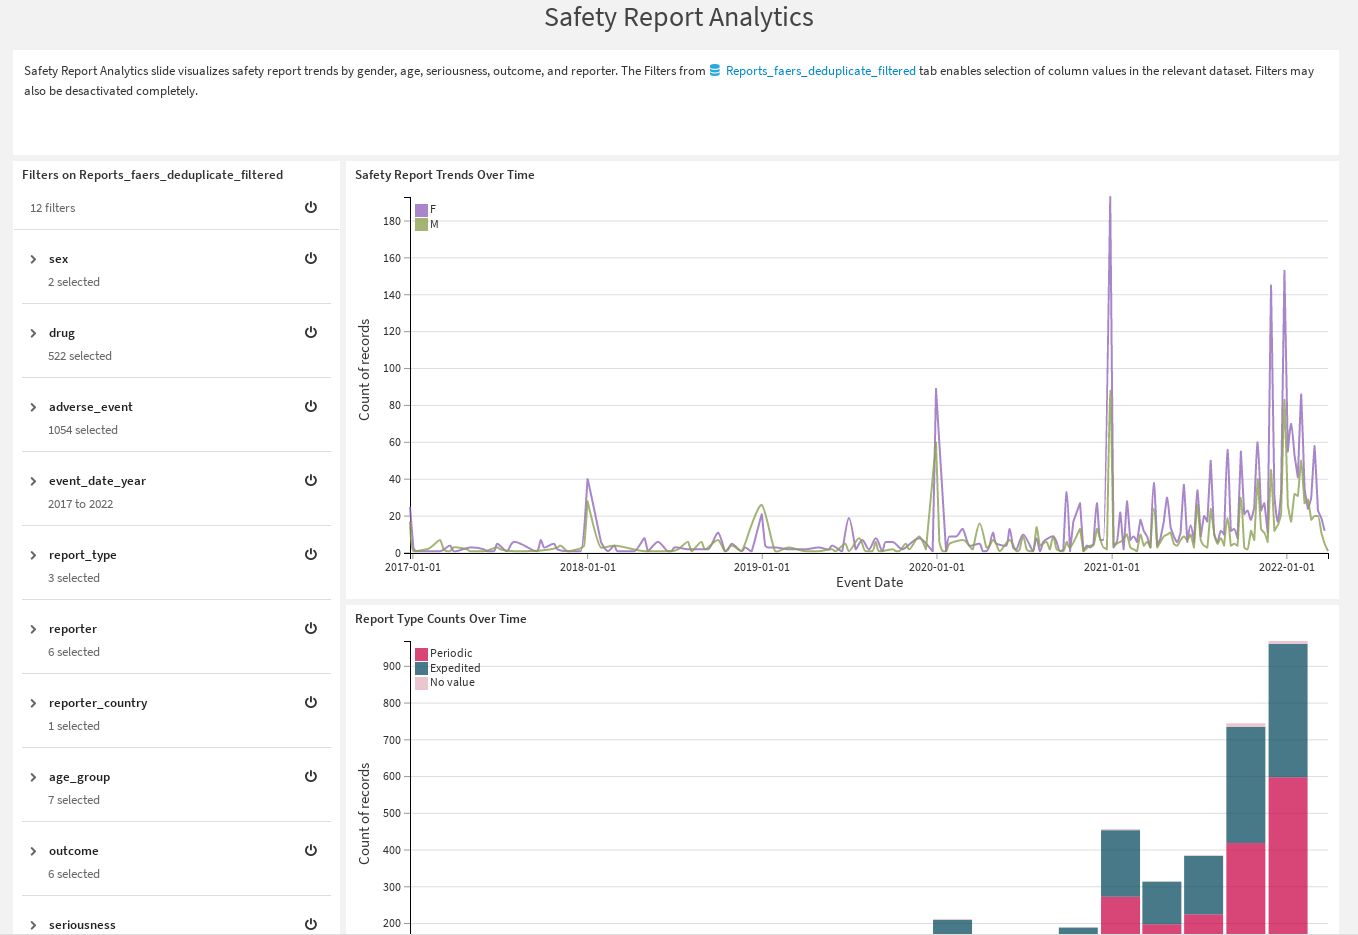
|
The Statistical analysis includes three different tabs:
Tab |
Description |
|---|---|
Disproportionality Analysis |
Analyzes potential warnings between drugs and adverse events through various disproportionality metrics (for example, Proportional Reporting Ration, Reporting Odd Ratio, etc.). You can use dashboard filters to modify this analysis. |
DPA by Gender |
Enables individual analysis of subpopulations in the data for comparative study. Top events and drugs measured for each gender reveal potential warnings for each group. Other metrics such as seriousness and age provide more levels of granularity for detecting populations that are likely at risk from different medications. |
Safety Report Signals |
Show potential warnings between all the preselected drug x adverse event pairs. Warnings are determined based on the threshold set on the 95% lower confidence interval of the Reporting Odd Ratio and Proportional Reporting Ratio. 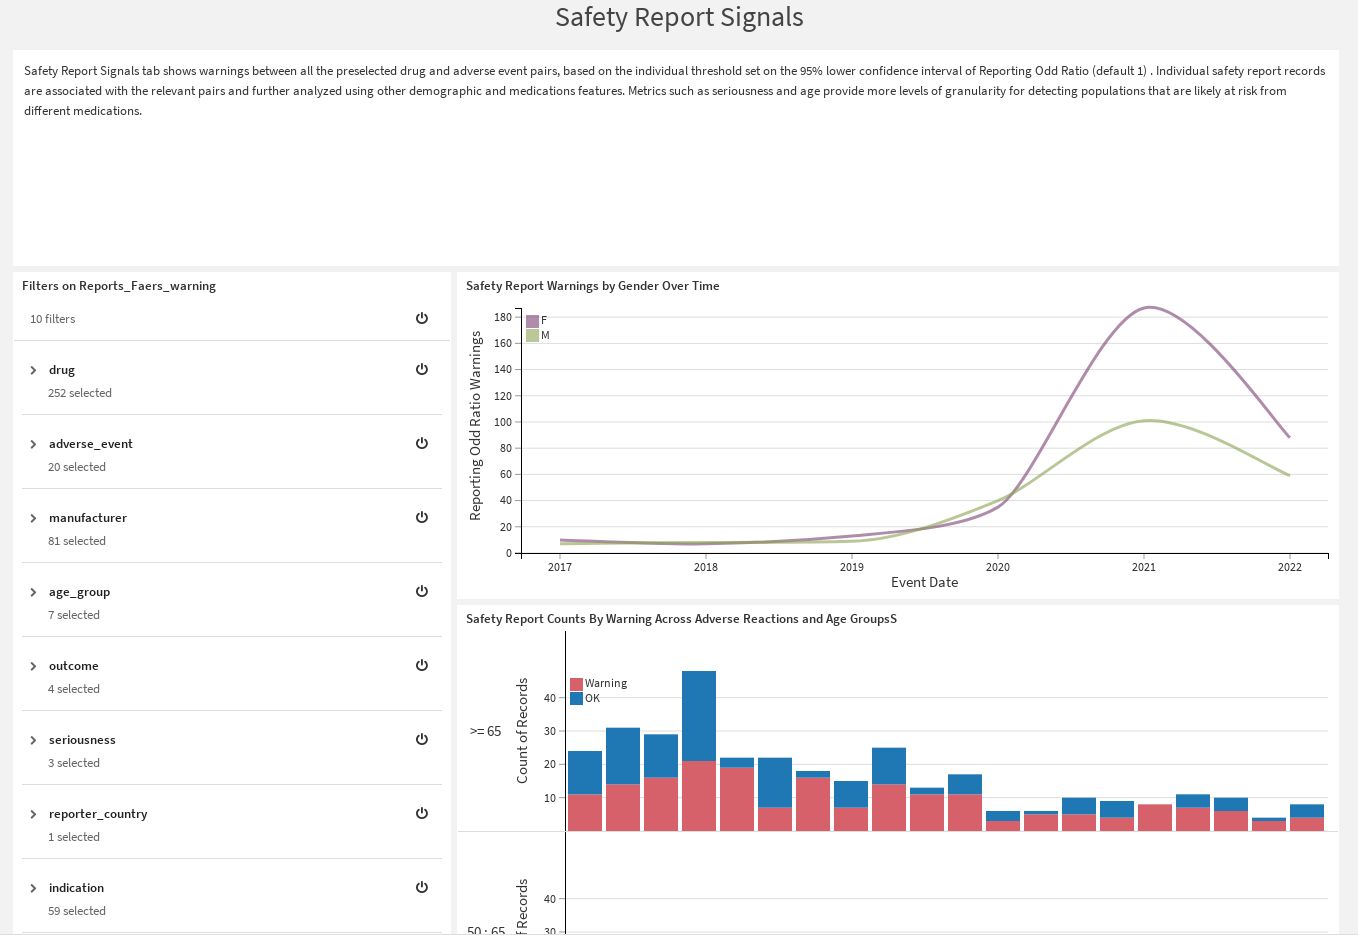
|
Keep trends updated#
This project has a Dataiku app that enables any user to create a new instance. The app re-runs the entire Flow based on the user’s filter selection and updates the pre-build dashboards. The app also allows users to export some output datasets for use in other potential data science workflows.
Setting up the app requires three steps:
Input files with the option to reconfigure the connections.
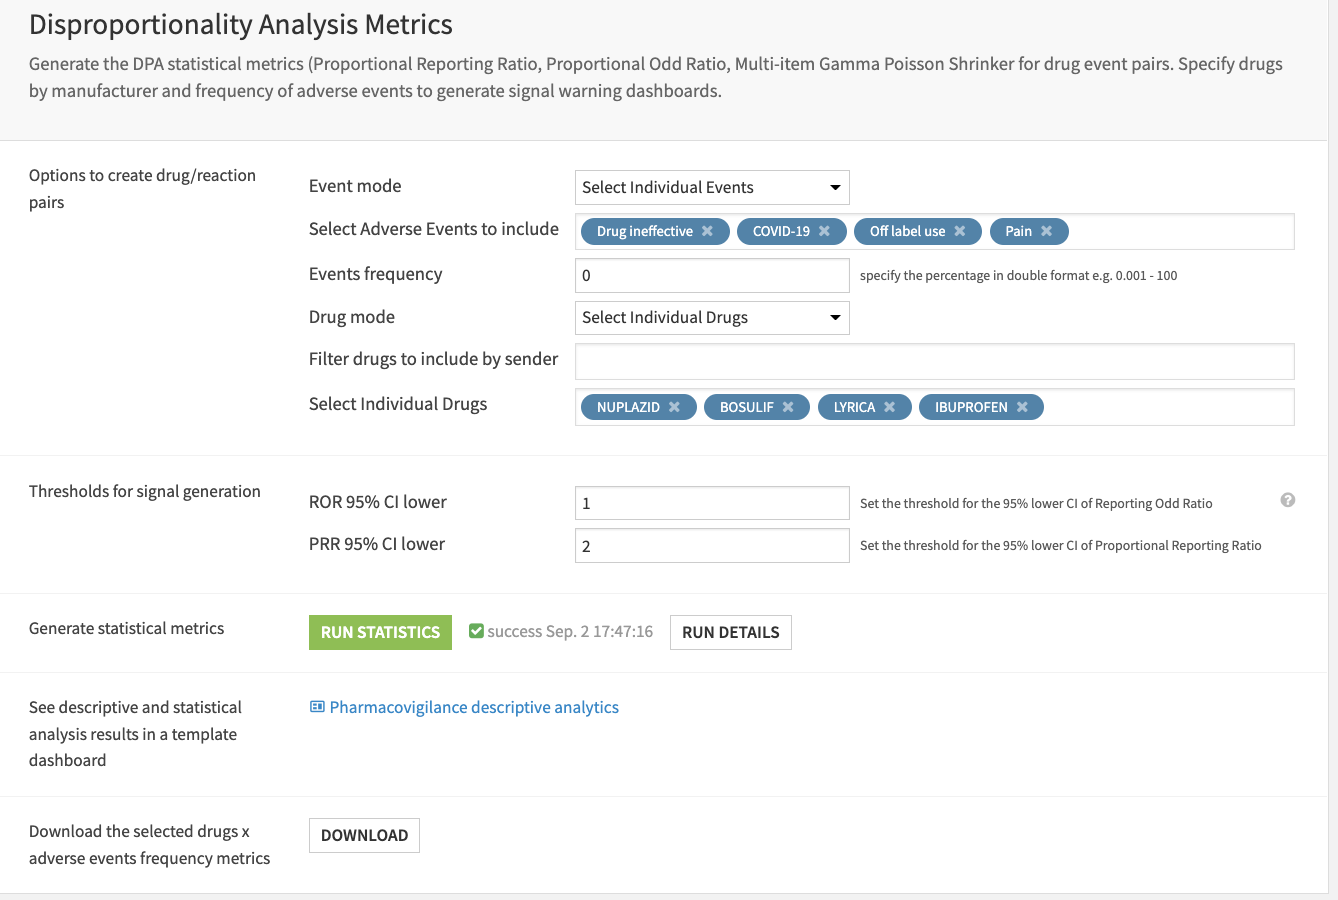
Adjust filters and population selection for the Data Analytics/Statistics section of the Flow to better understand populations and events.
Specify the frequency of events and individual drugs/manufacturers to examine, adjust signal generation thresholds, and calculate measures of disproportionality.
Reproduce these processes with minimal effort#
This project equips drug safety and surveillance stakeholders to understand how they can use Dataiku to integrate large amounts of data from spontaneous reporting systems. Then, they can push the resulting datasets into case management systems for investigation.
By creating a singular Solution that can benefit and influence the decisions of a variety of teams in a single organization, or across multiple organizations, you can:
Use immediate insights to detect drug risks early.
Prevent patient harm.
Ensure safety in diverse populations
Detect dangerous drug interactions.
Anticipate the lengthy regulatory process of drug recalls with early action.
This documentation has provided several suggestions on how to derive value from this Solution. Ultimately however, the “best” approach will depend on your specific needs and data. If you’re interested in adapting this project to the specific goals and needs of your organization, Dataiku offers roll-out and customization services on demand.