
Solution | Production Quality Control#
Overview#
Business case#
Providing products with consistent quality is at the forefront of priorities when operating in manufacturing. This comes as no surprise. The consequences when facing a quality drop can be wide-ranging, including:
An increase in production costs.
Pressure on supply chain management.
Increases in waste generation.
Reduced sales down to fatalities and serious injuries.
Overall, as quality drops alone can sustainably damage customer trust and company brand reputation, they demand tight surveillance. With Industry 4.0 accelerating possibilities for the gathering of data across factories and supply chains, industrial companies have an opportunity to become faster and more flexible to produce higher-quality goods at reduced costs.
On this journey to efficiency, this Solution offers production engineers, quality engineers, and maintenance teams a way to integrate the forecast of AI models in the surveillance of key manufacturing processes. Thanks to full AI explainability, this Solution allows production engineers to identify the parameters most influencing the quality of their manufacturing processes. By moving to near real-time insights and developing scenario-based alerts, relevant operators receive timely notifications and can act early if the Solution detects any changes. A needed step toward embedding AI in the day-to-day.
The goal of this plug-and-play Solution is to show factory management and operations teams how Dataiku can improve the quality of your production and adjust your manufacturing processes in near real time.
Installation#
From the Design homepage of a Dataiku instance connected to the internet, click + Dataiku Solutions.
Search for and select Production Quality Control.
If needed, change the folder into which the Solution will be installed, and click Install.
Follow the modal to either install the technical prerequisites below or request an admin to do it for you.
Note
Alternatively, download the Solution’s .zip project file, and import it to your Dataiku instance as a new project.
Technical requirements#
To use this Solution, you must meet the following requirements:
Have access to a Dataiku 12.0+* instance.
The version of the Solution that’s available for download uses filesystem-managed datasets. It’s possible to integrate Streaming data with this project for real-time monitoring.
Data requirements#
The data contained in this project represents the overmolding process where silicone is injected into a toothbrush handle, resulting in a seamless combination of plastic and rubber. The injection process depends on the right control of injection pressure, temperature, and curing time to avoid defects.
Although the delivered data may be specific to toothbrush handle manufacturing, the use case represents a well-known problem in the factory of injection time drift caused by a machine that needs recalibration. Furthermore, thanks to the Dataiku app and generalized data model in this Solution, it’s adaptable to any production quality control use case and data.
The Solution takes in two input data sources.
Dataset |
Description |
|---|---|
process-data |
Contains measurements from the machines and is composed of 6+ columns:
As illustrated, in this dataset, you can add as many columns as you have process parameters. These parameters will be used to create the machine learning model and will be sorted by the most influencing. |
quality-data |
Contains a simplified view of the quality results, composed of two columns:
|
Workflow overview#
You can follow along with the Solution in the Dataiku gallery.
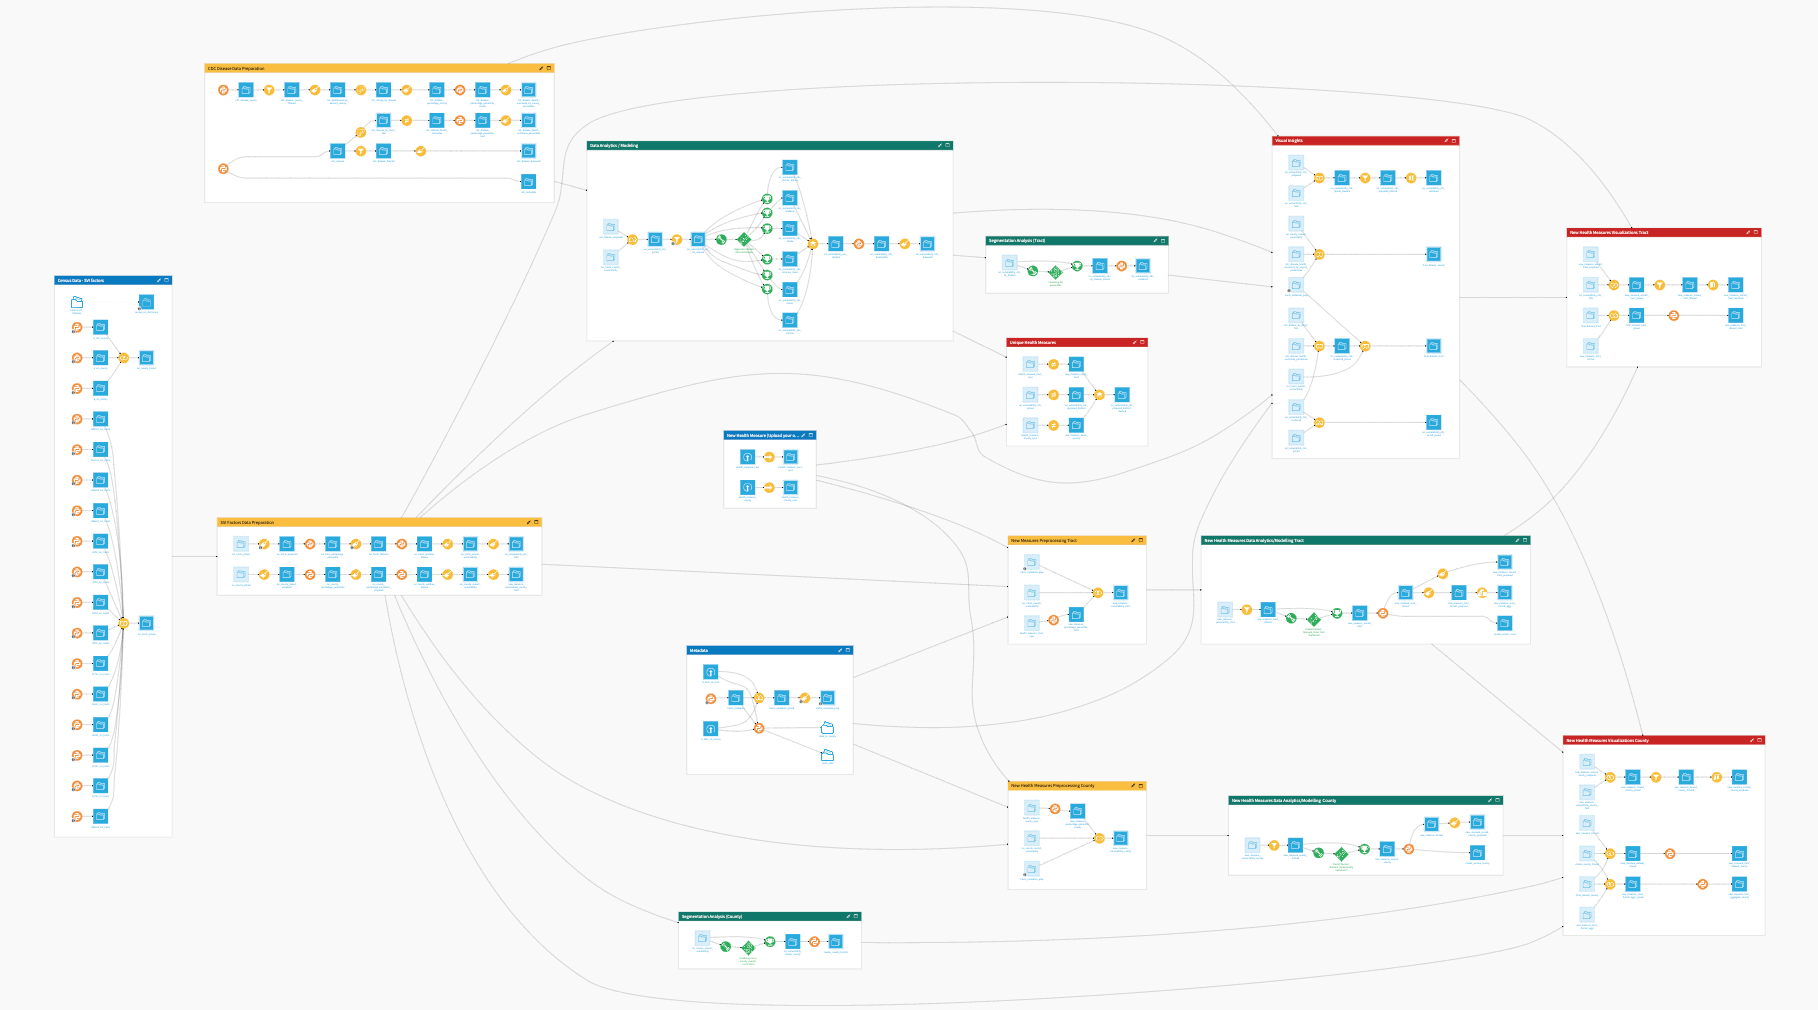
The project has the following high-level steps:
Connect your data as input and select your analysis parameters via the Dataiku app.
Ingest and prepare the data.
Train and score a defect prediction model.
Detect and raise alerts for drifts in injection time.
Predict defects based on data from the last 24 hours.
Evaluate the model, identify injection drifts, and analyze production quality with pre-built dashboards.
Automate the Solution for continuous, real-time analysis.
Walkthrough#
Note
In addition to reading this document, it’s recommended to read the wiki of the project before beginning to get a deeper technical understanding of how this Solution was created and more detailed explanations of Solution-specific vocabulary.
Plug and play with your own data and parameter choices#
To begin, you’ll need your own instance of the Dataiku app associated with this Solution.
From the waffle (
 ) menu of the Design node’s top navigation bar, select Dataiku Apps.
Search for and select the application with the name of this Solution.
Then, click Create App Instance.
Once you have created a new instance, you can walk through the app steps to add your data and select the analysis parameters to run. Users of any skill level can input their desired parameters for analysis and view the results directly in pre-built user-friendly dashboards. You could also instantiate multiple Production Quality Control projects to monitor multiple manufacturing processes in parallel.
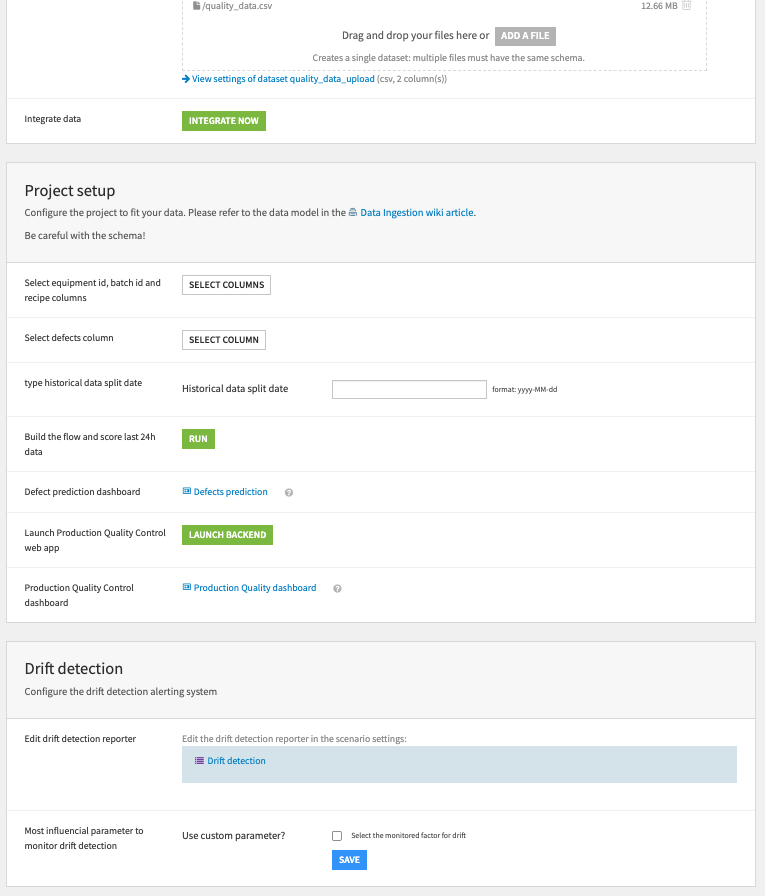
To begin, upload your process and quality data as CSV files. These data files need to contain data that conforms to the data model detailed in the Data requirements section of this article. Once you have uploaded the two files, the green Integrate Now button will load the schema and column list of the next step.
You should now specify the columns from your uploaded datasets that you want to include in the Flow (that is, equipment ID, batch ID, etc.). Enter a date on which you want to split the data between historical and new data. Clicking Run will build the full Flow and the Defects prediction dashboard.
To enable the Production Quality Control dashboard, you must click the subsequent Launch Backend button. Before moving to the dashboards, a final section of the Dataiku app allows you to configure the drift detection alerting system. This is important for continuous monitoring of your in-production Solution. Here you can edit the reporter on which you want to receive alerts. You also have the option to define a custom parameter for the machine learning algorithm to monitor.
Once you’ve built all elements of the Dataiku app, you can either continue to the Project View to explore the generated datasets or go straight to the dashboards and webapp to visualize the data. If you’re mainly interested in the visual components of this pre-packaged Solution, skip over the following few sections.
Ingest and prepare data#
The first two Flow zones of the project are straightforward. It begins in the Data Ingestion Flow zone by bringing in the two initial datasets detailed in the previous Data requirements section.
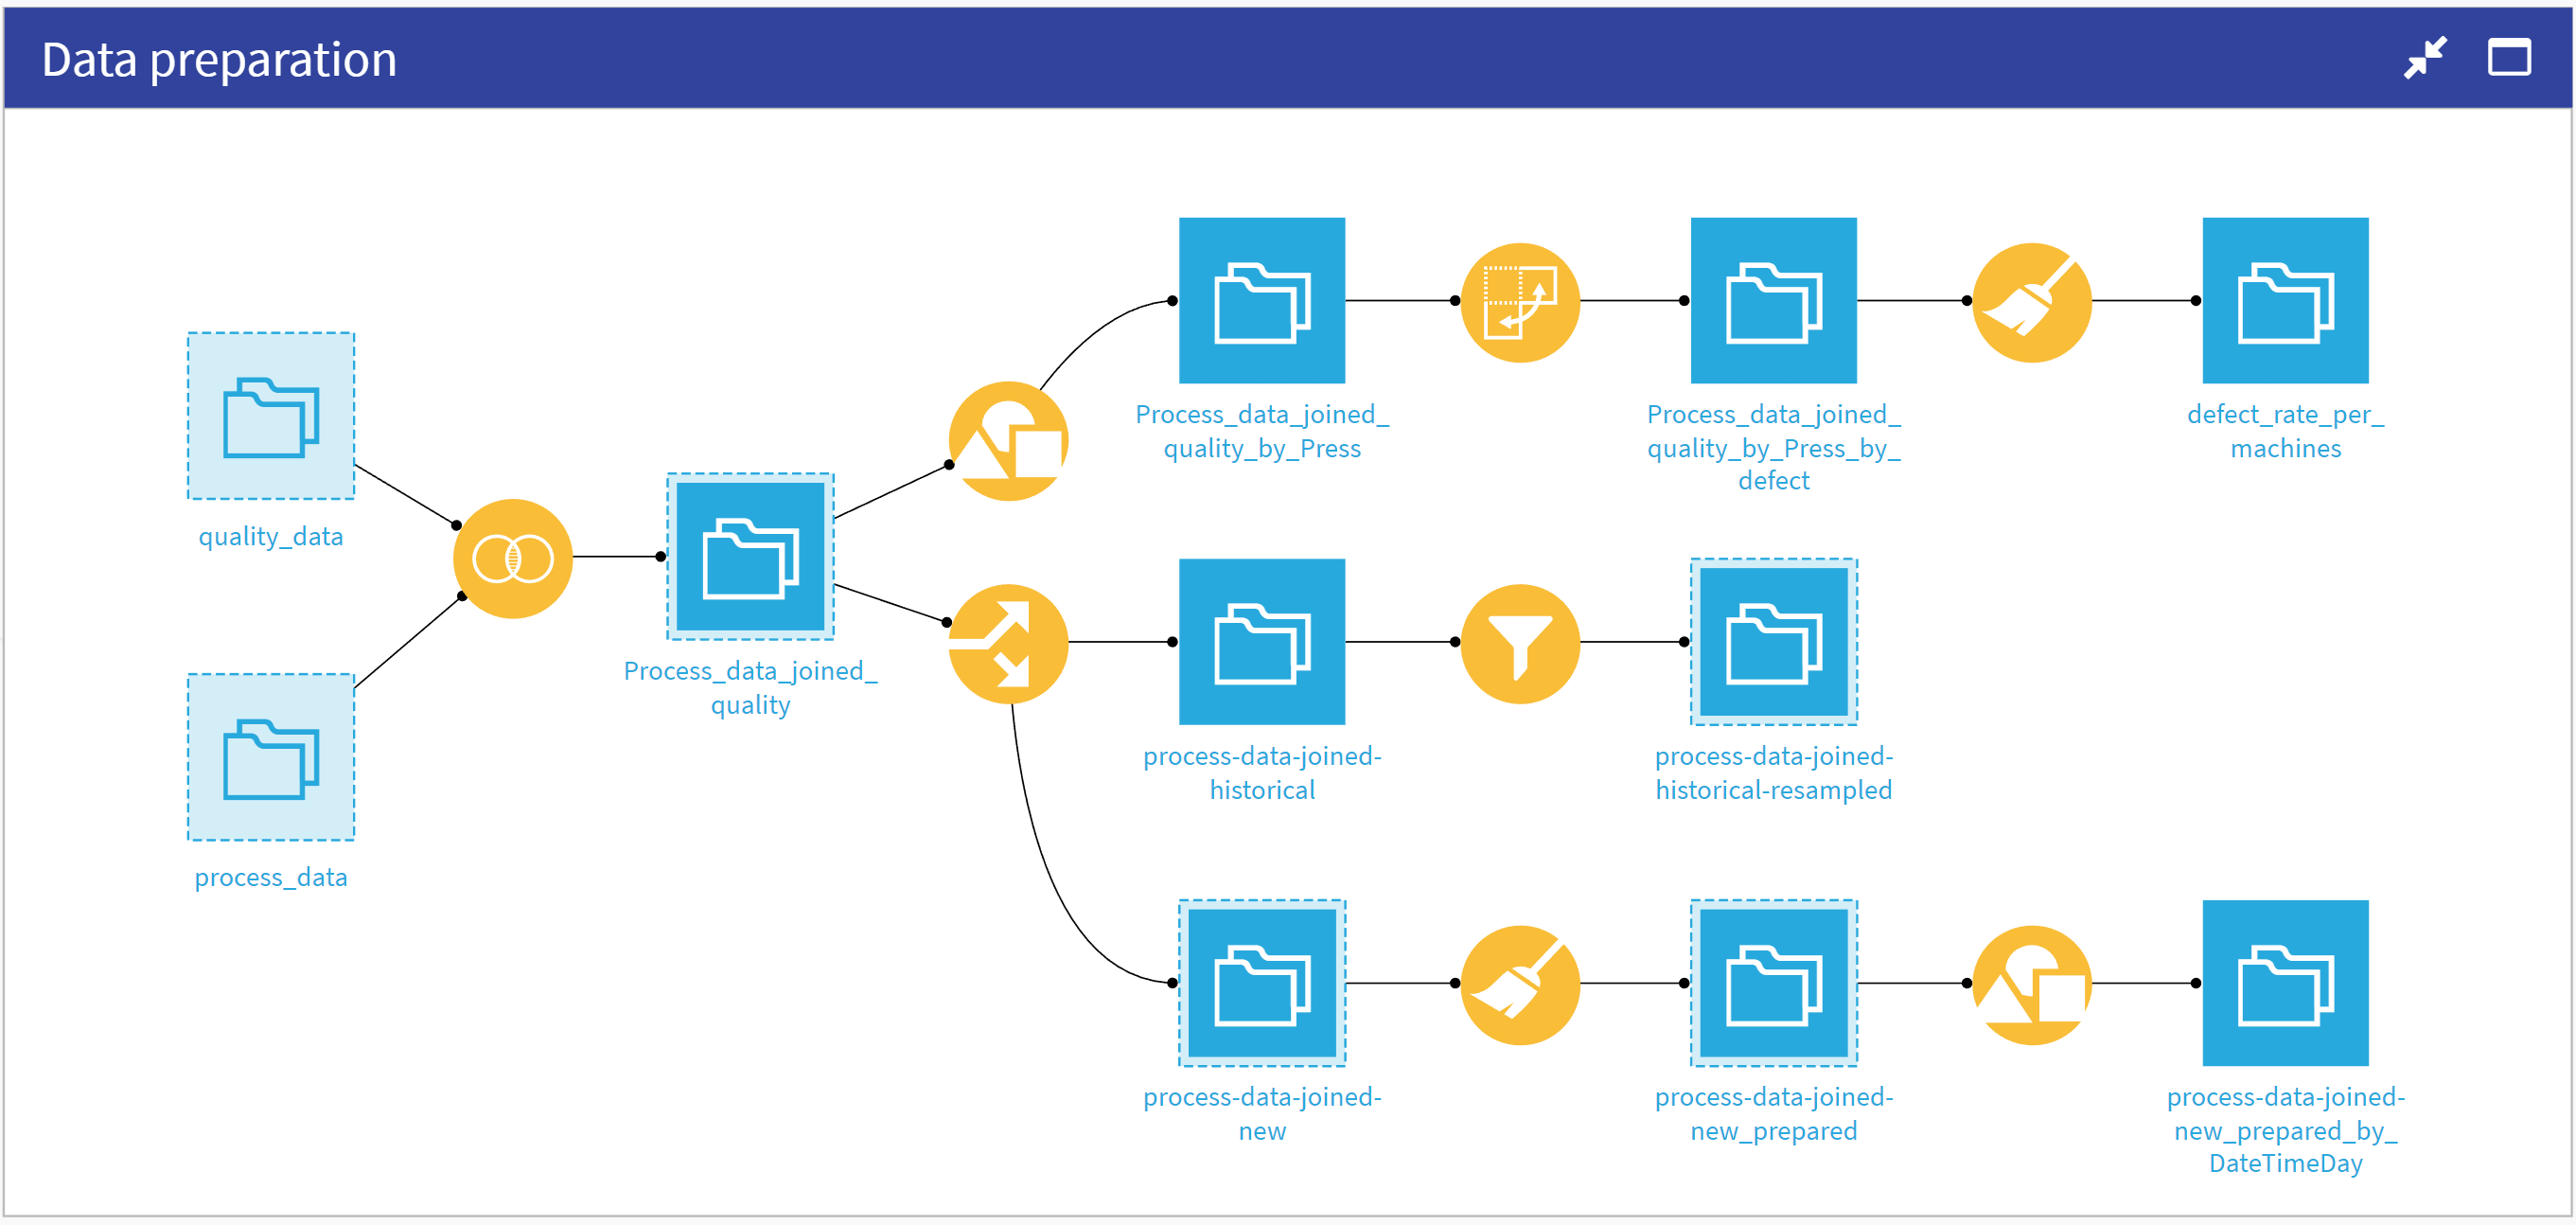
Now that you have access to all input datasets, you can move along to the Data preparation Flow zone. The Flow first rounds values in the Process-data dataset before joining it with quality-data on the InjectionID. This dataset is the source for several charts available in the dashboard. Three branches for data preparation result from this dataset:
Computation of the overall defect rate per machine (top branch) used by the Webapp to display the defect rate per machine.
Resampling of the historical data (middle branch) used to train the models.
Computation of the defects and number of injections per day (bottom branch) used by the Webapp to display the daily production rate for the past 7 days.
Proactive quality control: Training a defect prediction model#
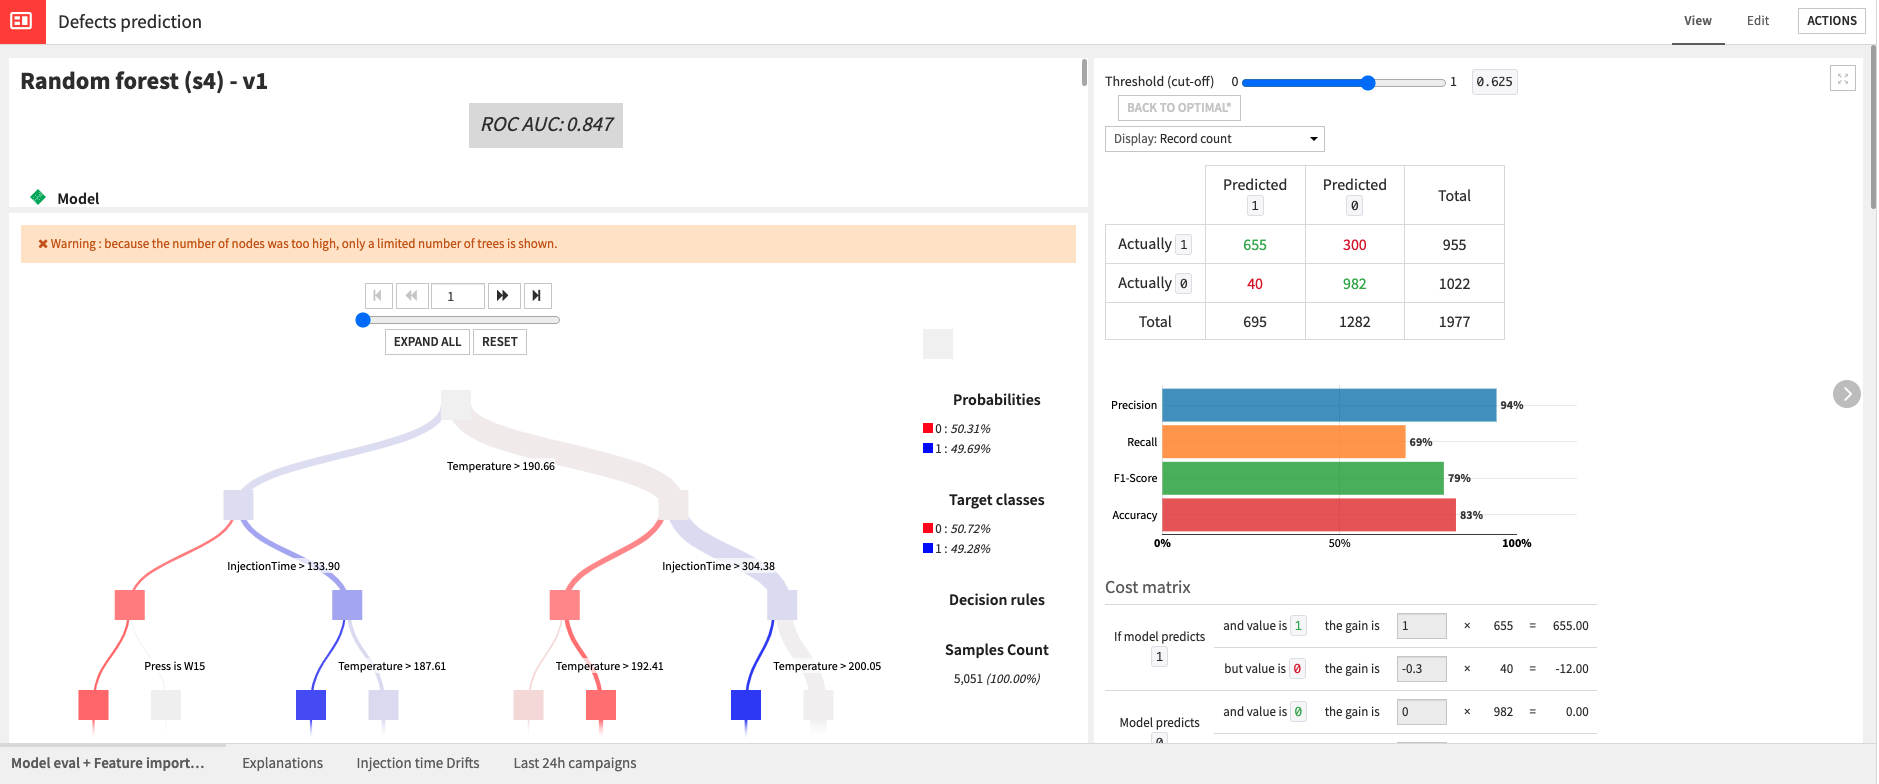
Having previously created the process-data-joined-historical-resampled dataset, you’re ready to train and score a model for predicting defects made by the machines in the Defect prediction Flow zone. The dataset used to train the model represents data that was downsampled to have more accurate results at a ratio of 50/50. This is quite aggressive, but it will cause more false positives rather than false negatives.
Model training also used the cost matrix available in the visual ML recipe to optimize. Ultimately, the Solution deploys a Random Forest model which, despite taking 5x longer to train than the XGBoost model, still performed better.
You can test out the model by using it to score the process-data-joined-new dataset which represents all new data. The previous Flow zone split out this data.
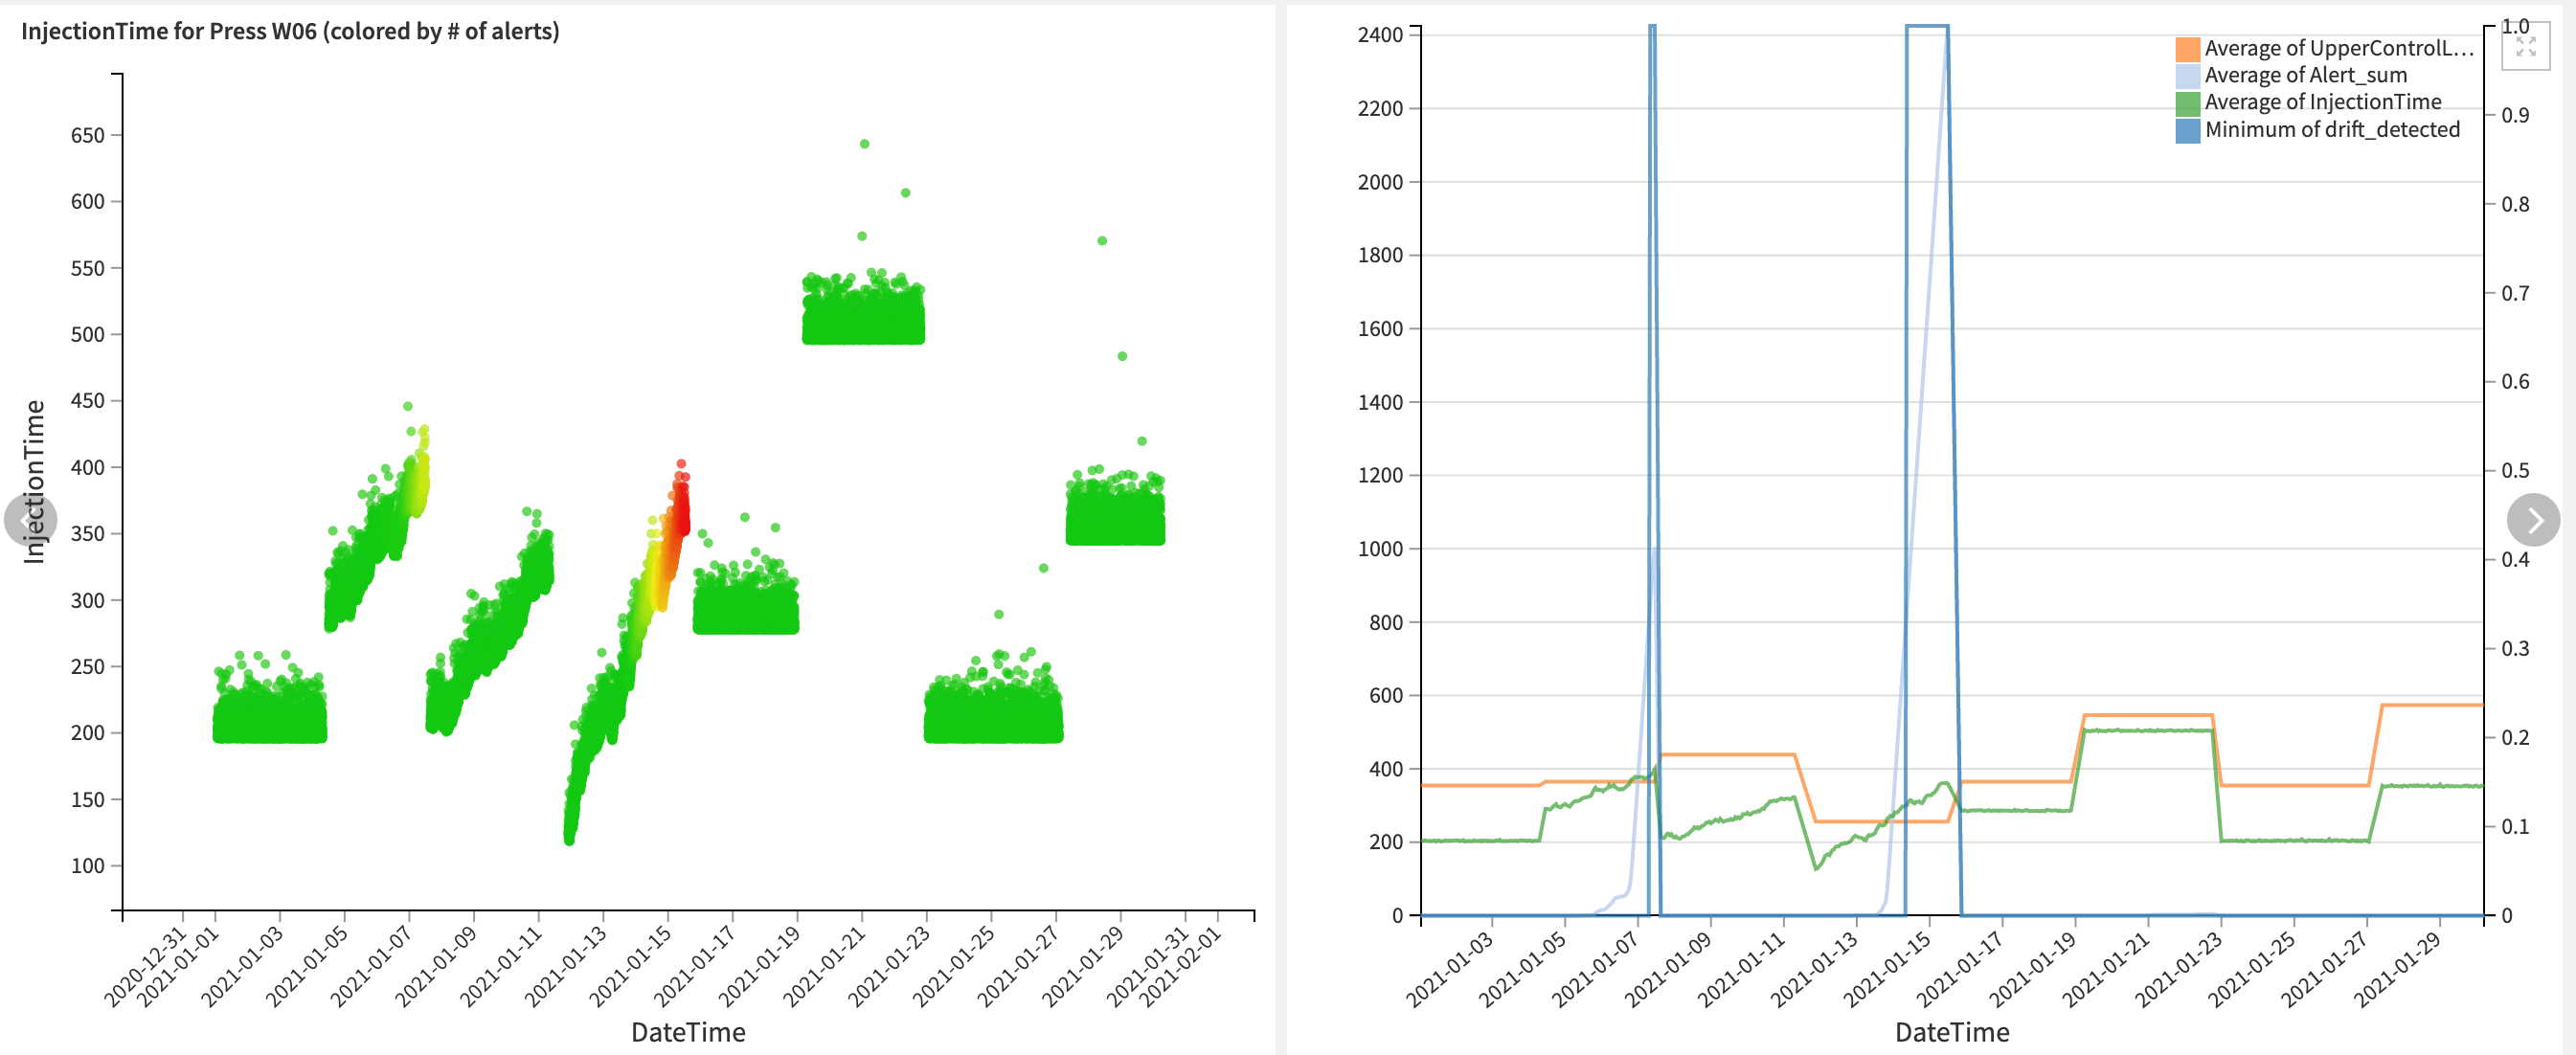
Detecting drifts in data#
In addition to predicting defects with the trained model, you can also detect drifts in the injection time as a way to monitor product quality. Begin in the Drift detection & alerting Flow zone by using a Window recipe to compute the average and standard deviation of the injection time per recipe. Then the Flow computes the upper control Limit as a distance from the average. Finally, it sets an alert variable as true if the injection time exceeds the set limit.
This, however, resulted in too many alerts being raised so the Solution further refined its monitoring by setting a threshold of Alerts (currently set to 800) that the injection times need to pass before considering drift to be occurring.
You can use the generated alerts in the Scenario defined below to send notifications to a maintenance team. You can play with and tune the limits used to achieve optimal results on your own data.
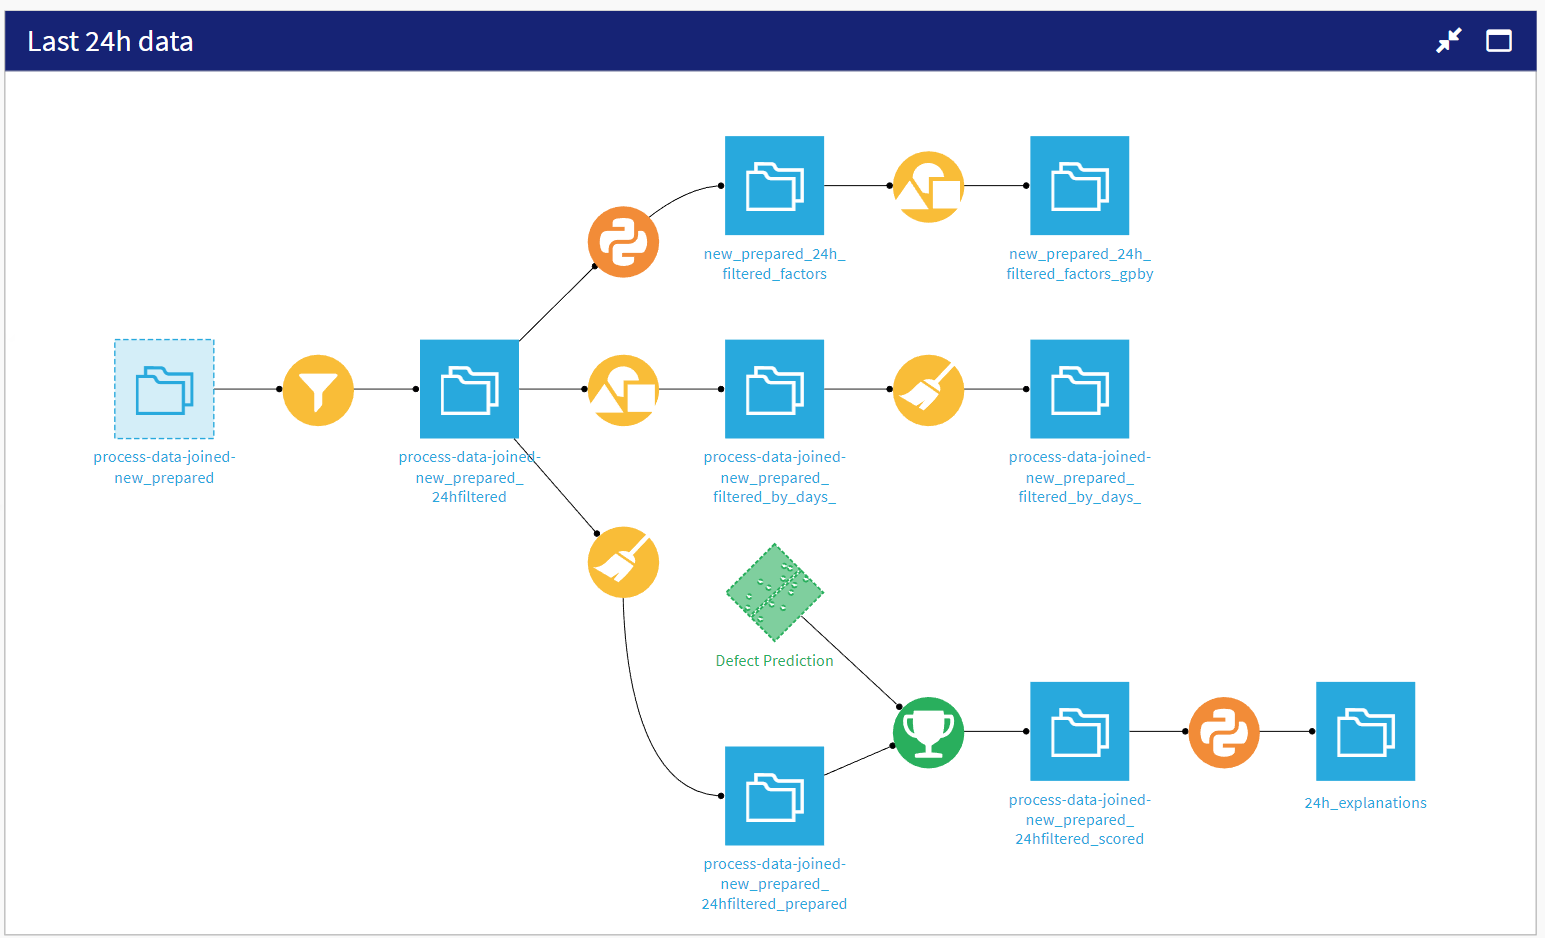
Focusing on relevant updates#
When putting a Solution like this into production, it’s handy to have a Flow zone like Last 24h data to perform faster data updates and scoring. It takes, as an input to the Flow zone, process-data-joined-new_prepared, and filters to focus on data from the last 24 hours. From this filtered dataset, it creates three branches each with its own goal:
Compute the average injection time, pressure, and temperature for the last 24 hours.
Compute the defect rate per machine for the last 24 hours.
Score data from the last 24 hours using the previously trained and deployed model.
All resulting metrics from these branches are available in the webapp for monitoring.
Visual monitoring and data exploration#
This Solution comes with two pre-built dashboards to assist in monitoring and controlling your Production Quality. The first dashboard, Defects Prediction, uses Dataiku’s native charts to give a more detailed understanding of production data and the model used to predict defects. This dashboard is composed of four tabs:
Dataset |
Description |
|---|---|
Model eval + Feature importance |
Provides some explainability values about the trained model. |
Explanations |
Includes a What if visualization for the model. |
Injection time drifts |
Shows the drift of injection time and examples of how charts specific to the performance and alerting of individual machines can be created. |
Last 24h campaigns |
Shows the last 24 hours’ campaigns distributions and if any drifts have been detected. |
Note
If your Dataiku instance’s built-in Python environment is Python2, instead of Python3, there will be errors when trying to use the Explanations tab of the dashboard. You can fix these errors by retraining the model and deploying the newly trained model. There are no other impacts on the performance of the Solution.
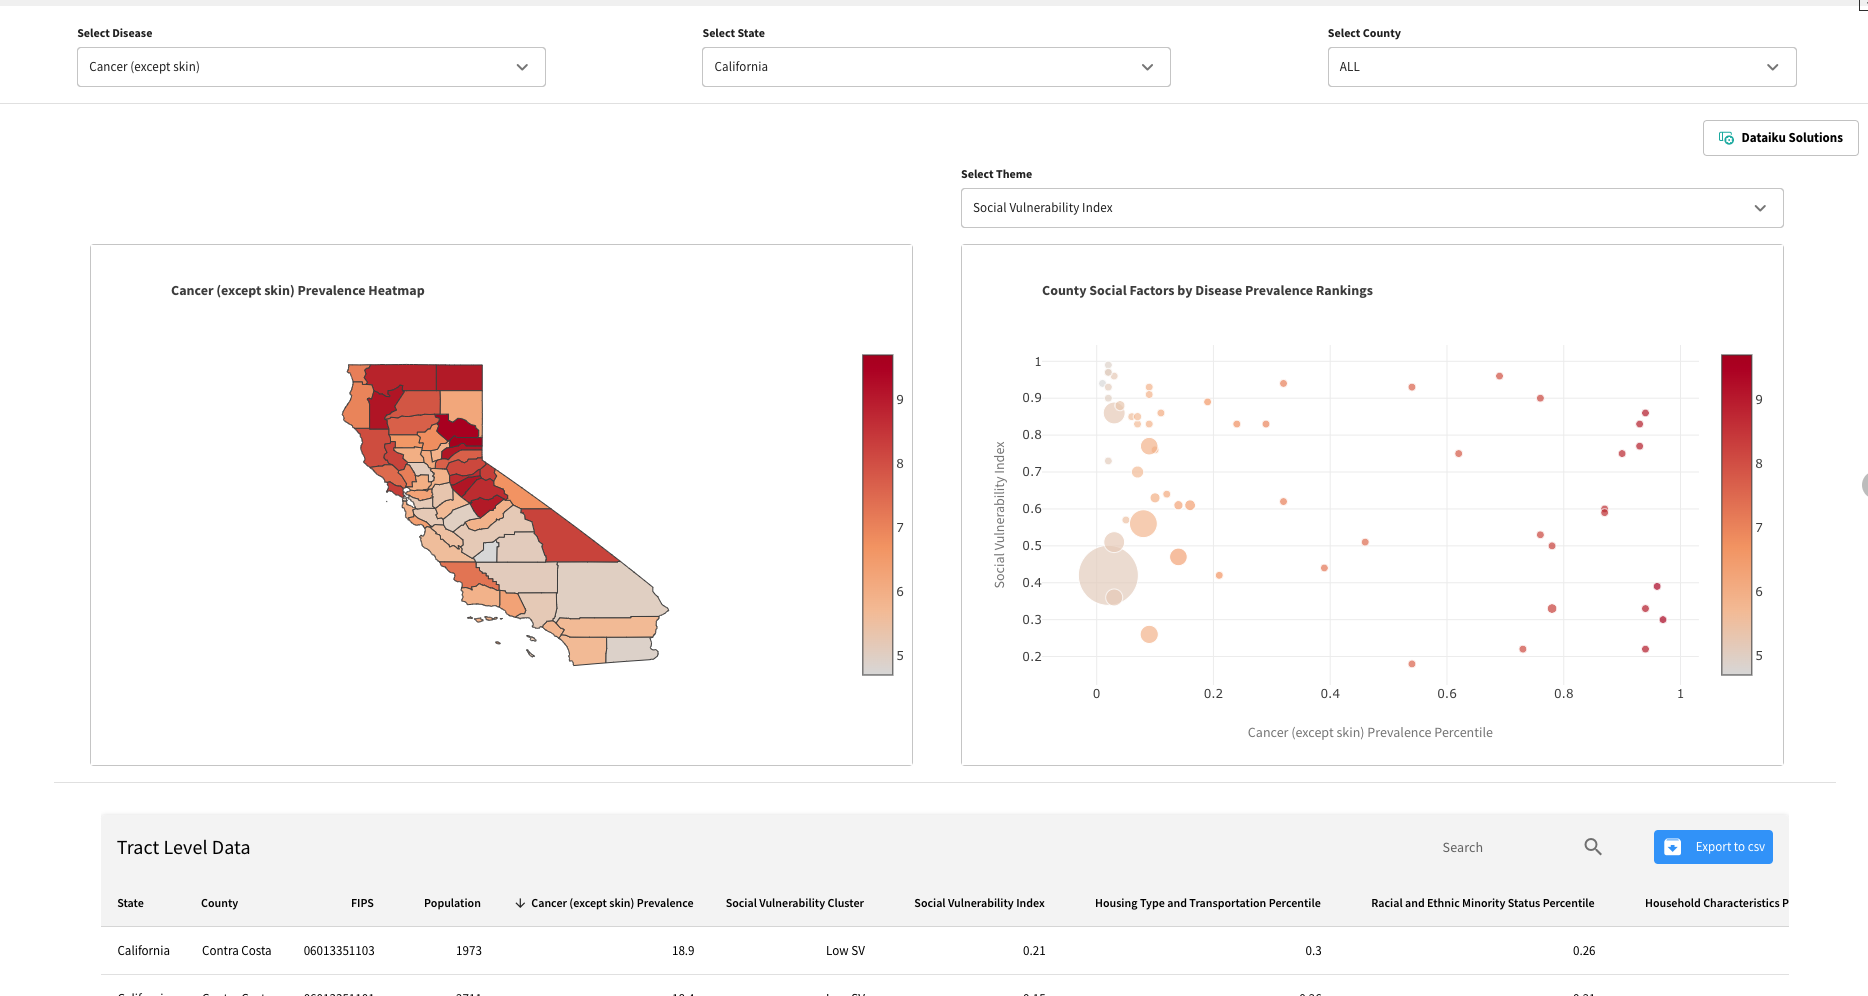
The second dashboard Production Quality Dashboard contains the webapp which has been specifically designed with visualizations that are customizable. Out-of-the-box it displays common KPIs about total production and defect rates, as well as information on the top three most influential factors for defects.
Making this Solution reactive to real-time data#
For a Solution like this to be useable for real-world production quality control, you need to think about automated alerting and streaming. The former has been mentioned several times already and the Flow has been configured to support alert generation based on drifts in injection time.
This Solution comes with a Scenario that triggers every 900s to compute if the alerts limits have been crossed. The scenario can be additionally configured to send alerts via email, Slack, or Microsoft Teams. This shows off the reactiveness of the Solution to changing data, but doesn’t incorporate true streaming.
Going further with streaming#
Note
Streaming is an experimental feature of Dataiku and not natively provided in this Solution. An instance admin will need to activate streaming on your Dataiku instance before the following is possible. We do recommend reaching out to the support team for assistance.
To reach a near real-time prediction, implement the streaming component by connecting your stream-processing platform to the Solution. Download the project, and implement it in your existing Production Quality Control Solution in three steps:
Share the model and the dataset from your implemented Production Quality Control Solution.
Set up the streaming endpoints to fit your Kafka topics.
Adjust the project’s variables to fit the project, dataset, and model name.
Once you’ve done this, your Flow should allow you to get real-time alerts to know whether a product has a defect based on your production data.
Reproducing these processes with minimal effort for your data#
The intent of this project is to improve the quality of your production and adjust your manufacturing processes in near real-time using Dataiku.
By creating a singular Solution that can benefit and influence the decisions of a variety of teams in a single organization, you can improve production efficiency and detect changes in production with sufficient lead time.
This documentation has provided several suggestions on how to derive value from this Solution. Ultimately however, the “best” approach will depend on your specific needs and data. If you’re interested in adapting this project to the specific goals and needs of your organization, Dataiku offers roll-out and customization services on demand.