
Solution | Next Best Offer for Banking#
Overview#
Business case#
Marketing campaigns are most impactful when intelligently targeted. Sending the same material to the whole customer base isn’t only costly, but also ineffective. Knowing how likely a group of customers is to subscribe to a product is essential to make the right decision.
This Solution completes the customer segmentation Solution within the marketing suite for banking. The user can plug the same data as in the former Solution and build an initial model. The Project Setup enables users to control how to define the target customers for the marketing campaign.
Installation#
From the Design homepage of a Dataiku instance connected to the internet, click + Dataiku Solutions.
Search for and select Next Best Offer.
If needed, change the folder into which the Solution will be installed, and click Install.
Follow the modal to either install the technical prerequisites below or request an admin to do it for you.
Note
Alternatively, download the Solution’s .zip project file, and import it to your Dataiku instance as a new project.
Technical requirements#
To leverage this Solution, you must meet the following requirement:
Have access to a Dataiku 14.7.0+* instance.
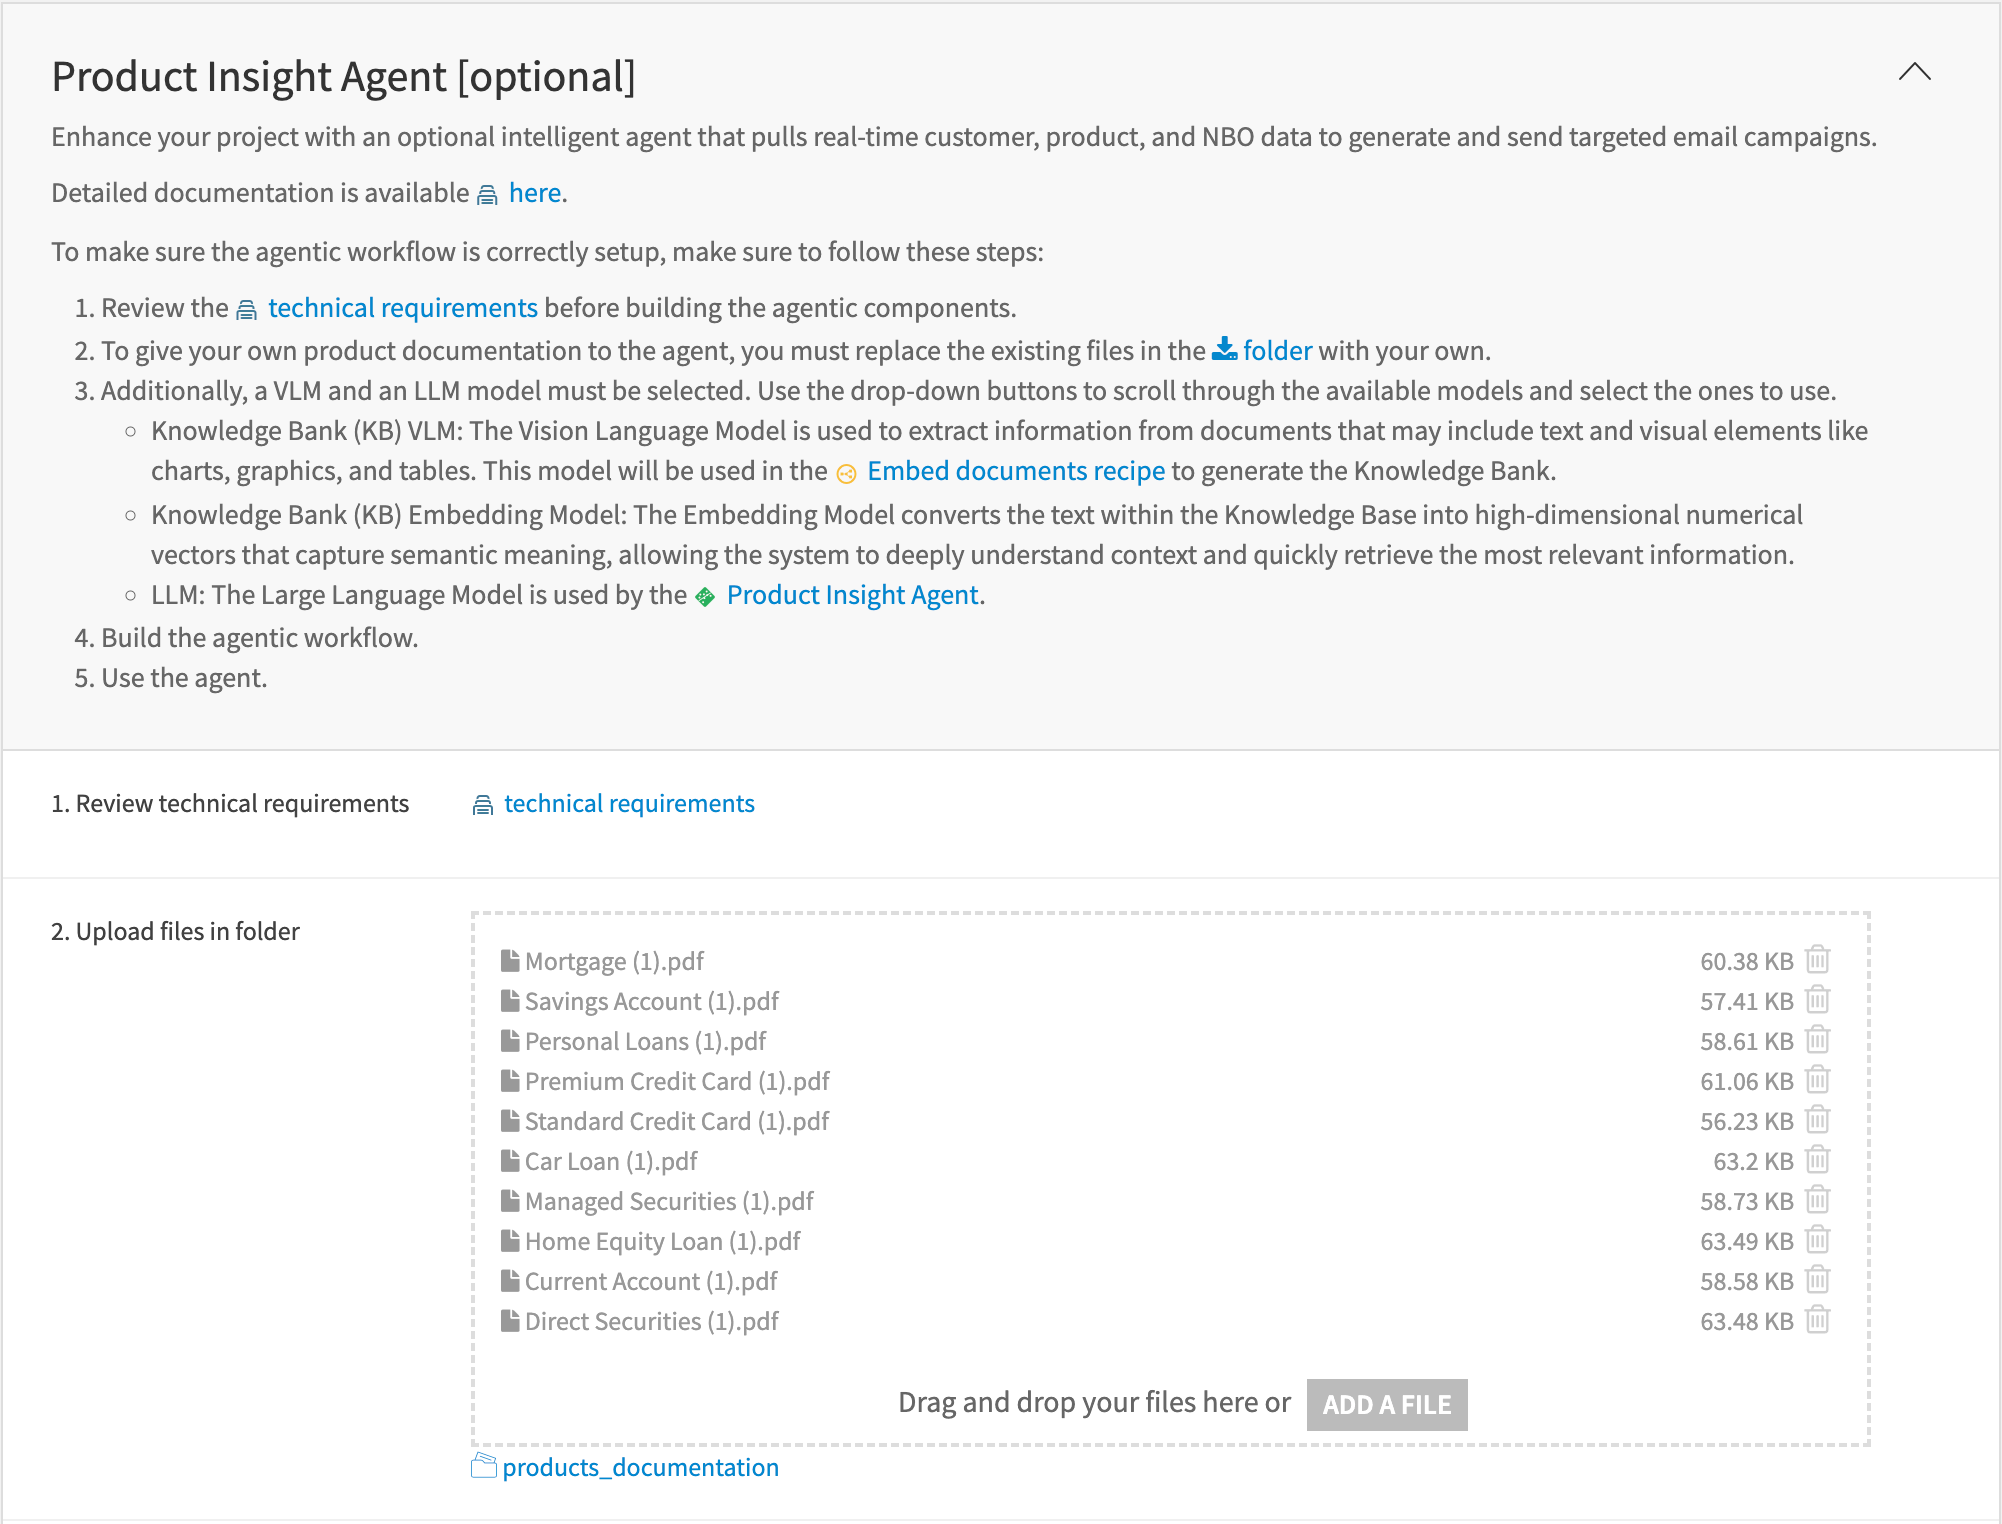
[Optional] Agentic Module Requirements:
LLM & VLM connections : Large language models are what make Generative AI possible. To use GenAI in this project, you must first connect to a service providing access to LLMs.
SMTP channel : The agentic workflow requires an SMTP channel for its sent message tool.
Data requirements#
The project is initially shipped with all datasets using the filesystem connection.
The input data should be separated into five different datasets with the same time frequency:
Dataset |
Description |
|---|---|
revenues |
Includes the revenues generated by each product per customer over time. |
product_holdings |
Includes product information and duration period of each product held by customers. |
customers |
Includes customers’ static information. You can add optional columns to this dataset. |
balances |
Includes balance amounts of each product per customer over time. |
additional_information |
Includes optional additional columns. |
[Optional] To use the Agentic Module, you’ll need to provide documents in PDF format including product documentation.
Workflow overview#
You can follow along with the Solution in the Dataiku gallery.
The project has the following high-level steps:
Connect your data as input, and select your analysis parameters via the Project Setup.
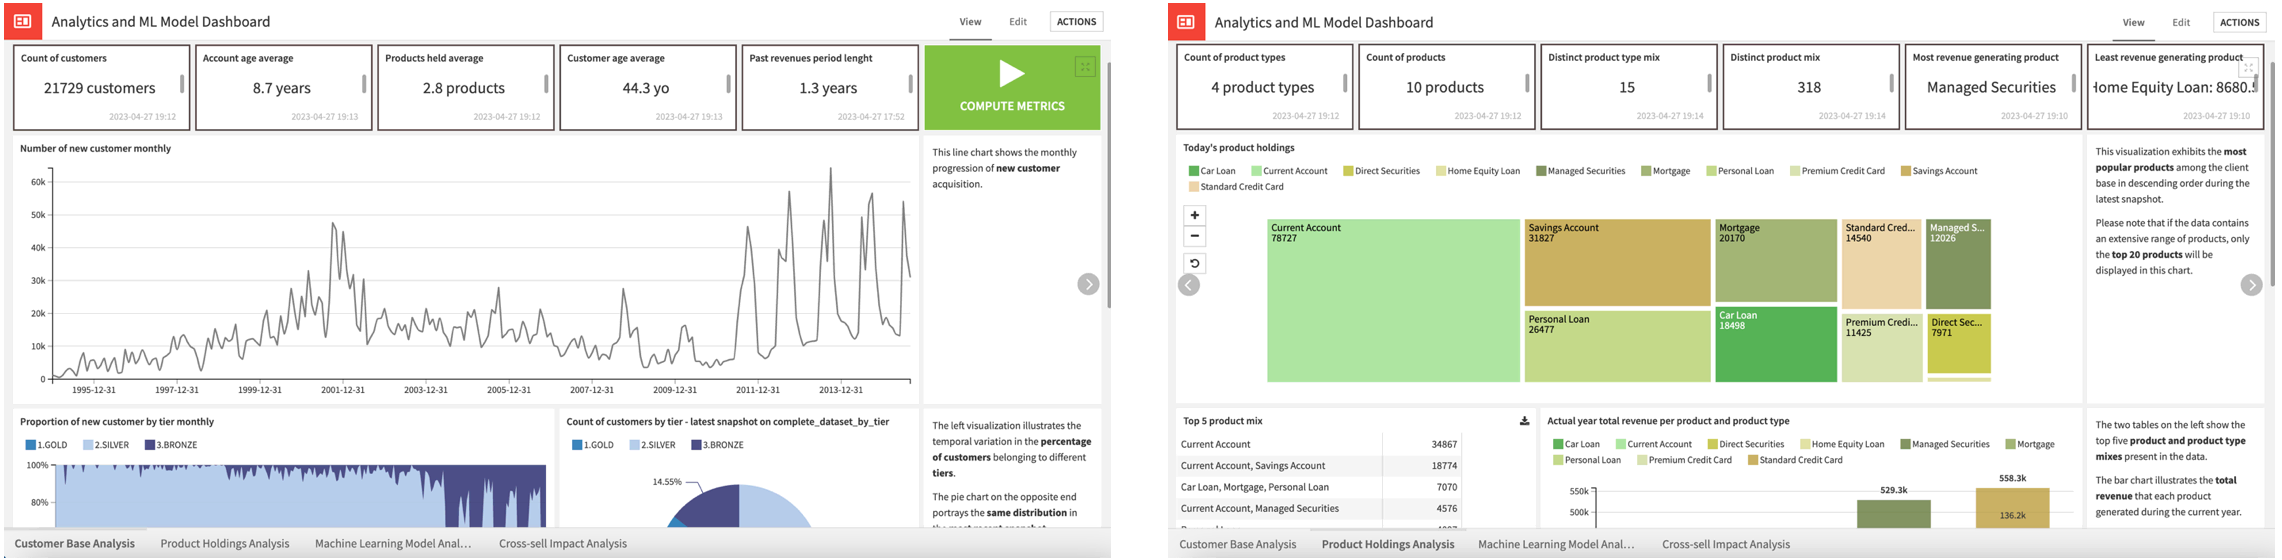
Explore the data and understand the model through the Analytics and ML Model dashboard.
Analyze and compare your top customers and top campaigns for cross-sell in the Marketing Campaign dashboard.
Visualize specific information about a chosen customer in the Customer Focus dashboard.
Walkthrough#
Note
In addition to reading this document, it’s recommended to read the wiki of the project before beginning to get a deeper technical understanding of how this Solution was created and more detailed explanations of Solution-specific vocabulary.
Plug and play with your own data and parameter choices#
To begin, you’ll need to use the Project Setup. The project comes with sample data. You can replace it with your data, assuming that it adopts the data model described above.
You can do this in three ways:
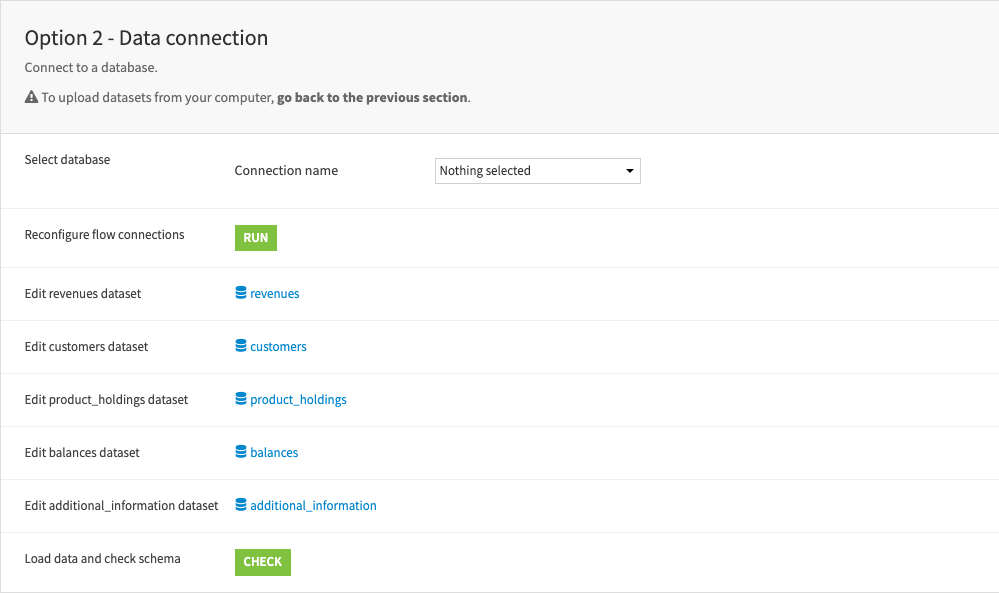
Upload data directly from the filesystem in the first section.
Connect to your database of choice by selecting an existing connection.
Copy connection settings and data from a Next Best Offer for Banking project already built.
In options 1 and 2, users must click the Check button, which will load the data and verify the schema.
Tip
Be sure to refresh the page so that the interface can dynamically take your data into account.
With data selected and loaded into the Flow, you can move to the following sections:
Section |
Description |
|---|---|
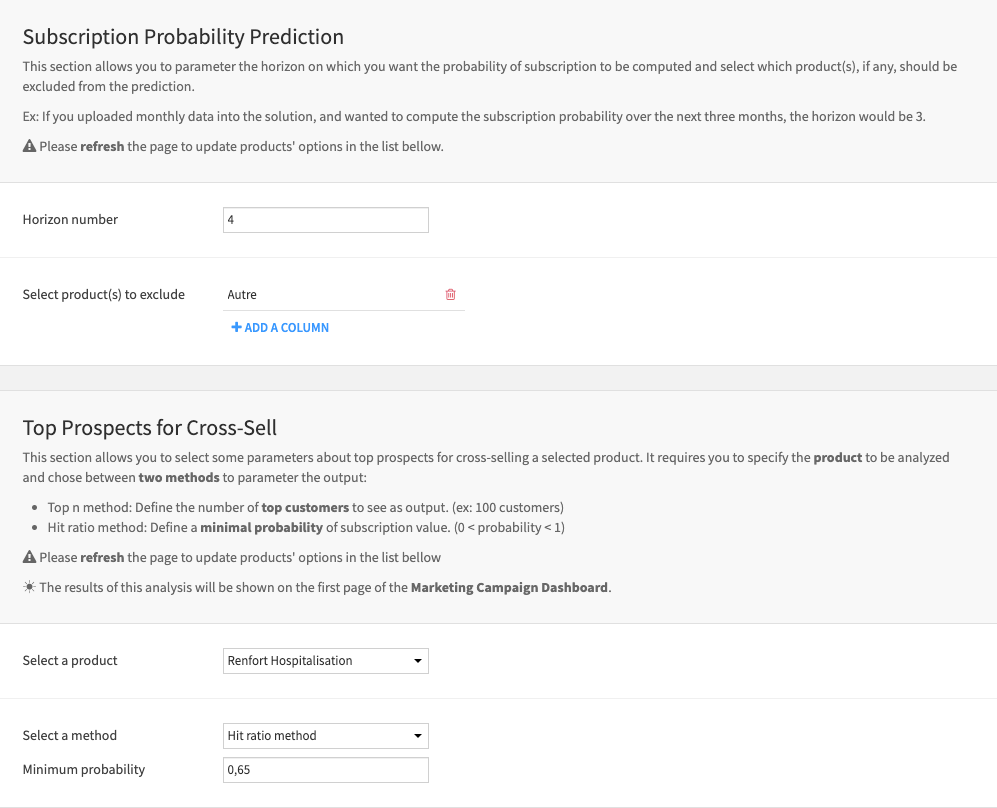
Subscription Probability Prediction |
Allows you to set the horizon on which you want the probability of subscription to be computed and select which products, if any, should be excluded from the prediction. |
Top Prospects for Cross-Sell |
Allows you to select some parameters about top prospects for cross-selling a selected product. It requires you to specify the product to be analyzed and choose between two methods to parameterize the output. |
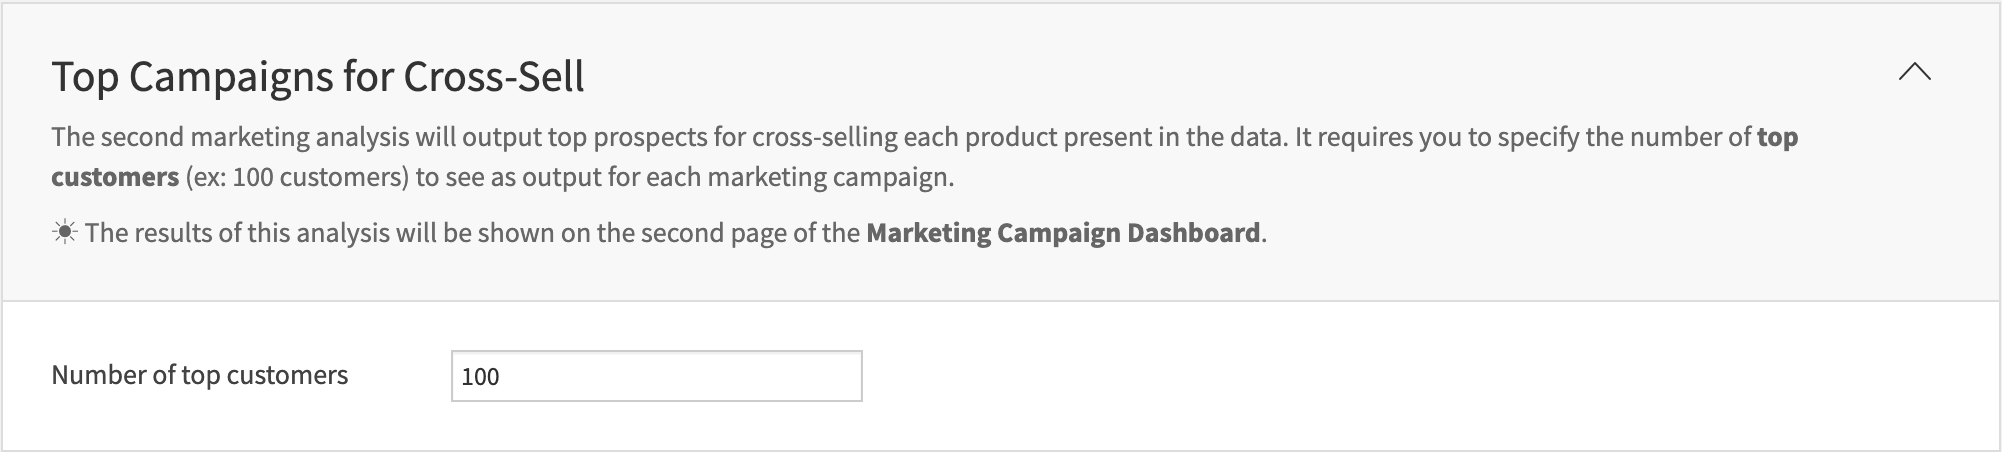
Top Campaigns for Cross-Sell |
Outputs top prospects for cross-selling each product present in the data. It requires you to specify the number of top customers (ex: 100 customers) to see as output for each marketing campaign. |
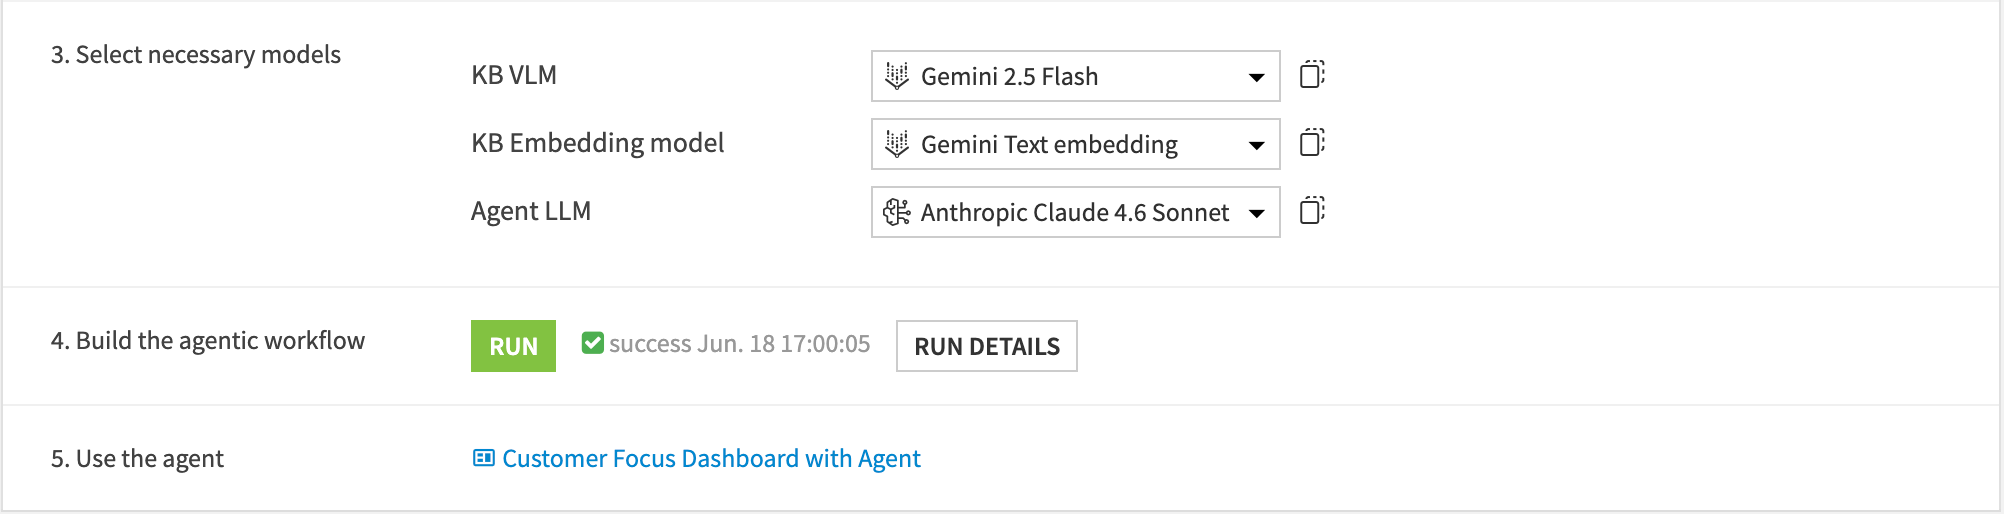
[Optional] Product Insight Agent |
Enhances the project with an optional intelligent agent that pulls real-time customer, product, and NBO data to generate and send targeted email campaigns. |
The following screenshots illustrate each of these sections.
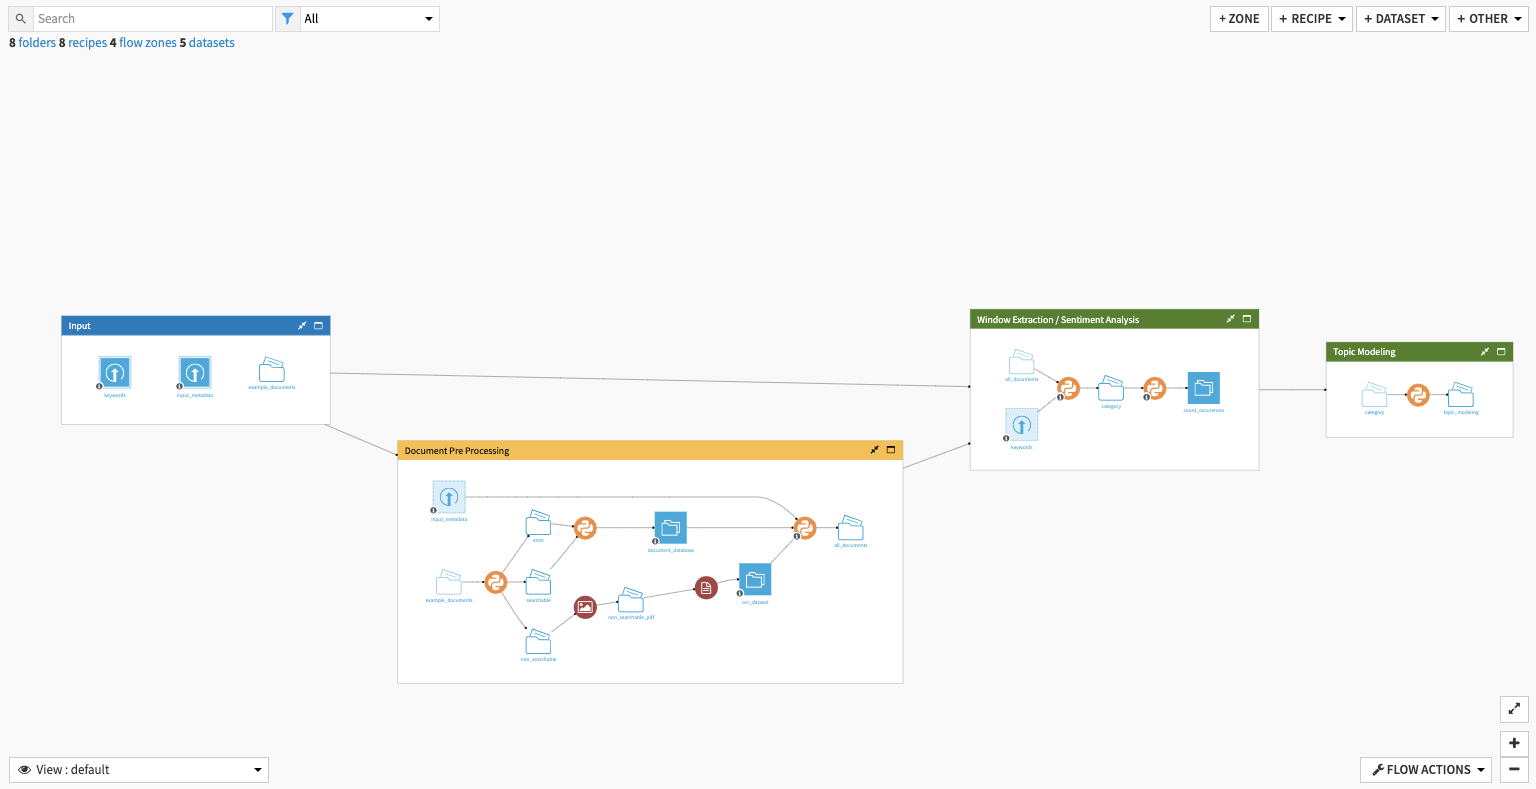
Cleaning and preparing historical data#
In total, seven Flow zones prepare and clean data for this Solution. We won’t go into heavy detail about each Flow zone. See the project wiki for these details.
These Flow zones help construct the consolidated input dataset. The Solution generates a unique row for each client, date, and product combination, enabling it to determine whether the client held the product at a given point in time.
After training, testing, and scoring a classification model, two final Data Prep Flow zones compute the expected gain and impact values. These Flow zones are important to get the data into a format that can generate visualizations and metrics for the dashboard.
Exploring input data#
To better understand the input data and verify that it’s coherent, it’s important first to explore the historical datasets. Doing so allows for identifying the population distributions and trends of the customer base and product holdings.
The Customer analysis and Today’s holdings analysis Flow zones compute all metrics and values needed to generate charts for the two first pages of the Analytics and ML Model Dashboard.
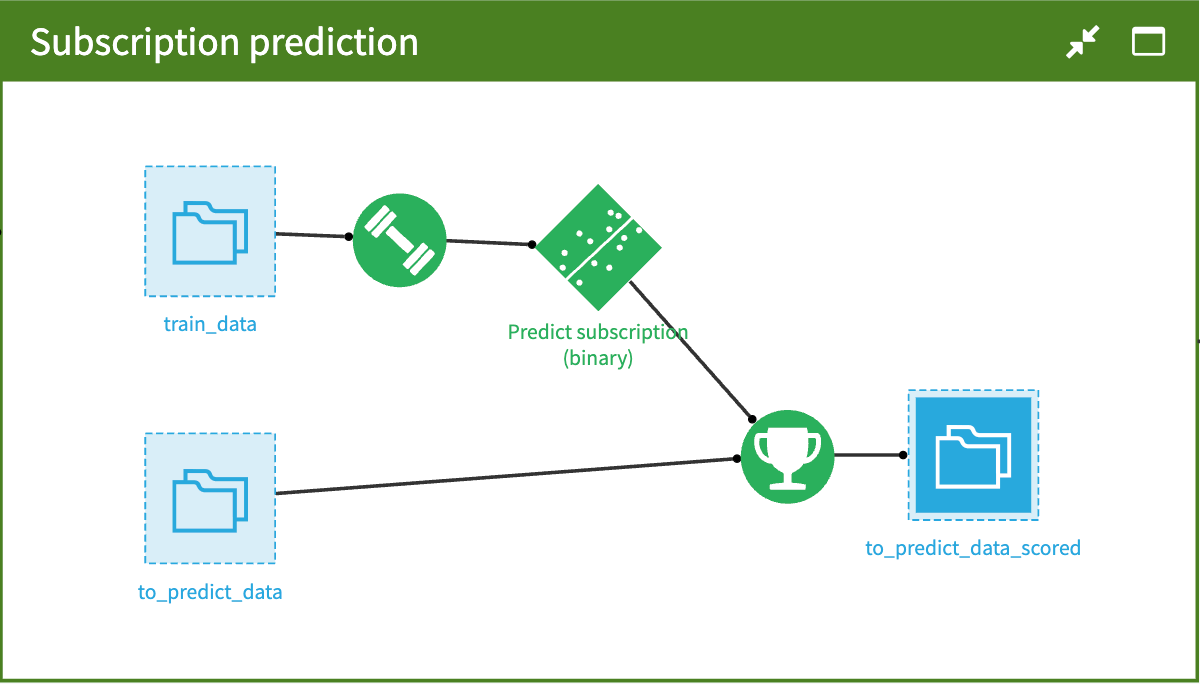
Predicting probability of subscription#
The Subscription Prediction zone creates the prediction of the subscription probability.
The classification model first orders the training dataset by the observation date column. The model is then trained on the first 80% of the data points in the train dataset and tested on the remaining 20%.
The Score recipe applies the regression model to the dataset containing the values to predict (to_predict_data) and generate the predicted values.
Note
To address imbalanced values in the subscription variable, the model performs class rebalancing. This involves randomly selecting approximately 100k rows to rebalance all modalities of a column equally. Users can customize the parameters for this sampling method in the Flow.
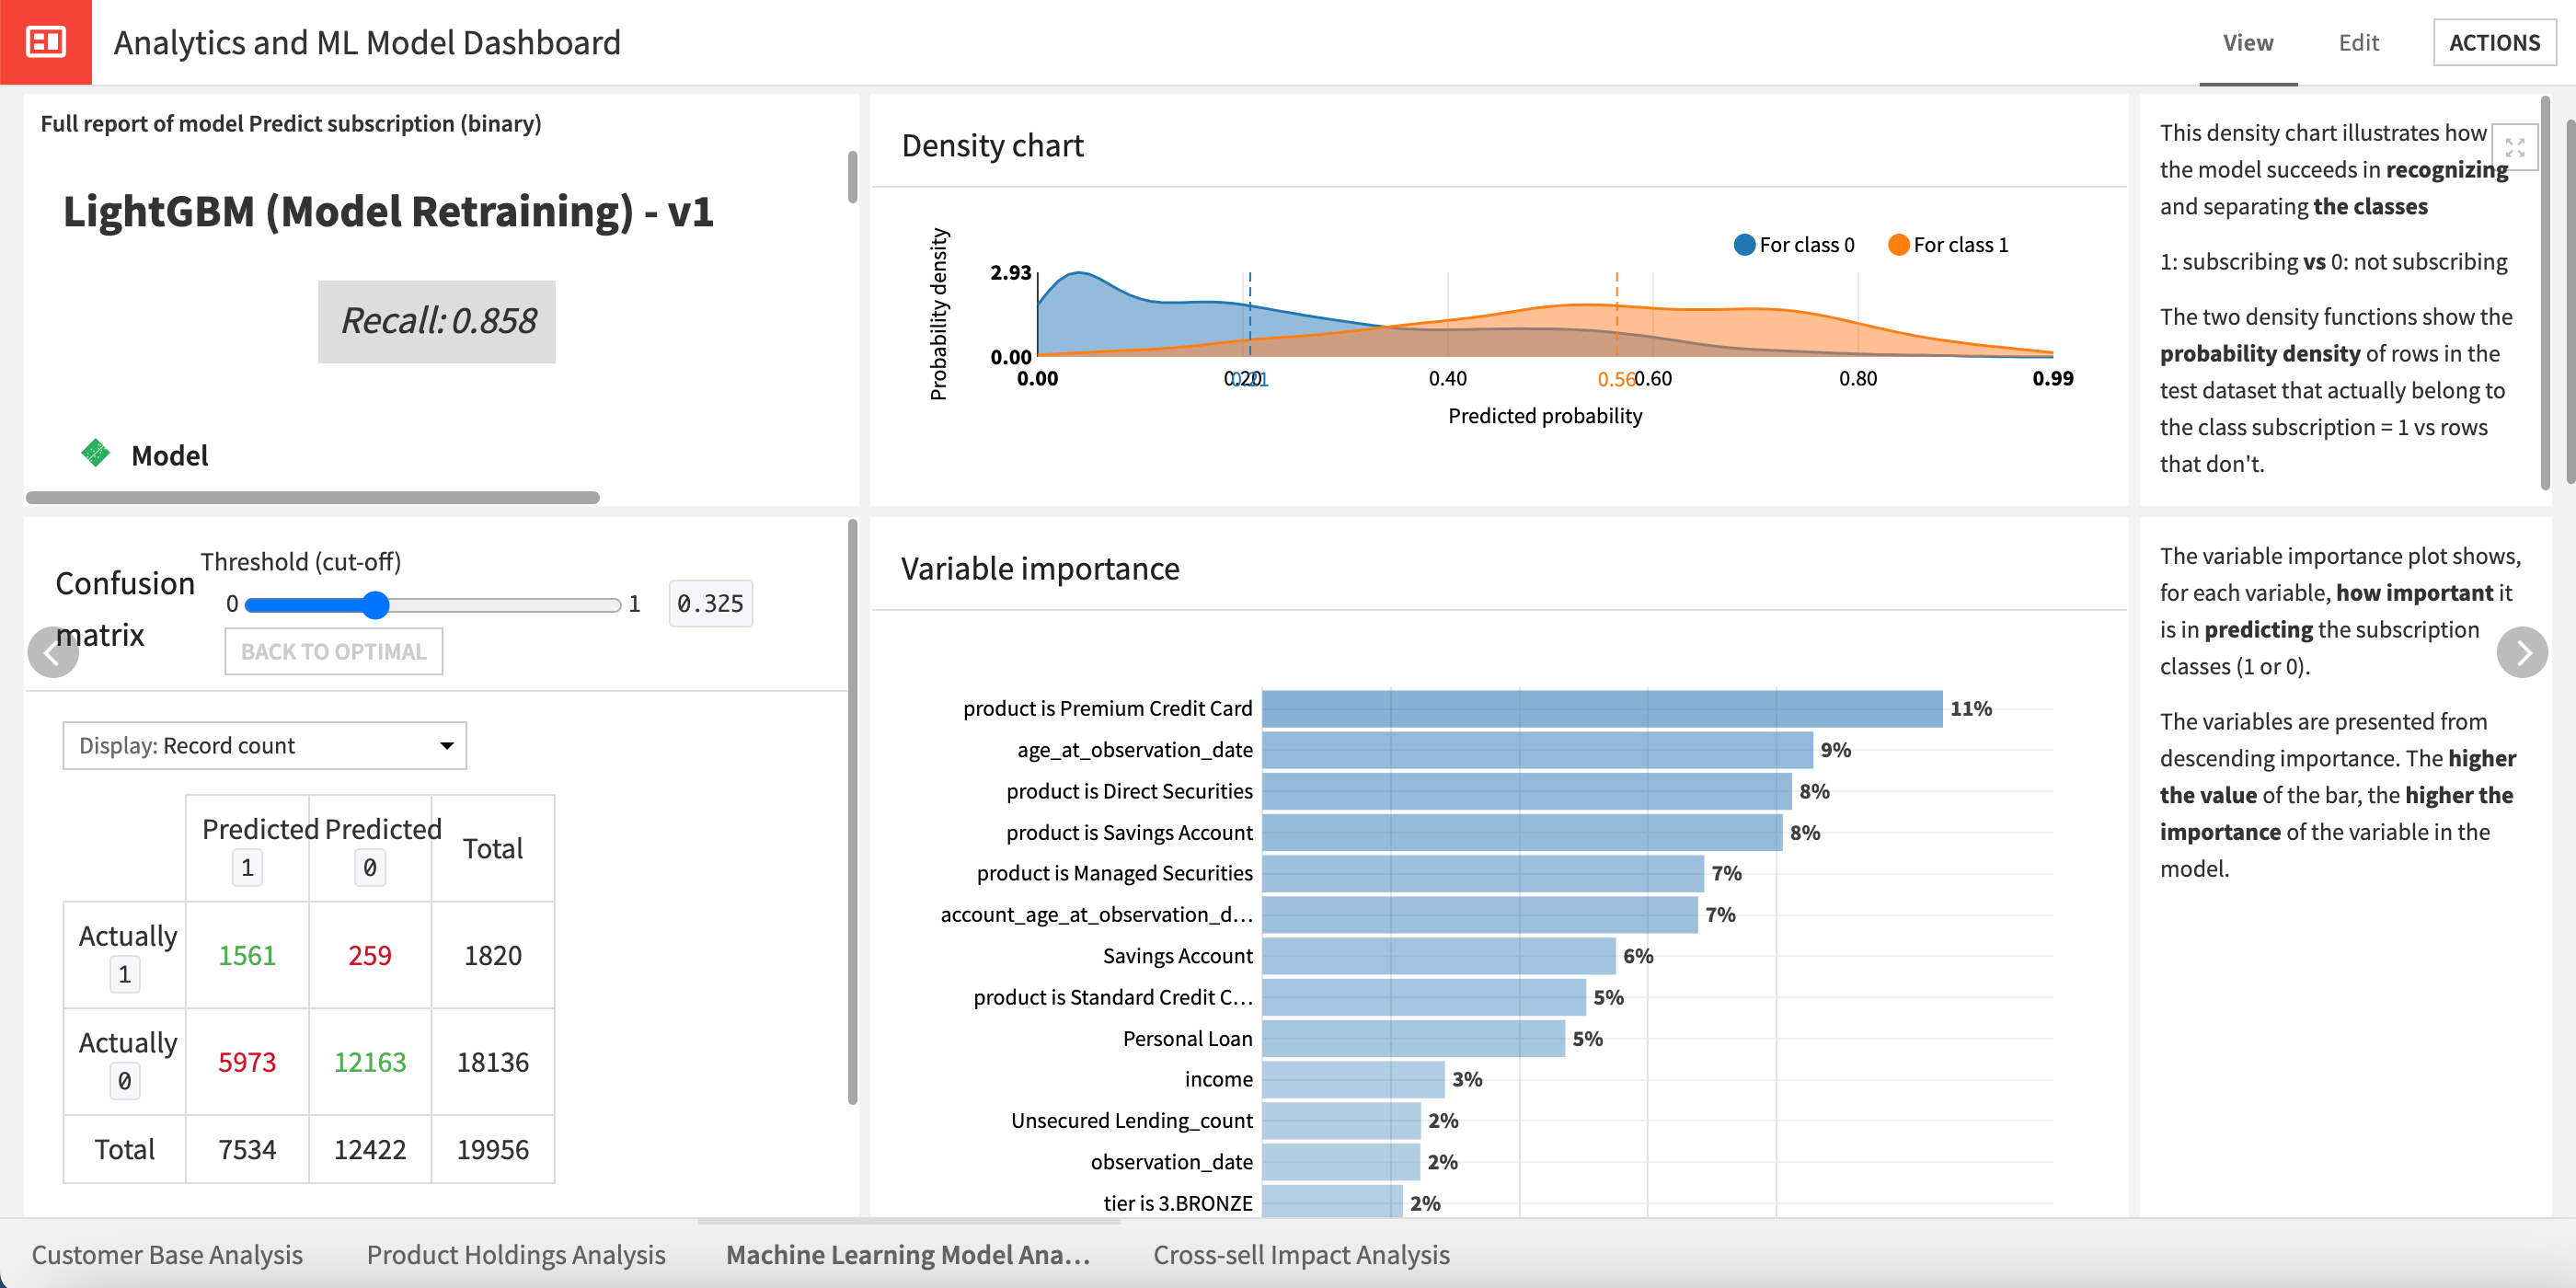
Visualize model performance#
In the same dashboard as the previously mentioned Exploring Input Data section, you can find a third page, named Machine learning model analysis, to visualize the explainability and performance of the classification model built to compute the subscription probability prediction.
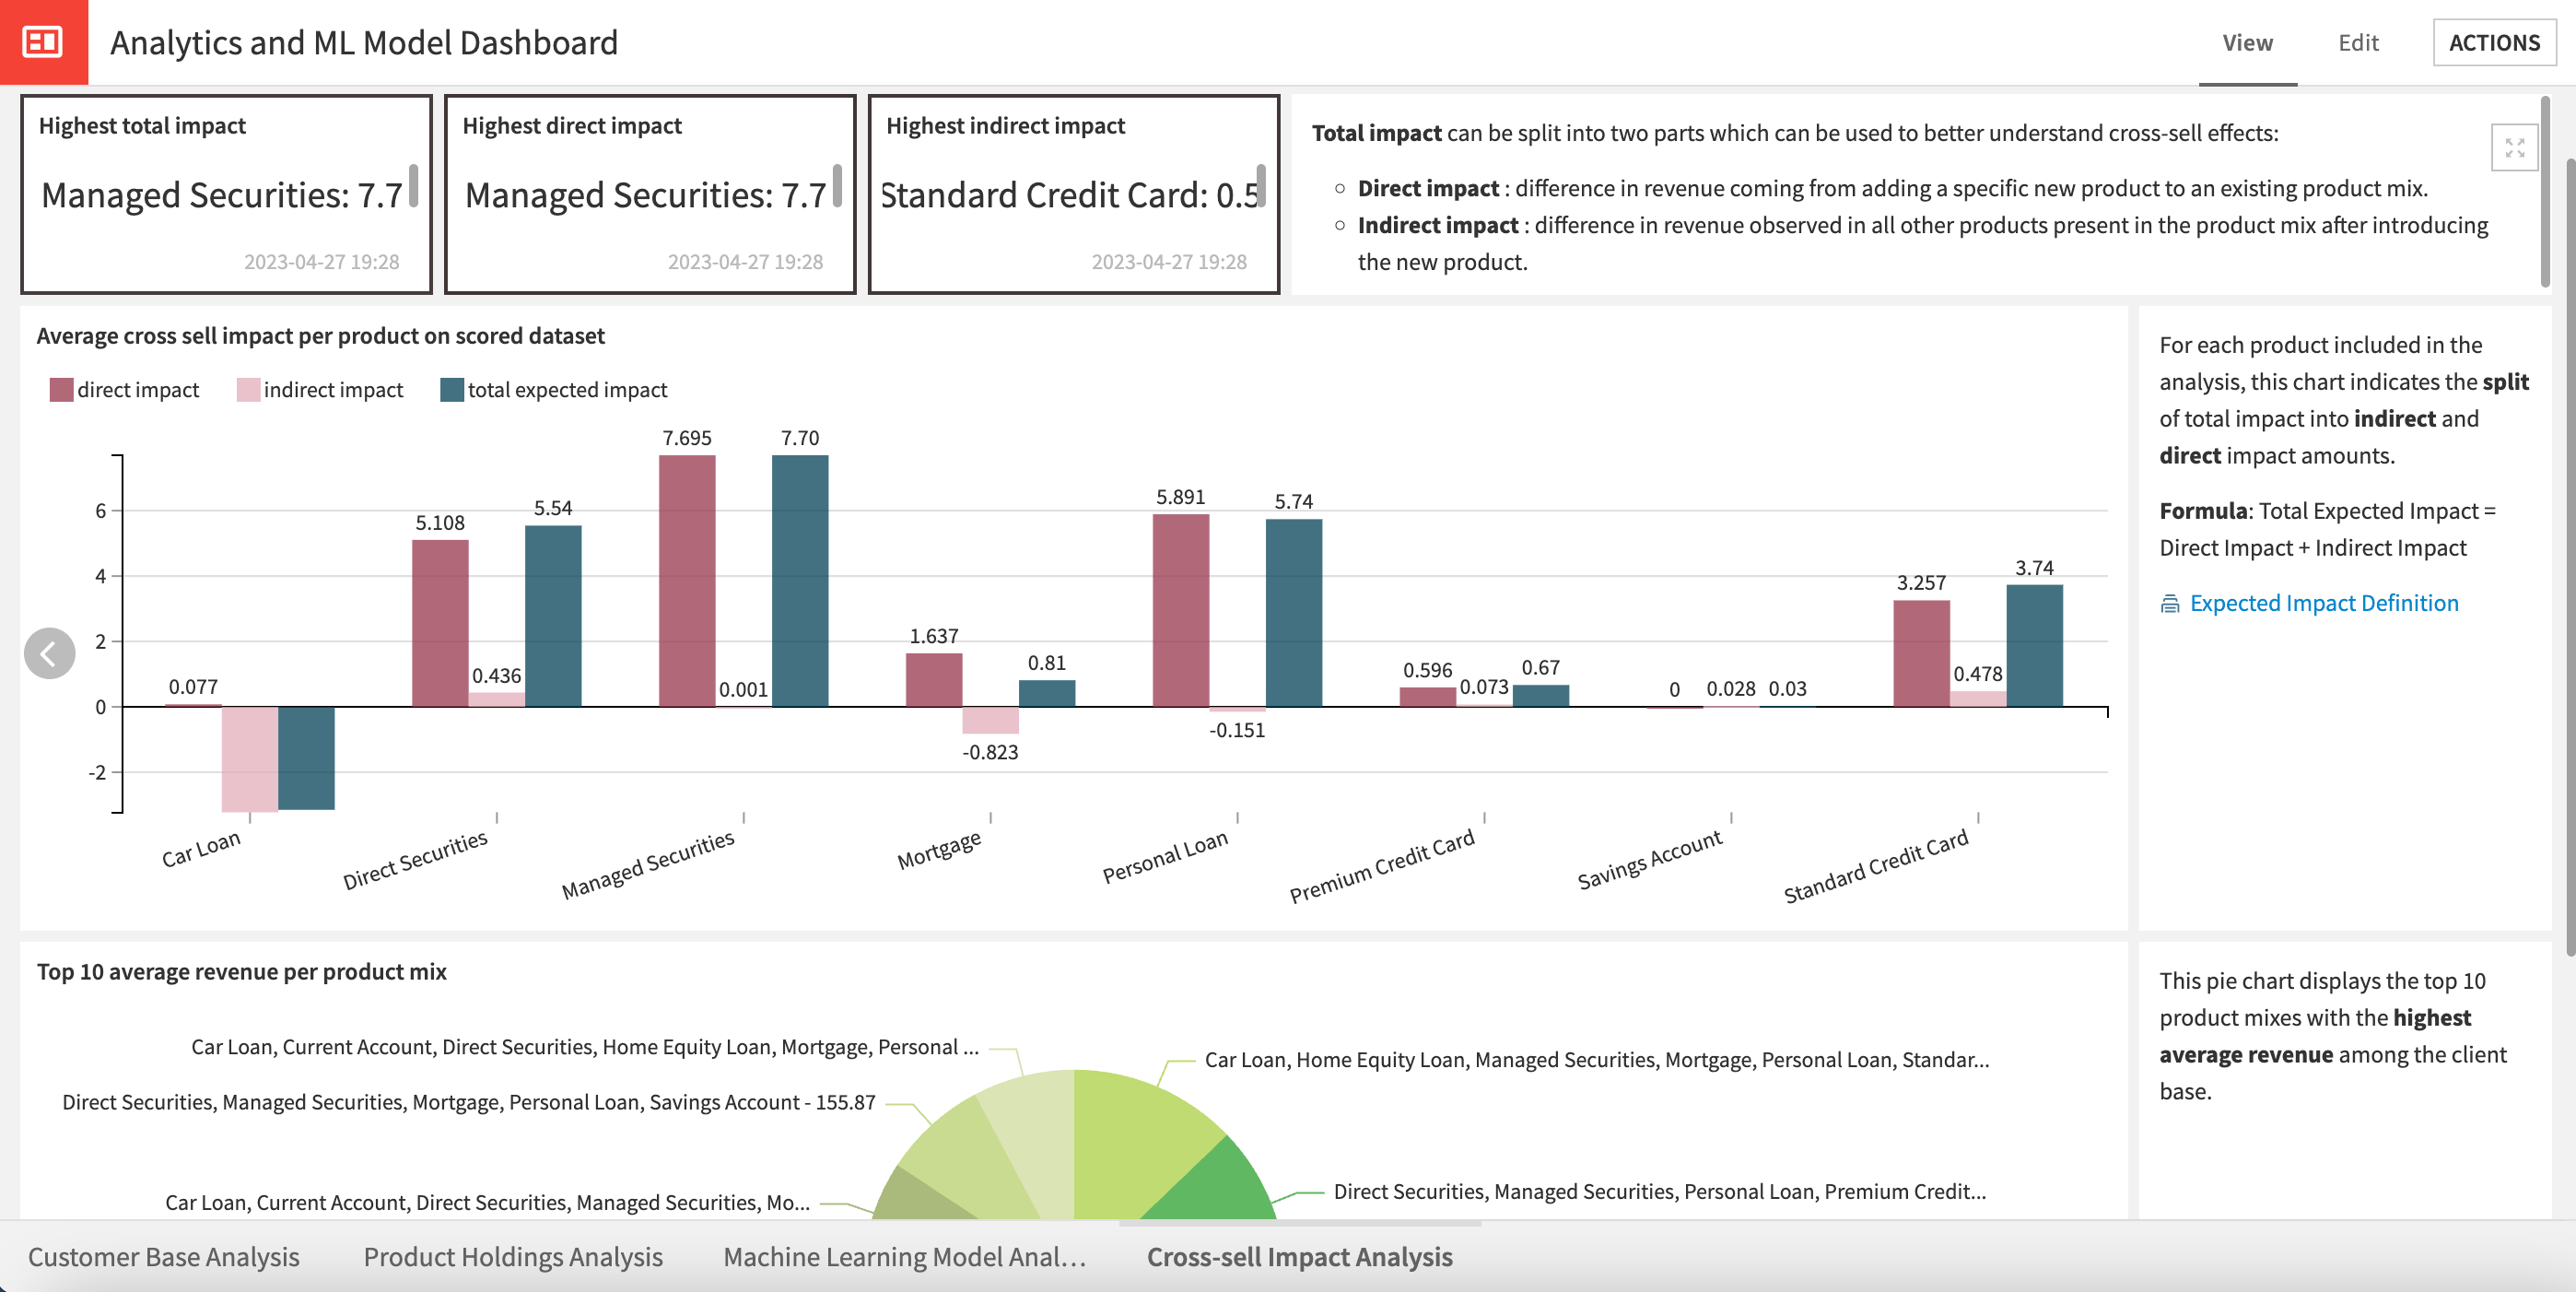
Exploring cross-sell impact#
The last page of the Analytics and ML Model Dashboard allows for understanding the effect of offering additional products to customers on the sales of existing products.
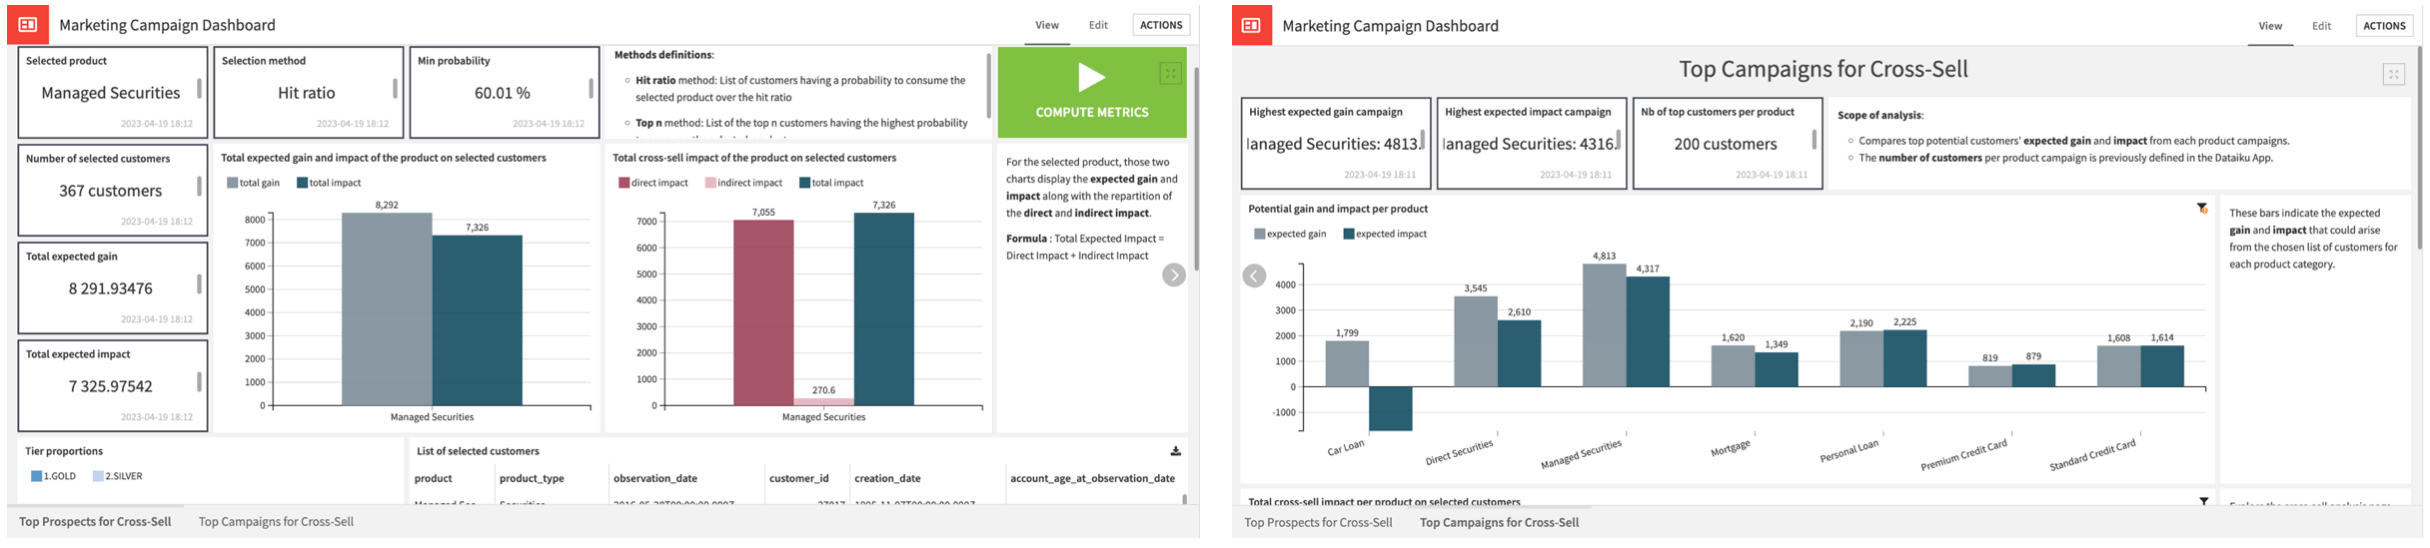
Marketing campaign dashboard#
The Marketing Campaign Dashboard covers the following topics across two pages.
Page |
Description |
|---|---|
Top Prospects for Cross-Sell |
Displays information regarding the list of top customers, which were selected based on the parameters configured within the Project Setup. |
Top Campaigns for Cross-Sell |
Presents a comparison of the gain and impact associated with each product analyzed based on the parameters configured within the Project Setup. |
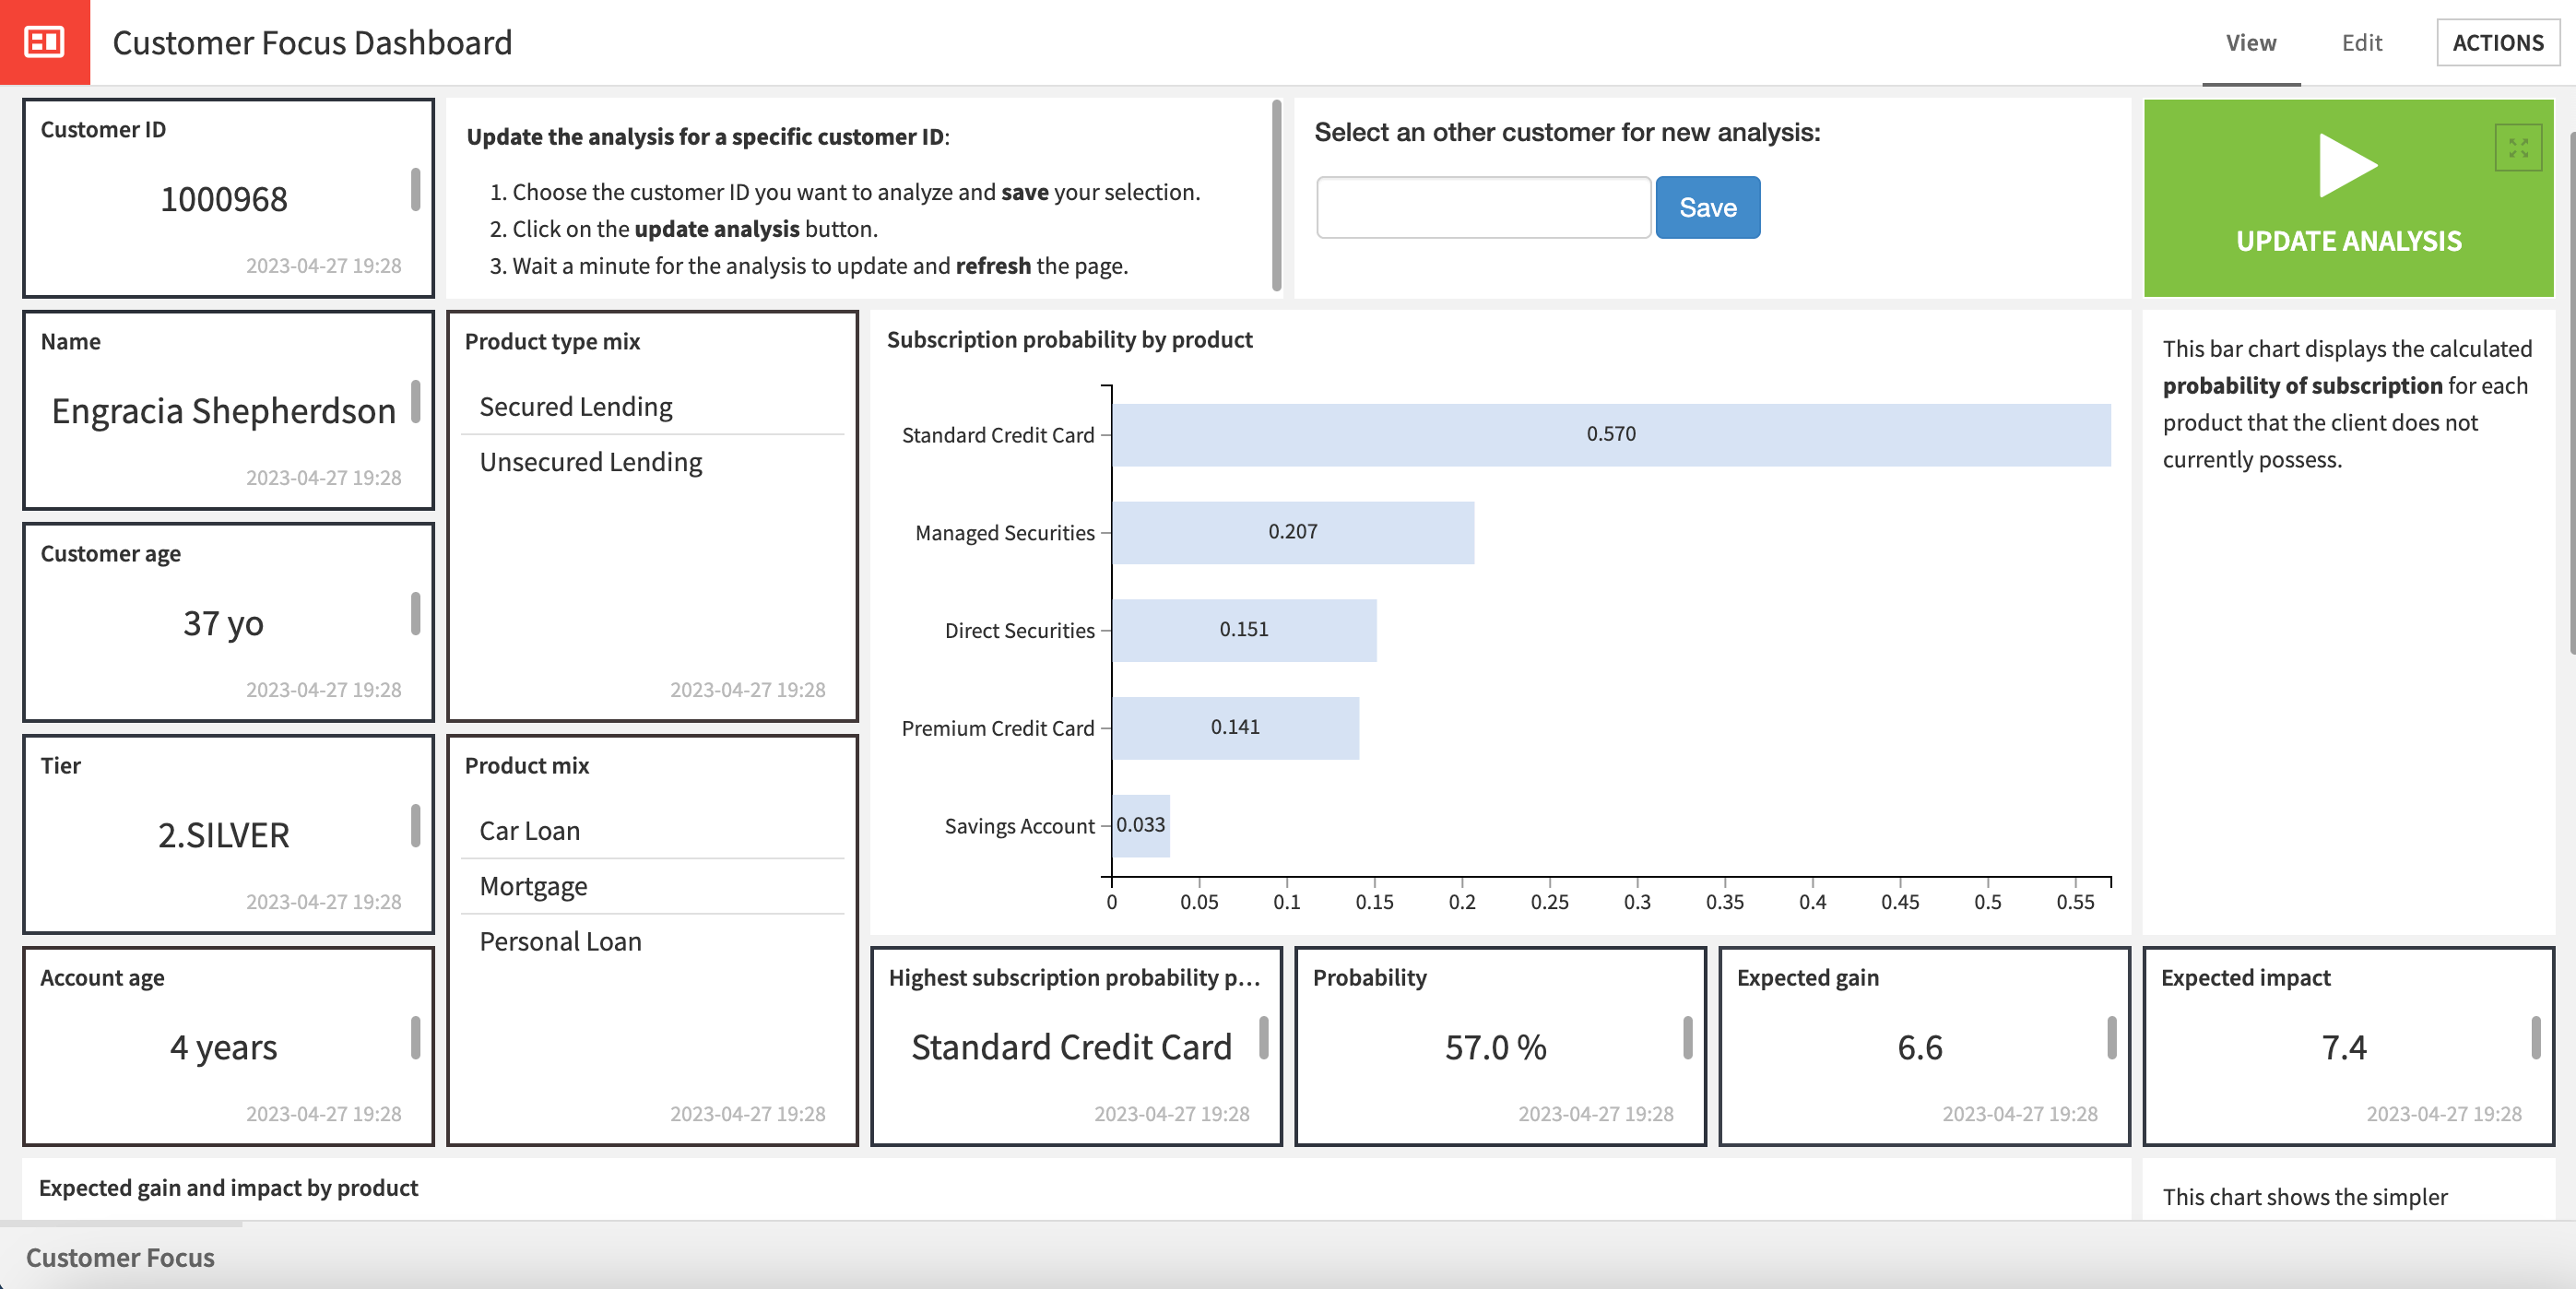
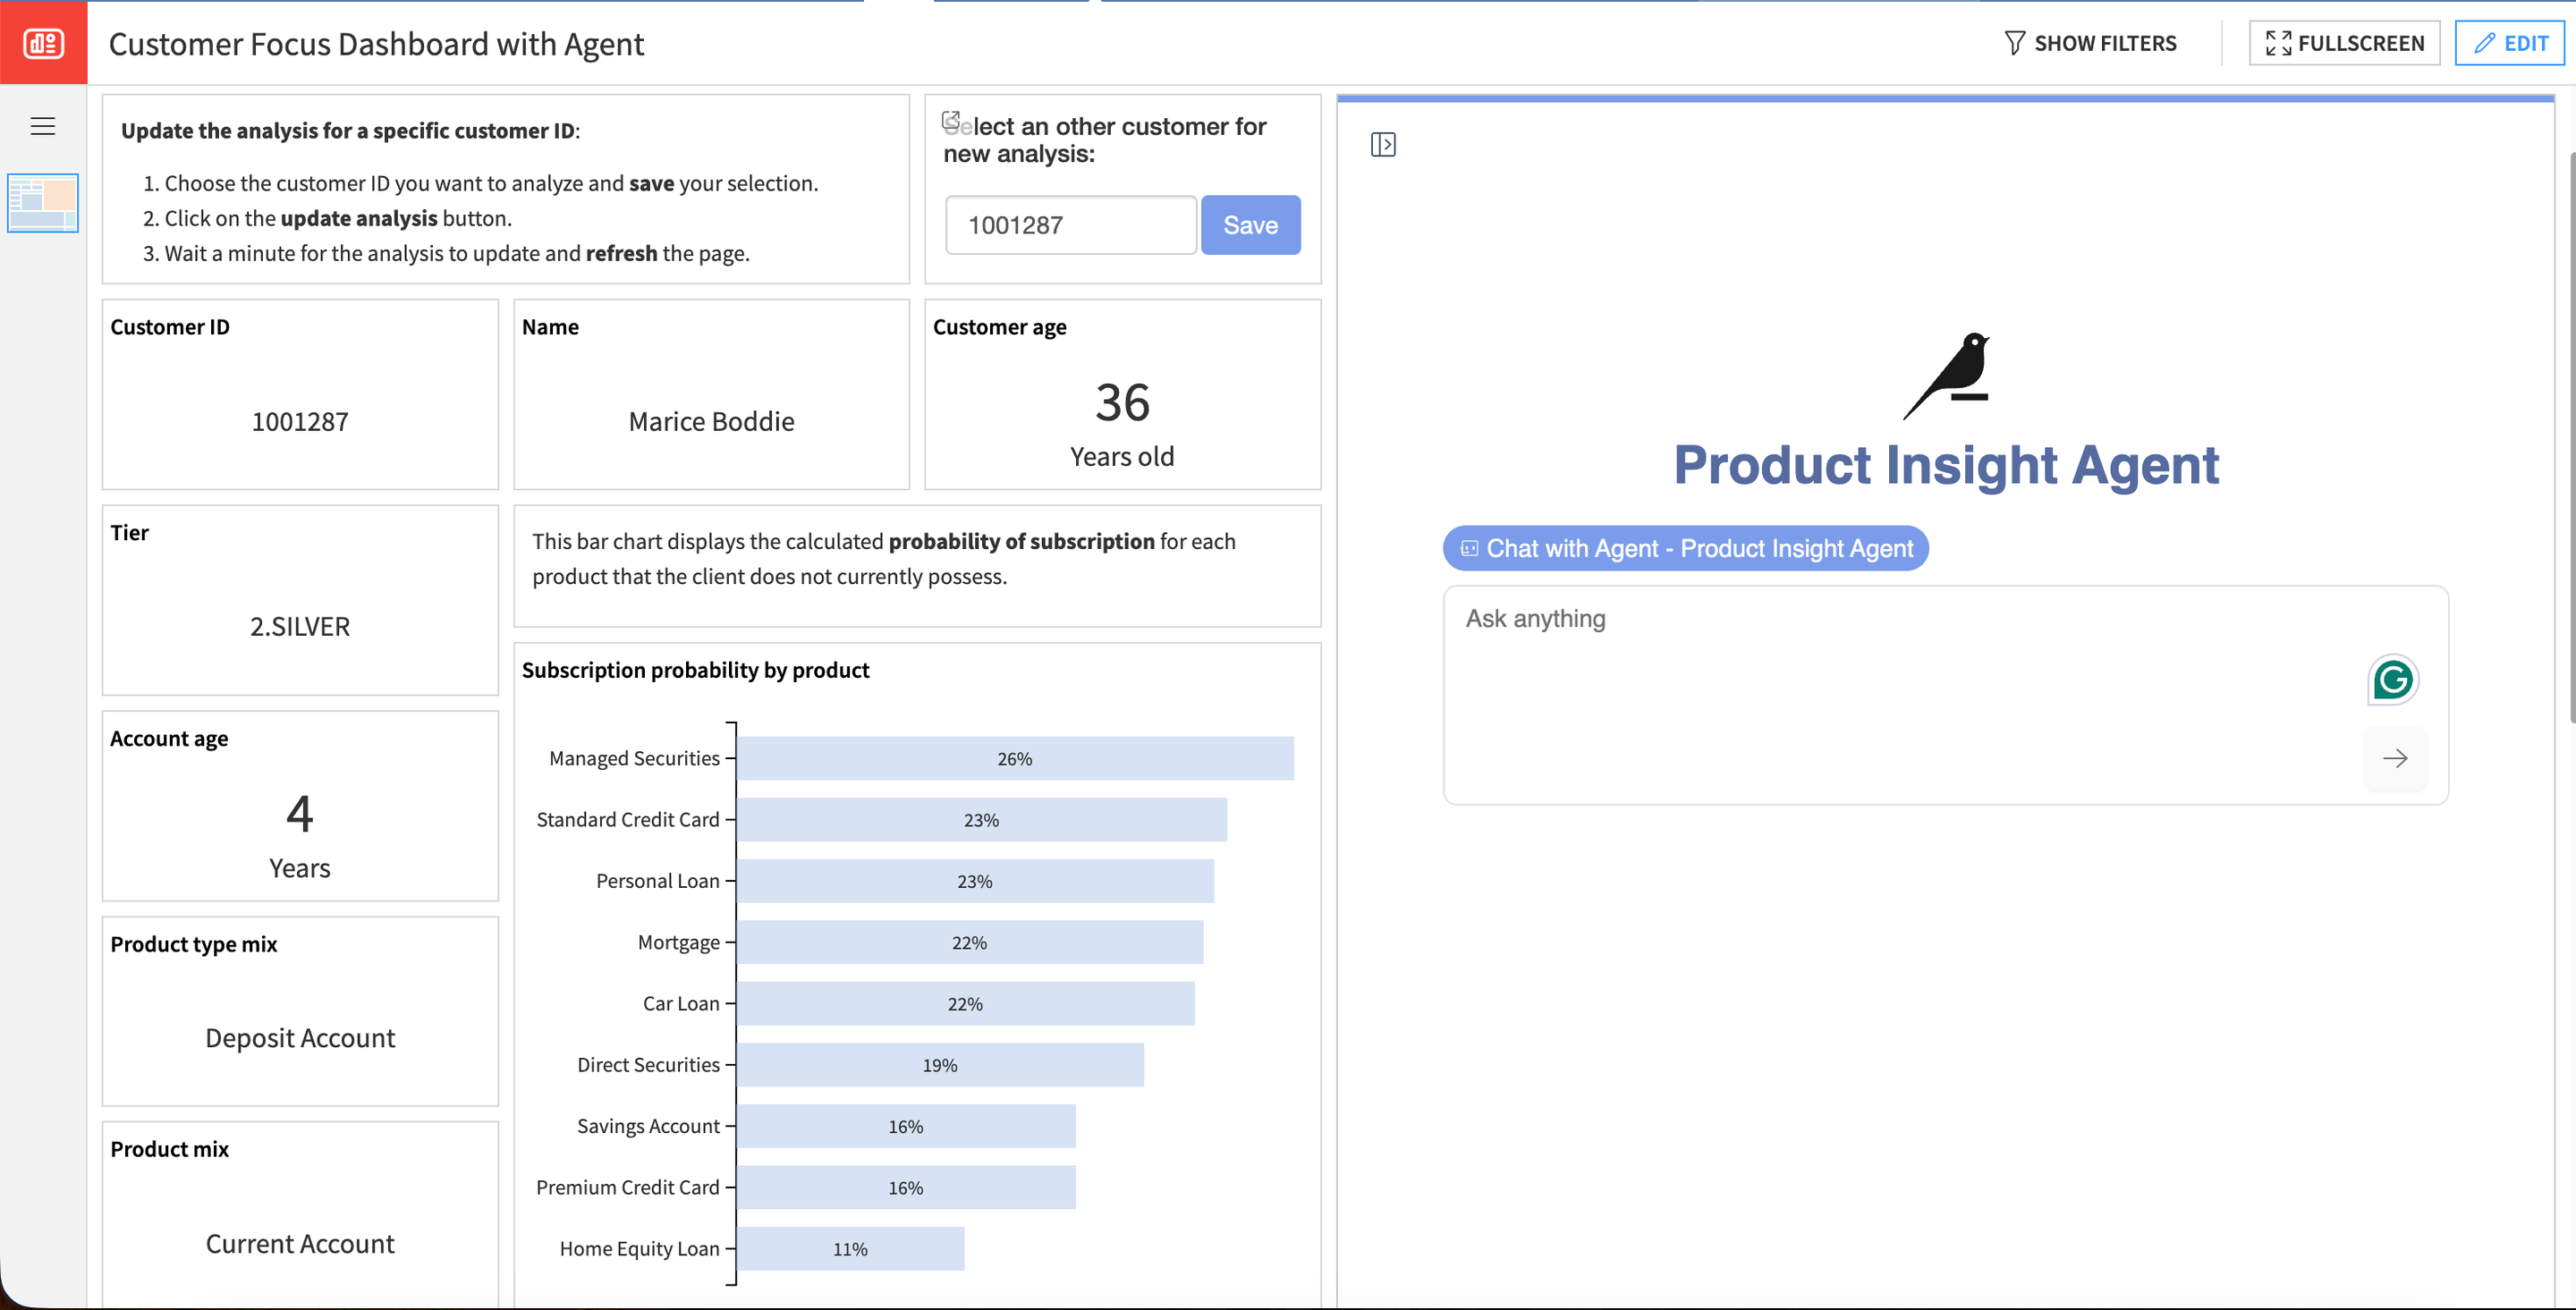
Customer focus dashboard#
The Customer Focus Dashboard offers specific information about a chosen customer. To find a particular customer and adjust the analysis, users can use the search engine at the top of the page to select a customer ID and update the visuals.
Optional agentic module#
This project features an optional intelligent agent that enables users to retrieve information on customers, products, and Next Best Offer results. Leveraging this analysis, the agent can then draft and send targeted emails to customers.
This agent can be used through the Customer Focus Dashboard with Agent.
Responsible AI considerations#
The Next Best Offer Solution is designed to serve as a powerful marketing campaign targeting tool. However, you shouldn’t use it for the distribution of offers or promotions to a select group of customers. Misusing this Solution in such a manner may lead to unintended consequences, such as the unfair treatment of certain customers.
Reproducing these processes with minimal effort for your data#
This documentation has provided several suggestions on how to derive value from this Solution. Ultimately however, the “best” approach will depend on your specific needs and data. If you’re interested in adapting this project to the specific goals and needs of your organization, Dataiku offers roll-out and customization services on demand.