Solution | Social Determinants of Health#
Overview#
Business case#
Social determinants of health (SDOH) are the conditions and environment where people live, learn, work, and play that affect a wide range of health and quality-of life-risks and outcomes. Research has shown that SDOH can account for up to 90% of health outcomes, whereas medical care accounts for only 10%-15%.
Understanding the social factors associated with the prevalence of health measures (including chronic diseases, behaviors, and outcomes) aligns with social responsibility programs. It can also deliver return on investment with improved patient outcomes by:
Identifying resources, therapeutics, and interventions for populations incorporating both social and disease risk vulnerabilities
Developing responsible patient-centric risk-adjusted payment or care models to ensure health equity
Impacting operational/spending/quality metrics for both precision preventative care and therapeutic access equity
Hospitals, public and private health services systems, health insurers, government agencies, and pharmaceutical and medical device companies are all increasingly tasked to leverage population/community health insights of social vulnerabilities tied to health measure prevalence to inform business practices to address health/disease and therapeutic access disparities.
With this Solution, healthcare and life science professionals accelerate the discovery of how SDOH disparities affect at-risk populations, allowing refined market access strategies for drug manufacturers, new coverage policies from payers, and improved facility outreach and care programs from health services.
Installation#
From the Design homepage of a Dataiku instance connected to the internet, click + Dataiku Solutions.
Search for and select Social Determinants of Health.
If needed, change the folder into which the Solution will be installed, and click Install.
Follow the modal to either install the technical prerequisites below or request an admin to do it for you.
From the Design homepage of a Dataiku instance connected to the internet, click + New Project.
Select Dataiku Solutions.
Search for and select Social Determinants of Health.
Follow the modal to either install the technical prerequisites below or request an admin to do it for you.
Note
Alternatively, download the Solution’s .zip project file, and import it to your Dataiku instance as a new project.
Technical requirements#
To use this Solution, you must meet the following requirements:
Have access to a Dataiku 13.2+* instance.
To access the Census Data through an API service, the user is required to generate an API key.
A Python 3.9 code environment named
solution_soc-determinants-healthwith the following required packages:
sodapy==2.1.1
Flask==3.0.0
Shapely==1.8.5.post1
topojson==1.7
geojson-rewind==1.1.0
requests<3
Data requirements#
This Solution calls data from the relevant API interface through live endpoints. There are two sets of data:
The Census Data - SVI factors Flow zone calls data from the American Community Survey 5-Year Data (2009-2022) into 17 different datasets. This Flow zone also contains the Census_SVI_Datasets managed folder containing the official dictionary file CDC:ATSDR SVI 2022.pdf. All the input data features, names, meanings, value mapping, and computations follow the guidelines of this document.
The CDC Disease Data Flow zone calls data from the Centers for Disease Control and Prevention.
You can upload your own community health measure data through a Dataiku app or directly to the New Health Measure Flow zone and generate the SDOH analysis. The required data schema is specified on the project wiki.
Workflow overview#
You can follow the Solution in the Dataiku gallery.
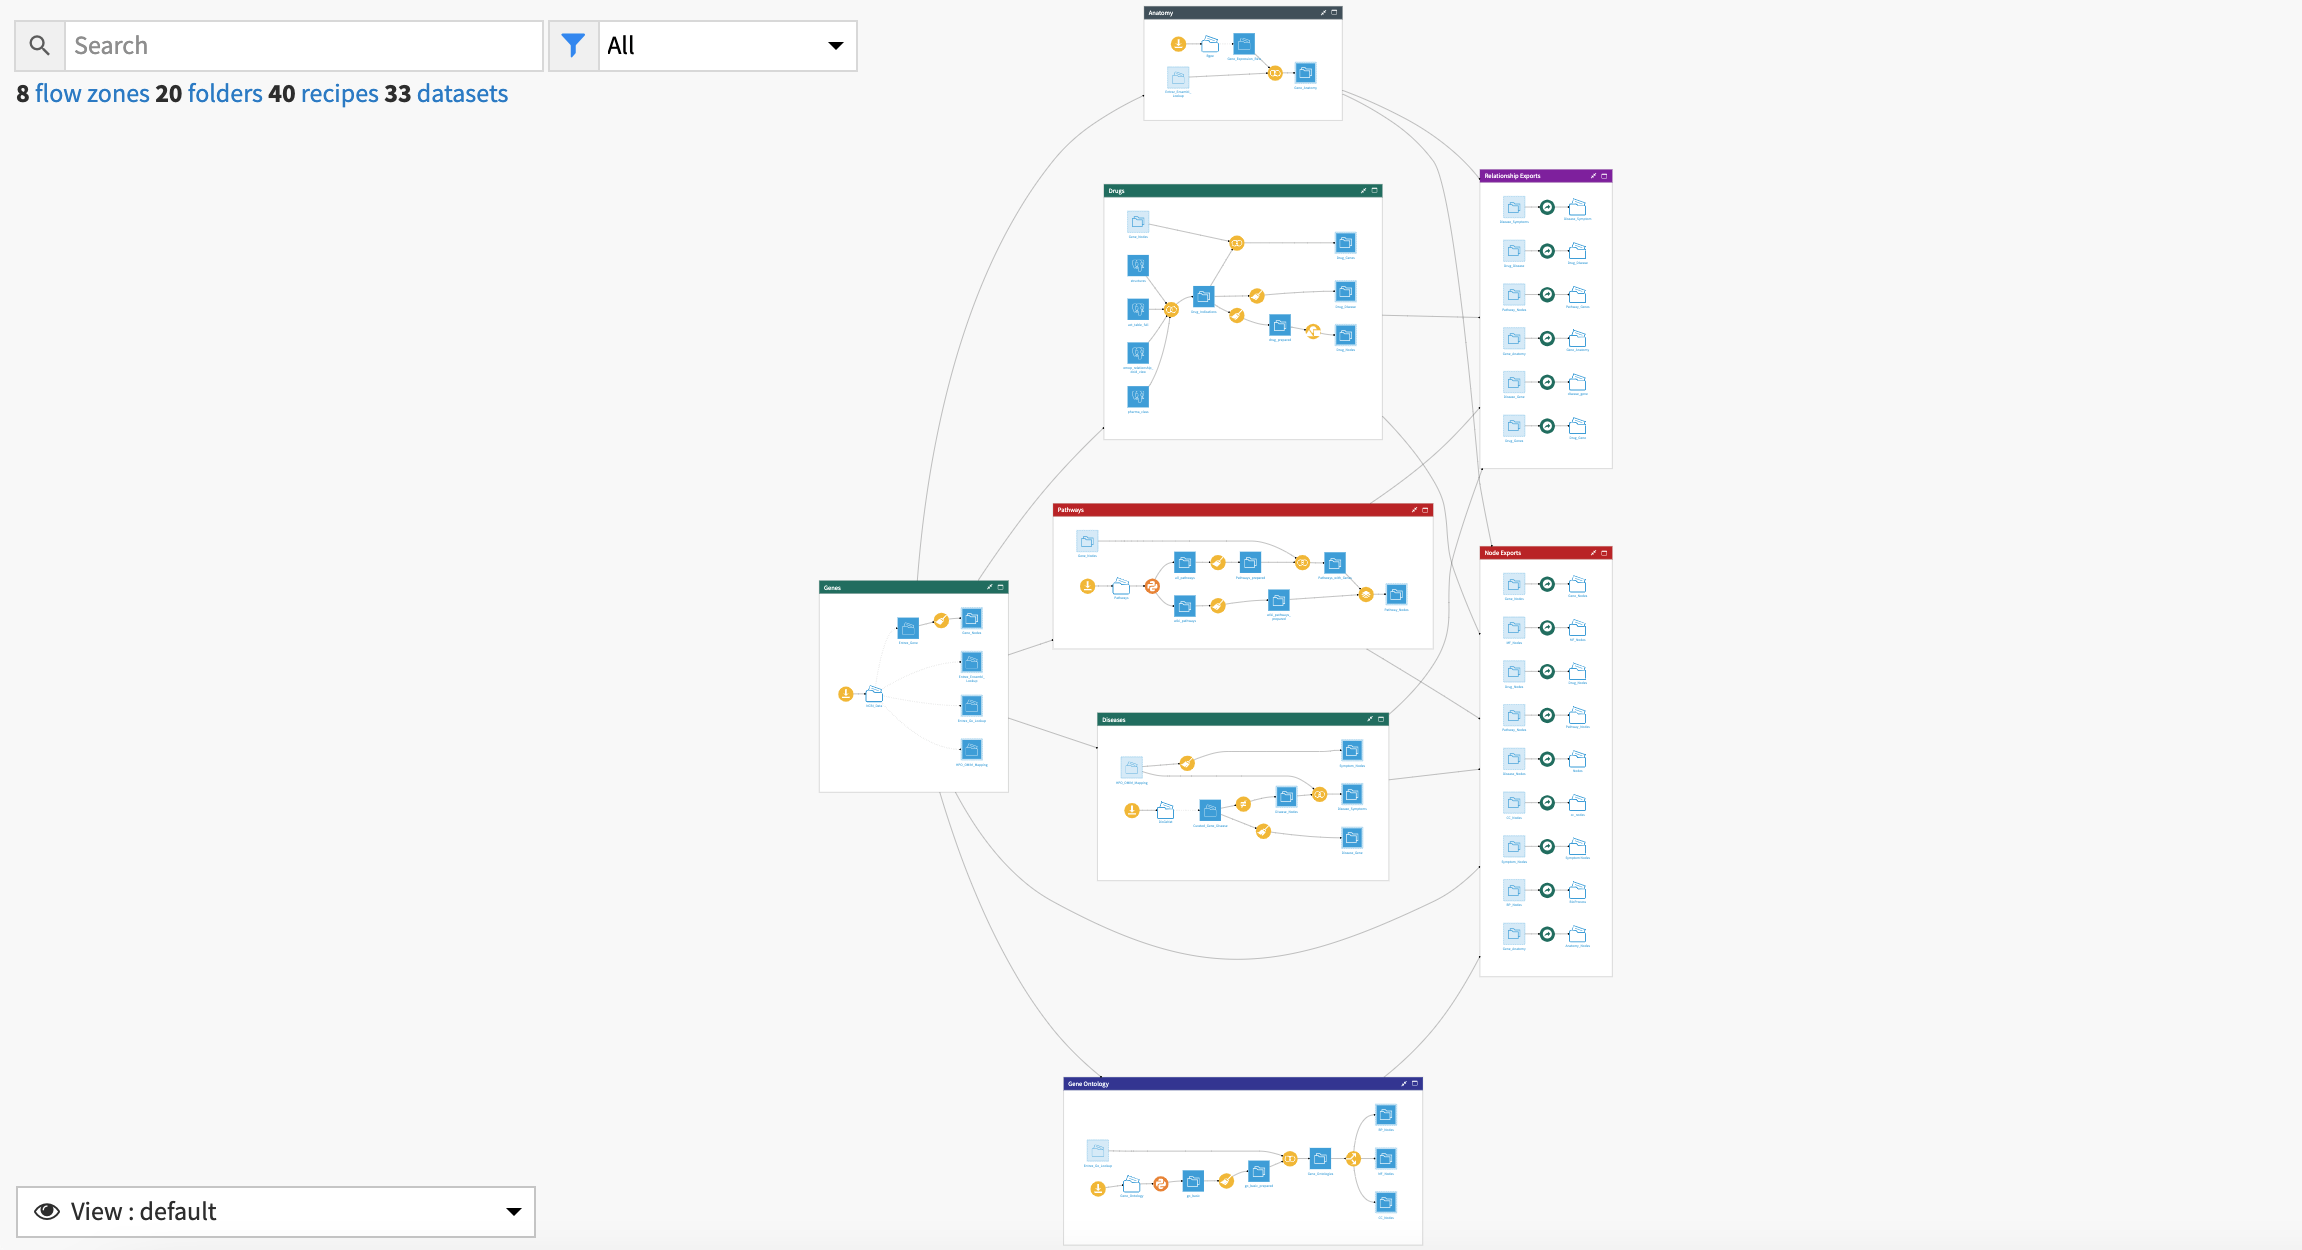
The project has the following high-level steps:
Ingest publicly available data.
Prepare and clean data for analysis.
Apply regression analysis to understand better how social factors are associated with rates of chronic diseases.
Use clustering analysis for insights about areas with undetected/prevalent diseases.
Upload new health measure data and extend the pre-built analysis.
Build and explore Solution outputs via dashboards.
Apply rigorous responsible AI ethics for future modeling approaches.
Walkthrough#
Note
In addition to reading this document, it’s recommended to read the wiki of the project before beginning to get a deeper technical understanding of how this Solution was created and more detailed explanations of Solution-specific vocabulary.
Building the full Flow#
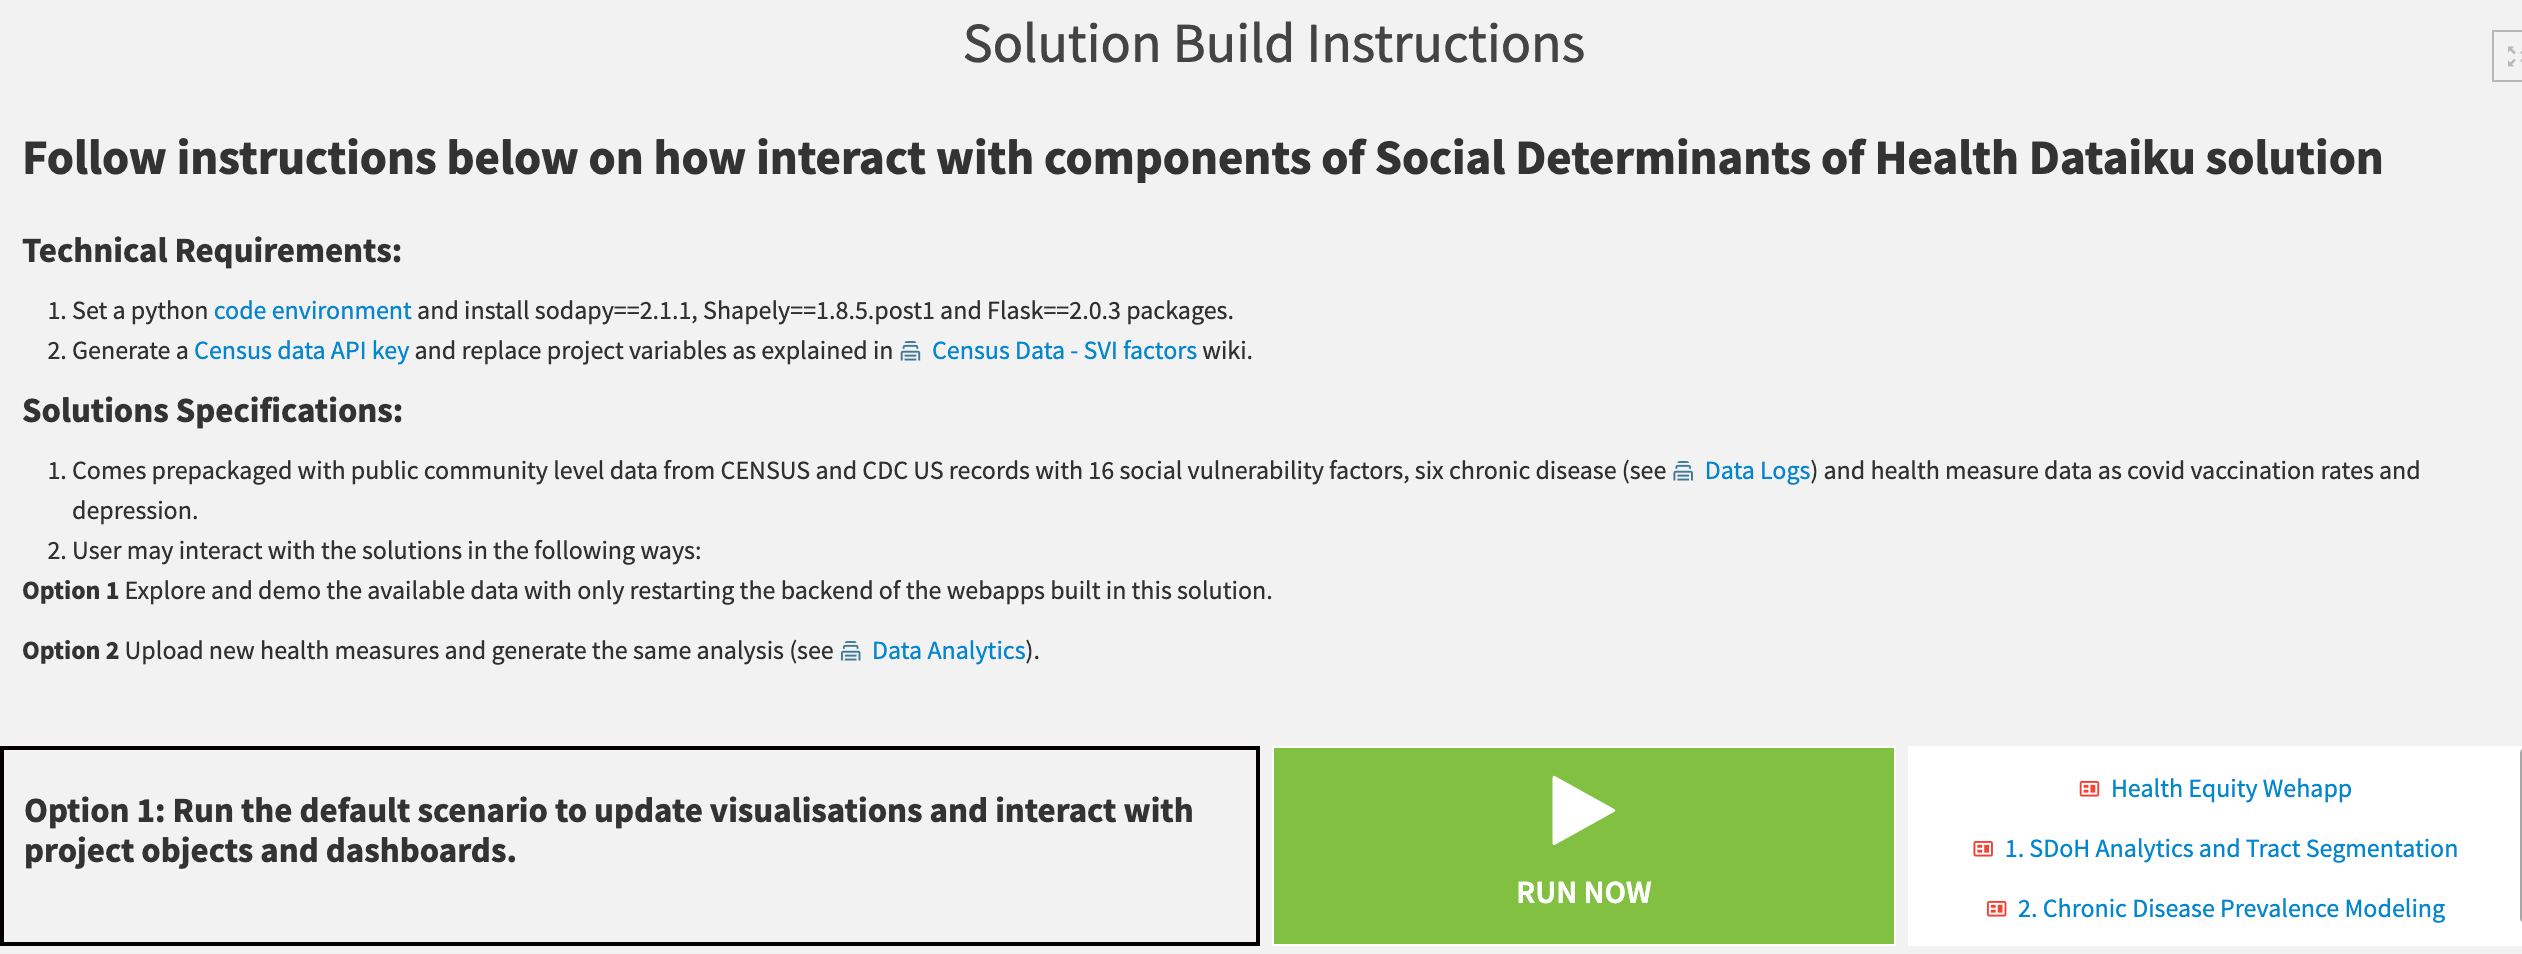
To ease the usage of this Solution, it comes with three pre-built Dashboards. The User Manual - Solution Build provides instructions and scenarios that recursively build all Solution components from data ingestion, processing, regression, segmentation, and visualization.
It’s necessary to prepare your data format when uploading new health measures and follow the scenario order for building the analysis at the county or tract level. You should generate an API key into the project variables to recall the public data. The public data in this Solution only updates yearly, and scenarios are only required to run then.
The user has the following options for interacting with the Solution:
Explore and demo the prepackaged public community-level data.
Upload new data at the county or tract level and automatically build the analysis and visualization deliverables.
Running the first scenario in the User Manual - Solution Build Dashboard will update all the visualizations for the publicly pre-packaged data and restart the webapps backend. Health Equity Webapp, SDOH Analytics and Tract Segmentation and Chronic Disease Prevalence Modeling Dashboards showcase the SDOH analysis for chronic diseases such as diabetes, cancer (except skin), current asthma, and chronic kidney, preventive measures such as COVID-19 vaccination rates and health outcomes such as depression with input records from Census Data - SVI factors, CDC Data and Metadata Flow zones.
Discover US community patterns of chronic disease prevalence and social vulnerability#
Health Equity interactive Webapp includes a US map outlining Census counties (or tracts based on individual county regional selection) colored by the selected health measure prevalence, a scatter plot of community-level social vulnerability theme rankings vs. health prevalence rankings, and a table of individual records.
Selecting counties or tracts (depending on filter selection) within the scatter plot via a box or lasso select dynamically displays the corresponding records in the table below from data preprocessing and feature generation Flow zones.
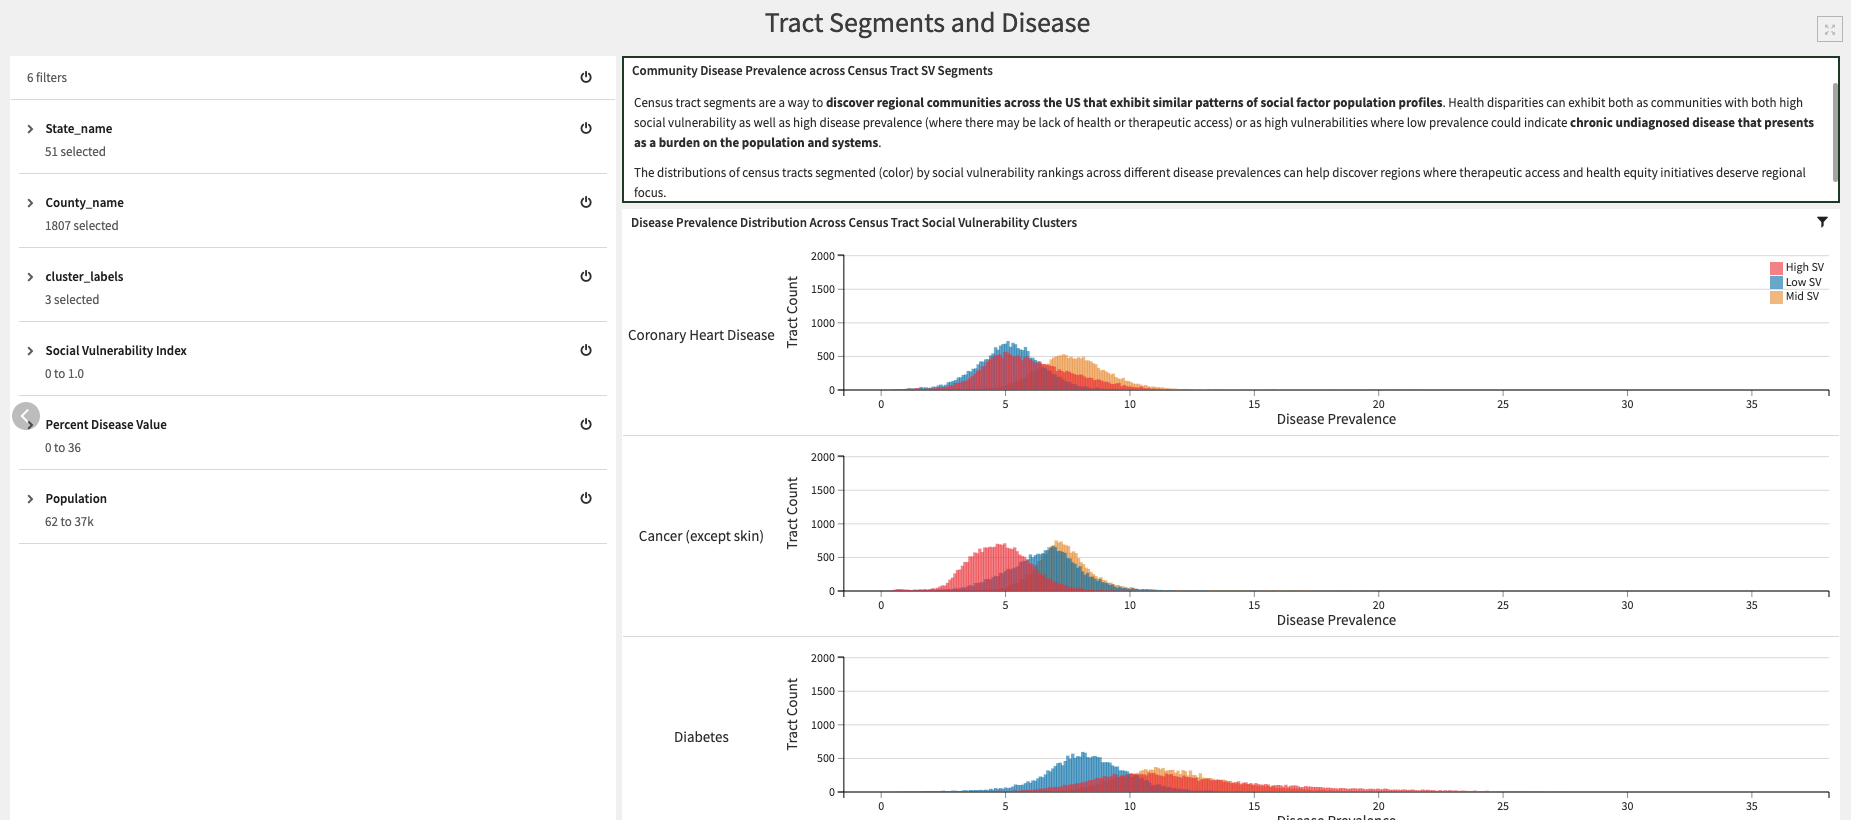
Two tabs are built into the SDOH Analytics and Tract Segmentation Dashboard. The first tab Census Tract Segmentation enables users to better understand ML-driven tract segmentation solely based on Social Vulnerability percentile values through various model explainability visualizations. The second tab, Tract Segments and Disease, shows how the distribution of tracts by segments corresponds to each disease prevalence.
Visualize associations with social vulnerability factors across areas and populations#
The Chronic Disease Prevalence Modeling Dashboard shows two tabs.
Tab |
Description |
|---|---|
Disease Prevalence Model Summary |
Includes a standard webapp where you can select and save a disease for analysis before pressing the Run button to the right. This button will trigger a scenario that activates the Regression Model corresponding to the selected condition and updates the tab with that model’s Summary and Individual Explanations through interactive explainability charts. |
Census Tract Shapley Additive exPlanations (SHAP) |
Contains two charts that provide insights on how community social factors at a tract level impact that tract’s disease prevalence prediction. You can use filters to refine the scope of the visualizations. 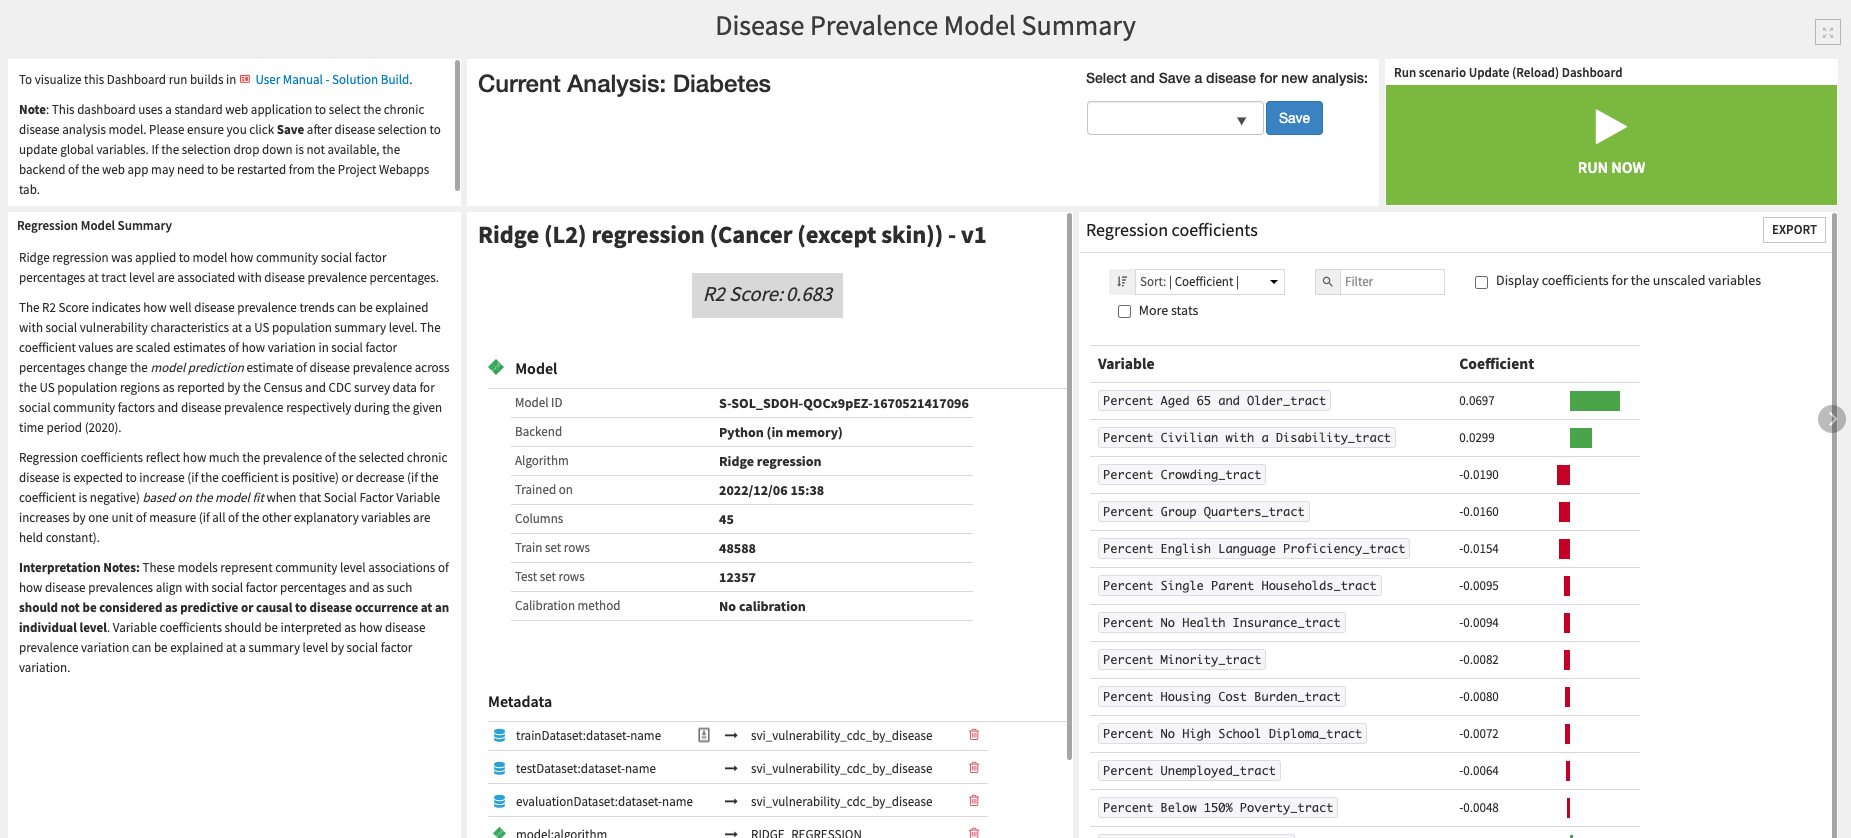
|
Plug your own health measure community level data and drive social determinants of health#
Explore and extend the pre-built SDOH analysis by uploading new health measure prevalences at the US Census county and/or tract level. There are two possible ways to interact with this Solution dynamically.
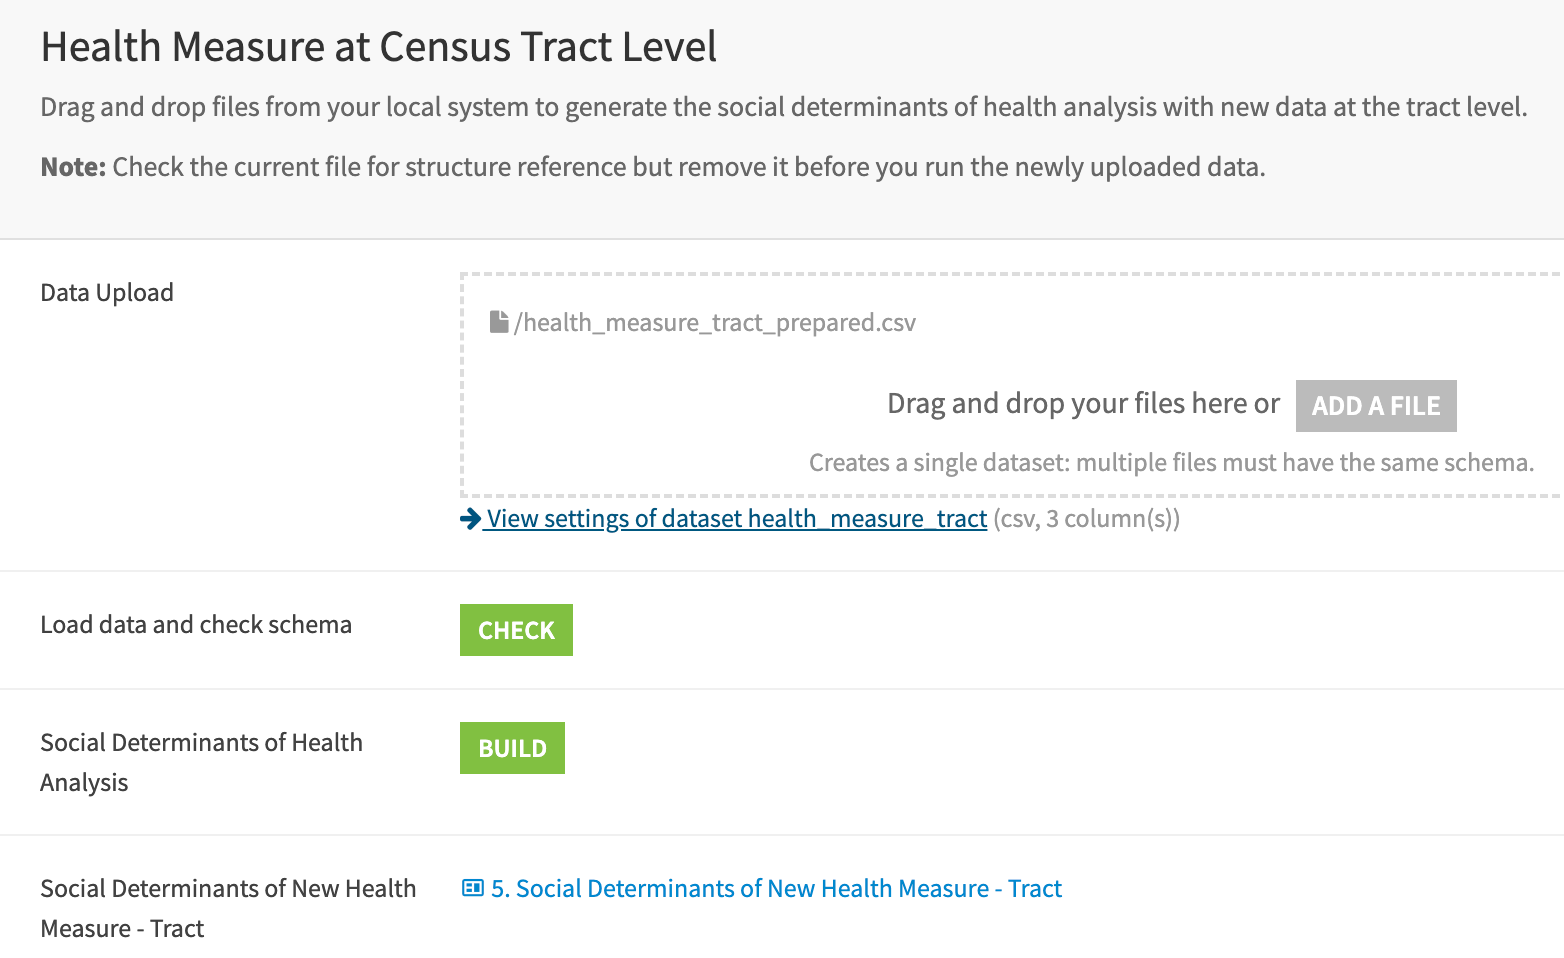
Following the instructions on the User Manual - Solution Build Dashboard, the user may replace health_measure_tract and/or health_measure_county datasets with a format that strictly complies with the required structure (see Dataiku app requirements). Similarly, with the pre-built visualizations, the scenarios Tract Check Schema and Build New Data must run subsequently (same for the county). The first one checks that the schema is valid. The latter builds all the necessary Flow zones to support new metrics generation and Regression Analysis for the uploaded health measures. The same scenario restarts the backend of the Health Equity Webapp, which is automatically updated with the new health measure prevalence information.

Users may directly interact with the Dataiku app that accesses the SDOH Solution and creates a new interactive instance. Like the User Manual Dashboard, the prebuilt analysis is available for demos and exploration. The extended plug & play style functionality enables users to upload new data with minimal Flow interaction for targeted new health measure prevalence analysis with social vulnerability factors.
Responsible AI statement#
This Solution uses both analytics and ML-driven insights to help understand how patterns of social factors that characterize potentially vulnerable populations associate with chronic disease prevalence at regional population levels. You should always take care to ensure any interpretations include data considerations.
This is community-level survey data. You shouldn’t use it to support misleading attribution on how an individual person’s socioeconomic status, minority/ethnic background, or household situation predicts/informs potential disease occurrence or outcomes. Self-reported survey data is particularly subject to recall, social desirability, and non-response bias. Any decisions or actions driven by this analysis must consider these limitations that may influence the distribution of the data.
Moreover, you should use the disease associations relating to regional community-level characteristics to promote and prioritize health equity and therapeutic access instead of re-enforcing or deepening disparities or biases in the health and life sciences systems** where it’s deployed.
You can (and should) extend this Solution to include additional data such as HCP or pharmacy geolocation information. You might also include individual-level (de-identified) personal patient behavioral and clinical data in regions identified as areas of potential disparity.
You should apply a rigorous responsible AI ethics process to further models built for designing personalized patient-care journeys, health outreach programs, pricing considerations, or therapeutic delivery. This is to ensure no biases are propagated, all subpopulations are considered, and model interpretability and explainability are in place.
Reproduce these processes with minimal effort#
This project equips healthcare and life science professionals to understand how they can use Dataiku to accelerate the discovery of how SDOH disparities affect at-risk populations.
By creating a singular Solution that can benefit and influence the decisions of a variety of teams in a single organization or across multiple organizations, you can use immediate insights to refine market access strategies for drug manufacturers, create new coverage policies from payers and improve facility outreach and care programs from health services.
This documentation has provided several suggestions on how to derive value from this Solution. Ultimately however, the “best” approach will depend on your specific needs and data. If you’re interested in adapting this project to the specific goals and needs of your organization, Dataiku offers roll-out and customization services on demand.

