
Tutorial | Self-healing API service deployments on Kubernetes#
Get started#
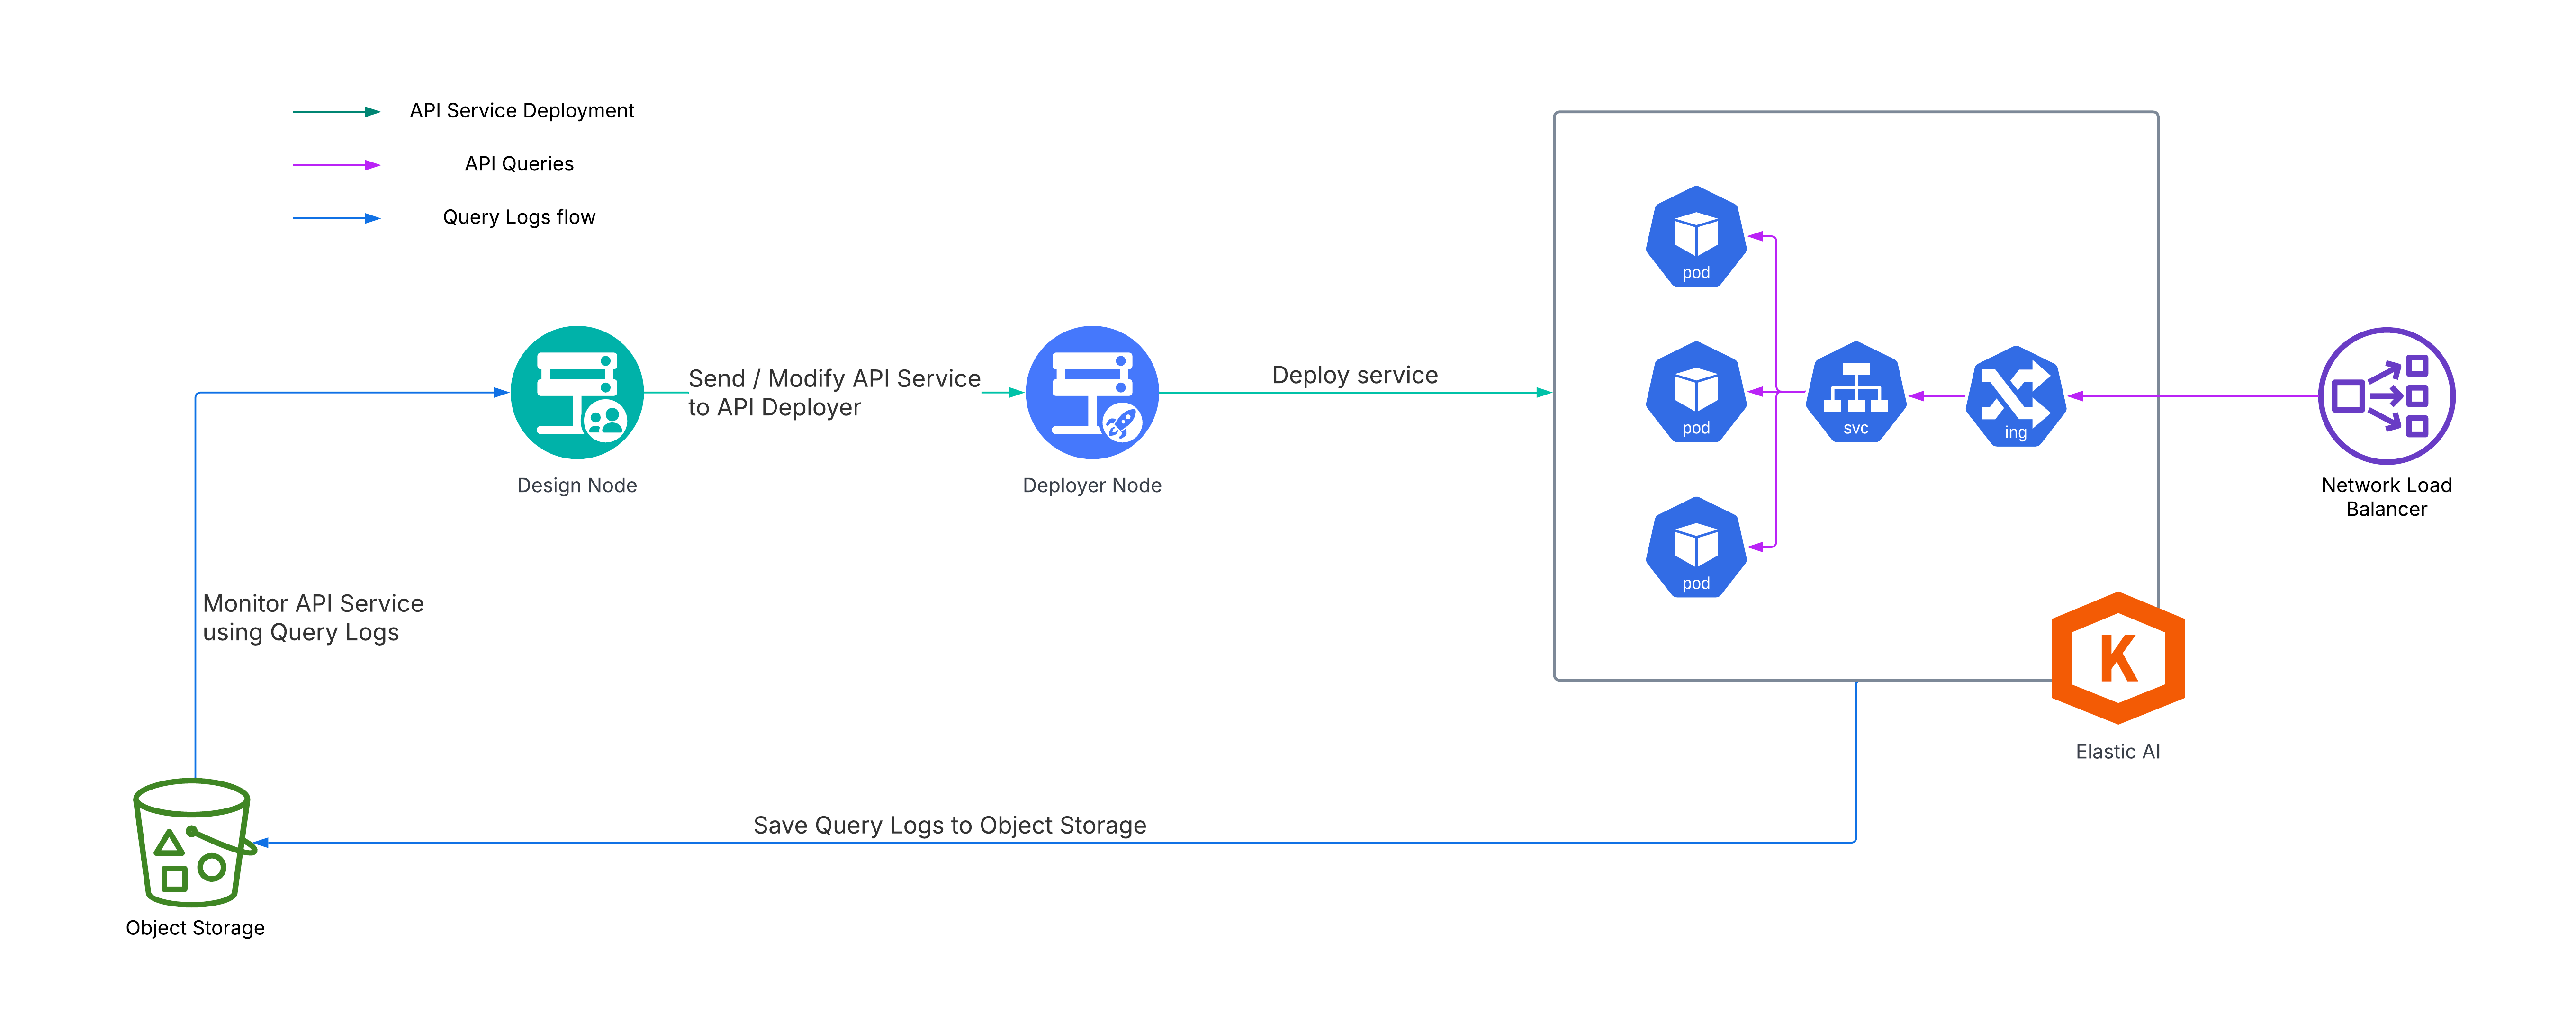
One of Dataiku’s core features is to enable users to create and deploy API services. API services can be deployed to many platforms, including Dataiku-managed elastic AI clusters (powered by Kubernetes).
When deployed to elastic AI clusters, an API service consists of a Kubernetes deployment (made of several replicas of a single pod), a Kubernetes service, and (optionally) a Kubernetes ingress. The Kubernetes deployment object can be configured to horizontally scale (that is, add additional pods) when a predetermined pod CPU utilization threshold is reached.
The number of pod replicas in a Kubernetes deployment should be configured to appropriately handle queries at the highest expected load. However, what happens if loads increase beyond expectations? How does a Dataiku developer ensure such a situation doesn’t lead to unacceptably large query latencies?
In cases where maximum loads are unpredictable, or when sustained increased latencies aren’t acceptable, Dataiku developers can leverage the API service audit trail, together with automation scenarios, to dynamically tune the maximum number of pod replicas in response to near-real-time query latency measurements.
An overview of such a setup is illustrated in the following diagram:
Objectives#
In this tutorial, you will:
Ingest API service query logs into a Dataiku project.
Leverage the query logs to compute average and 75th percentile query latency.
Create an automation scenario that automatically increases the number of API service pod replicas in response to increased query latency.
Prerequisites#
This tutorial is aimed at Dataiku API service developers. It requires an advanced understanding of API service deployments on elastic AI clusters, as well as a basic understanding of Kubernetes deployments.
To reproduce the steps in this tutorial, you’ll need:
Dataiku 13.0 or later
A self-hosted Dataiku Design node and Deployer node (which can be local or standalone)
A Dataiku Event Server installed on the Design node
An elastic AI cluster configured as a deployment infrastructure in the Deployer (with audit logs centralization configured)
Membership of a Dataiku group with rights to create published API services, and rights to deploy to the elastic AI deployment infrastructure
The Time Series preparation plugin installed on the Design node by a Dataiku administrator.
Deploy an API service to the elastic AI cluster#
First, deploy an API service onto an elastic AI deployment infrastructure. To do so, follow the reference documentation on First API (with API Deployer).
Note
The API service can be deployed with or without enabling horizontal pod autoscaling. For simplicity, Dataiku recommends disabling horizontal pod autoscaling the first time this tutorial is completed. However, if desired, horizontal pod autoscaling can be configured under the deployment Settings > Sizing and Scaling page.
Compute API service query latency#
Once the API service is deployed, it’s time to leverage the query logs to compute the query latency. Computing the query latency requires a Prepare and a Time Series Windowing recipe.
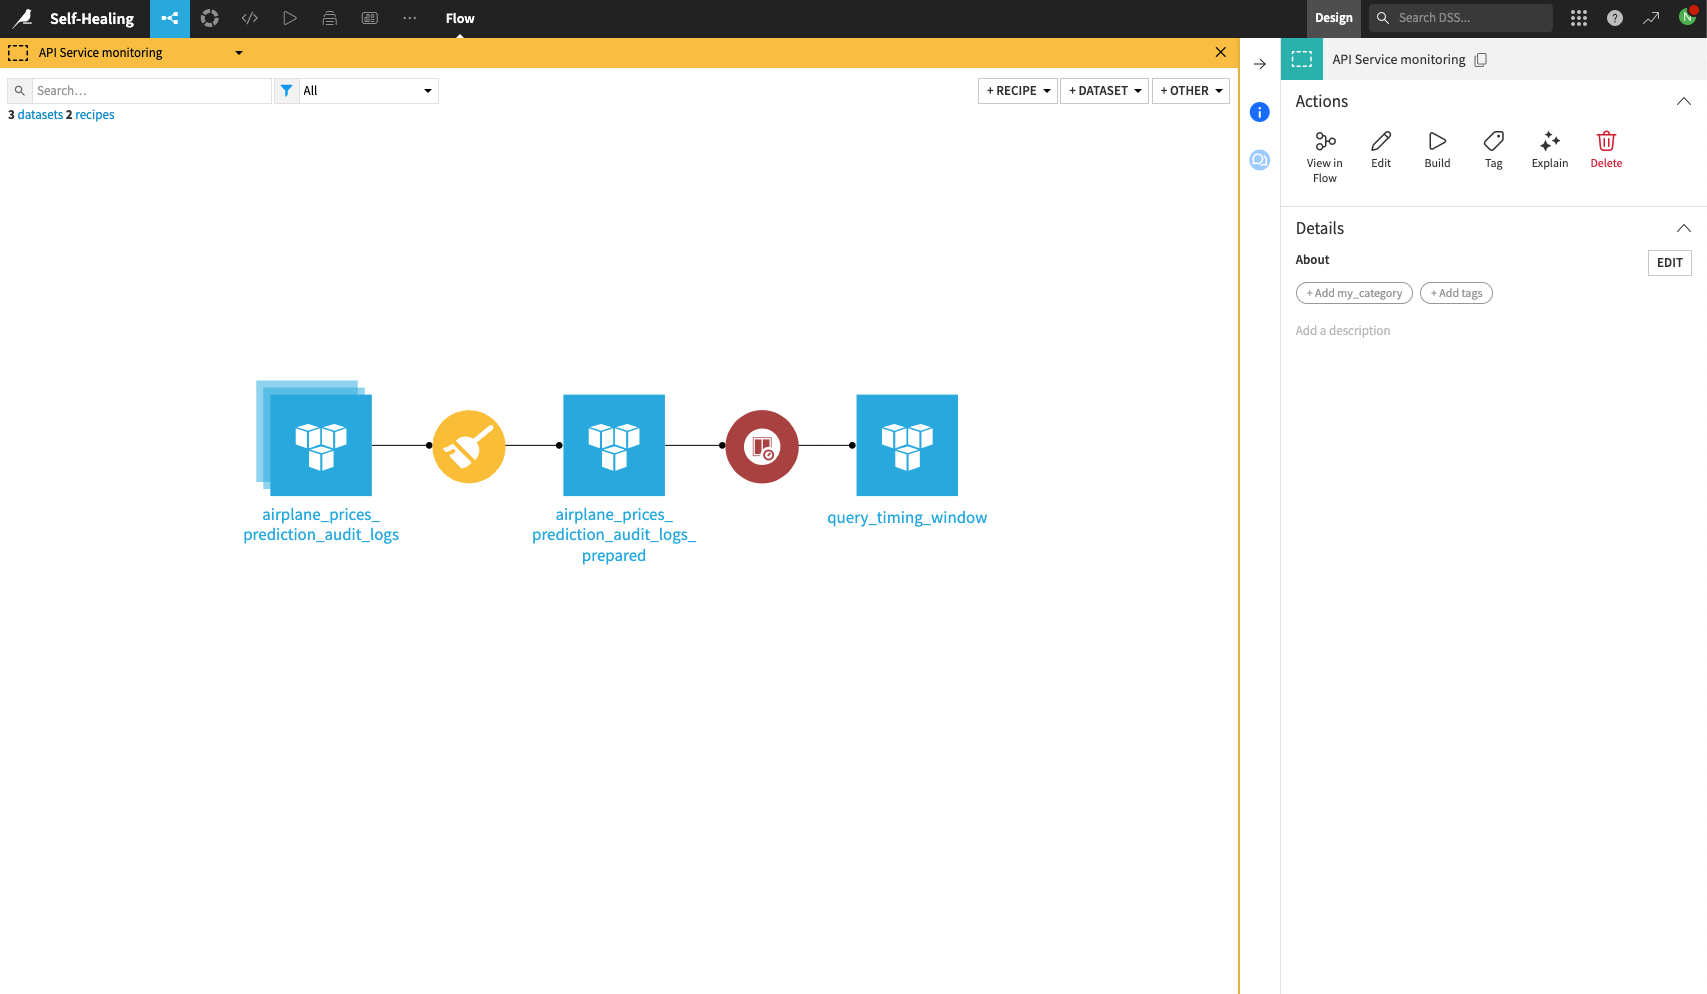
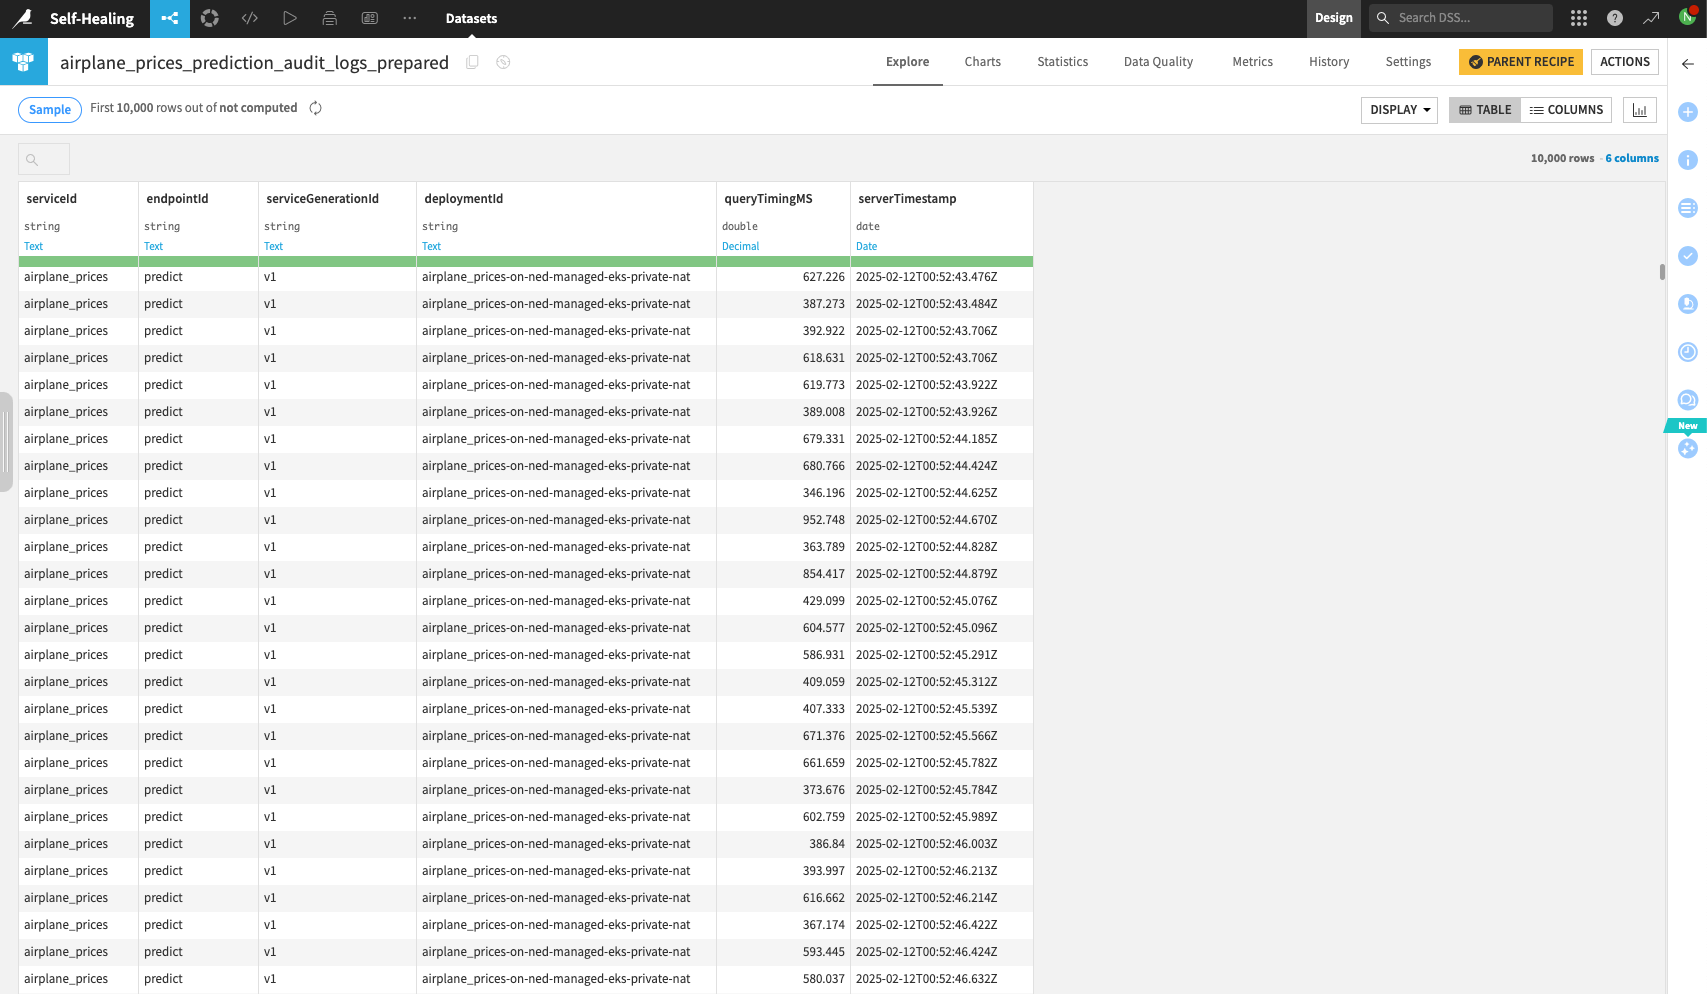
In the Design node, navigate to the Flow of the project containing the API service. Create a dataset pointing to the query logs of the deployed API service.
Note
You may need to contact your Dataiku administrator if you don’t know which connection the query logs are being stored on.
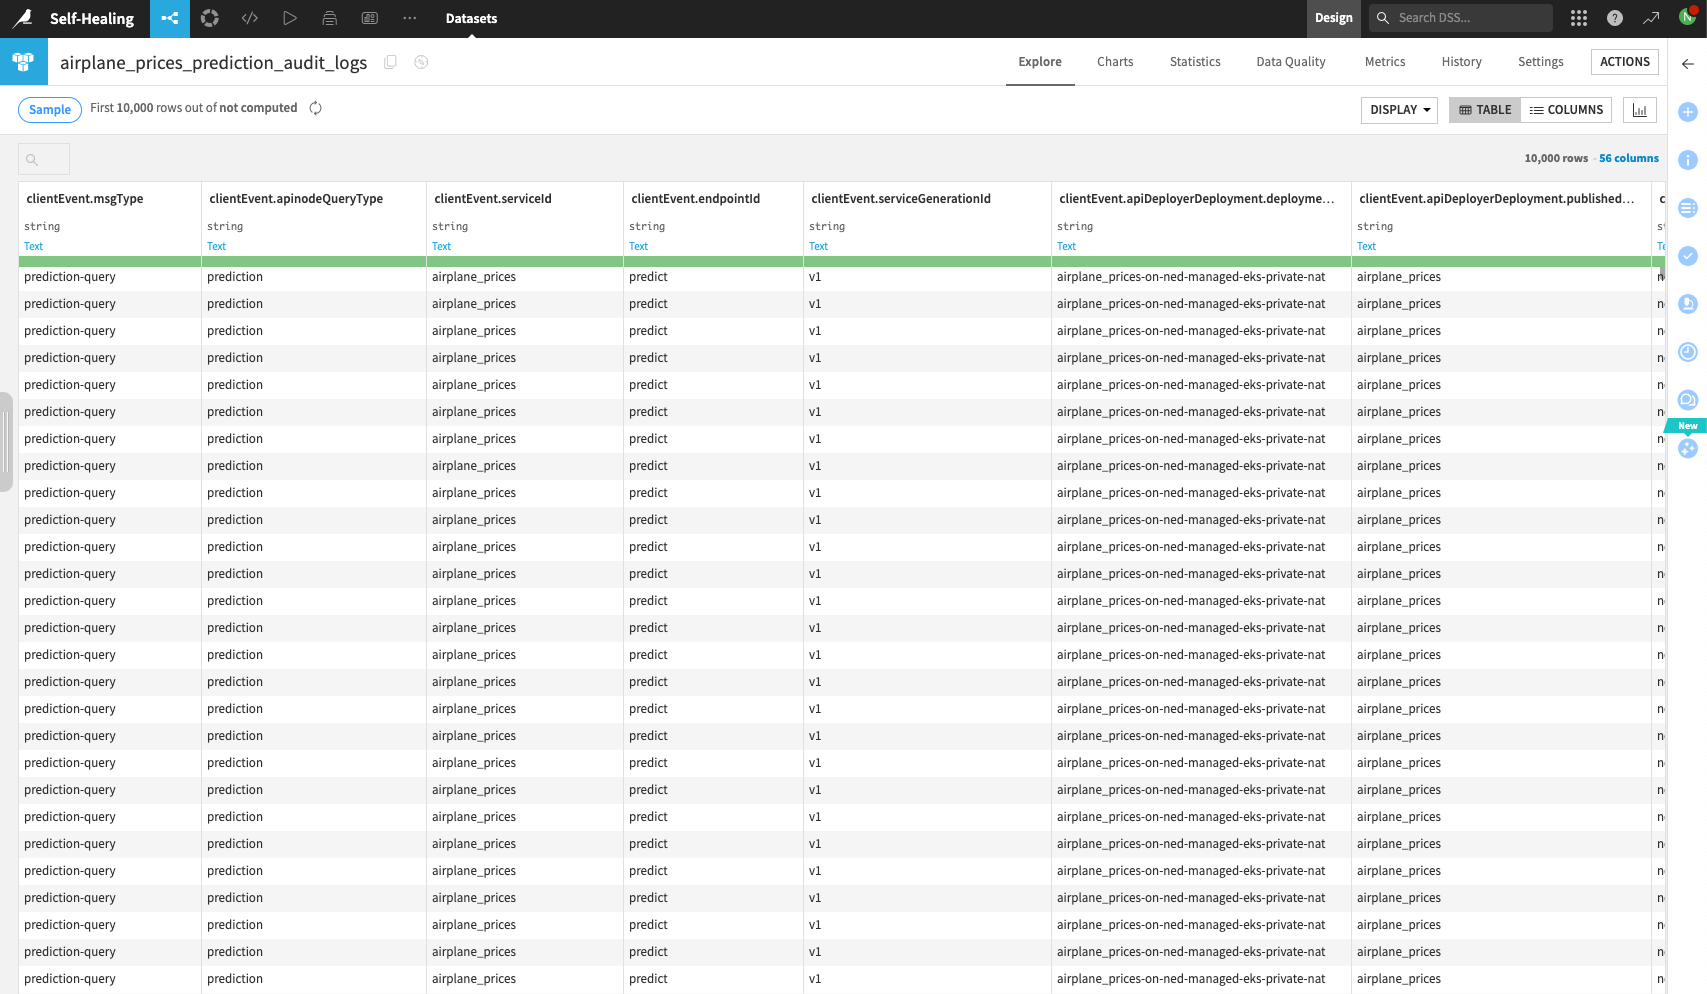
Now, use a Prepare recipe to calculate the total query time for each query in milliseconds (note that the query logs record time in nanoseconds). This can be done by adding up all the clientEvent.timing.abc columns. For convenience, also delete all columns except serviceId, endpointId, serviceGenerationId, deploymentId, serverTimestamp, and the total query time computed column.
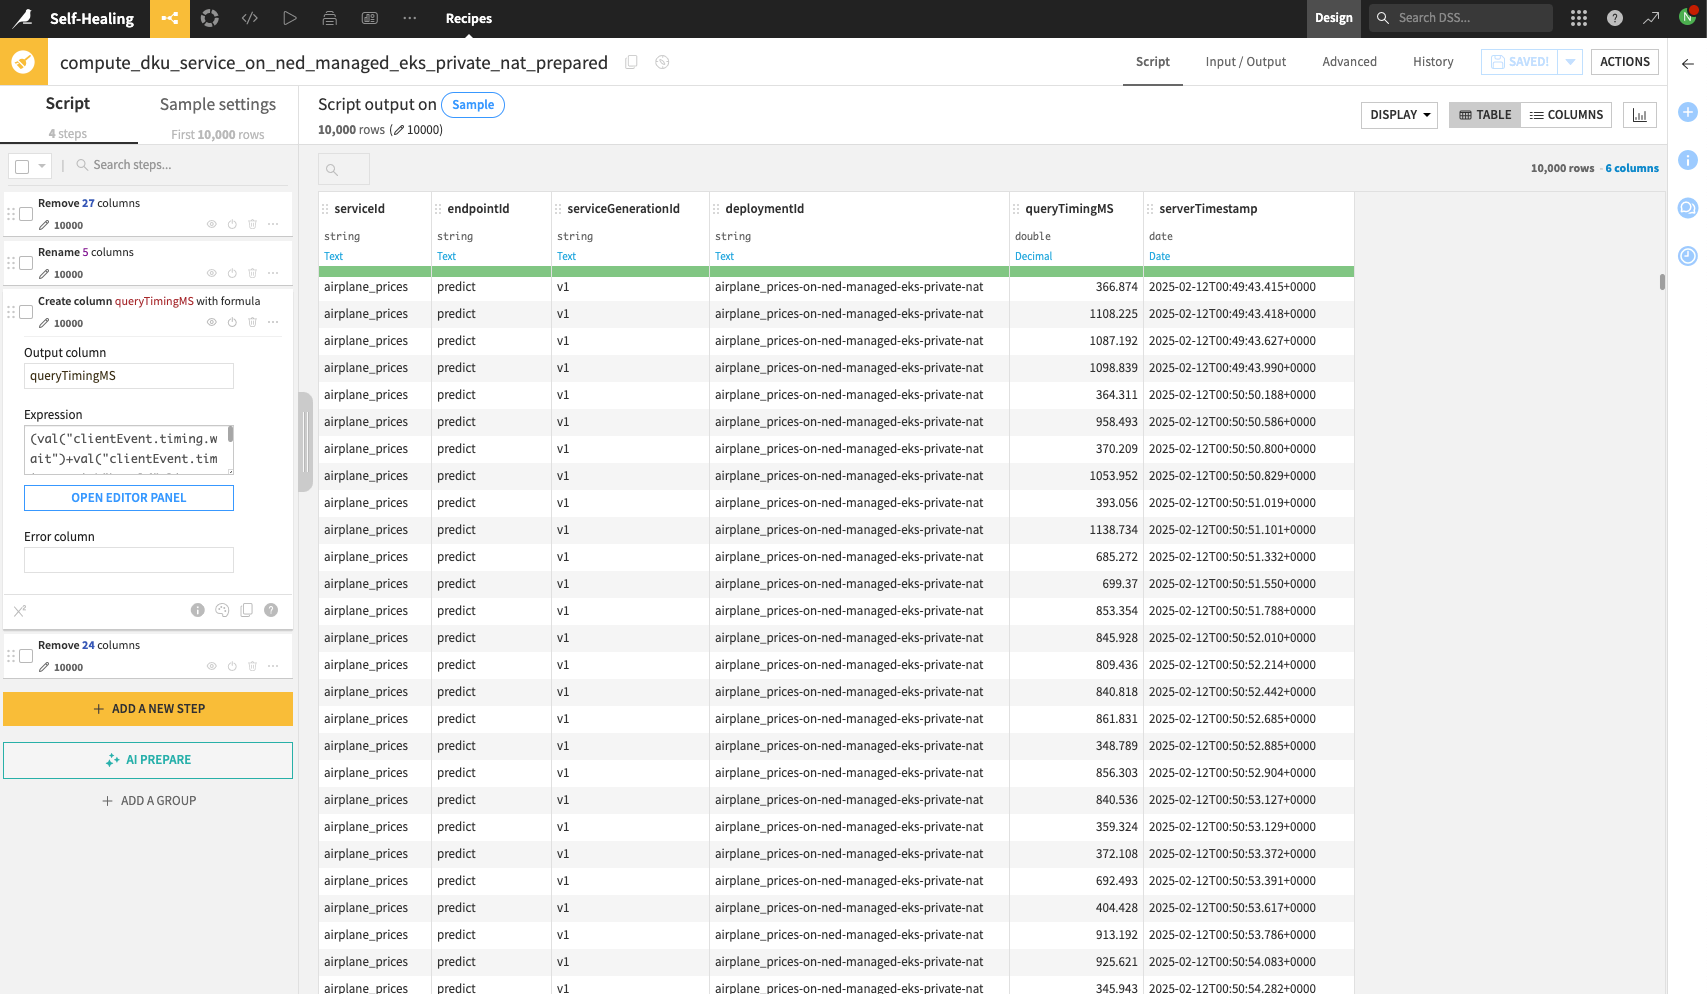
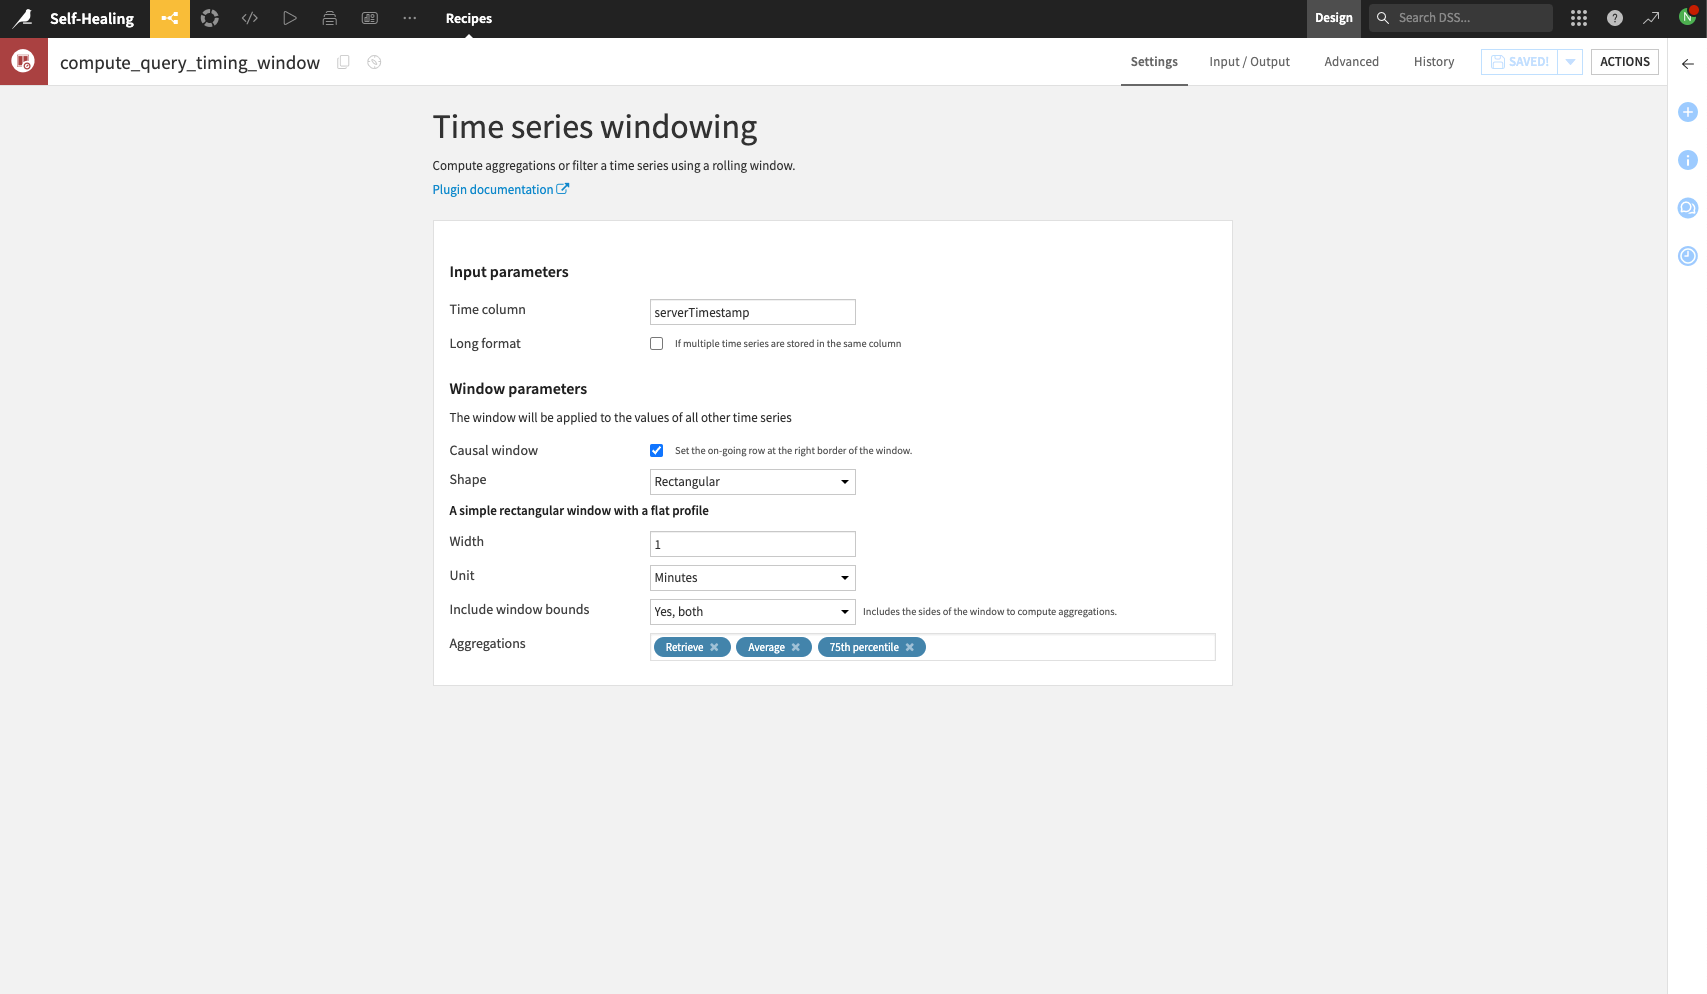
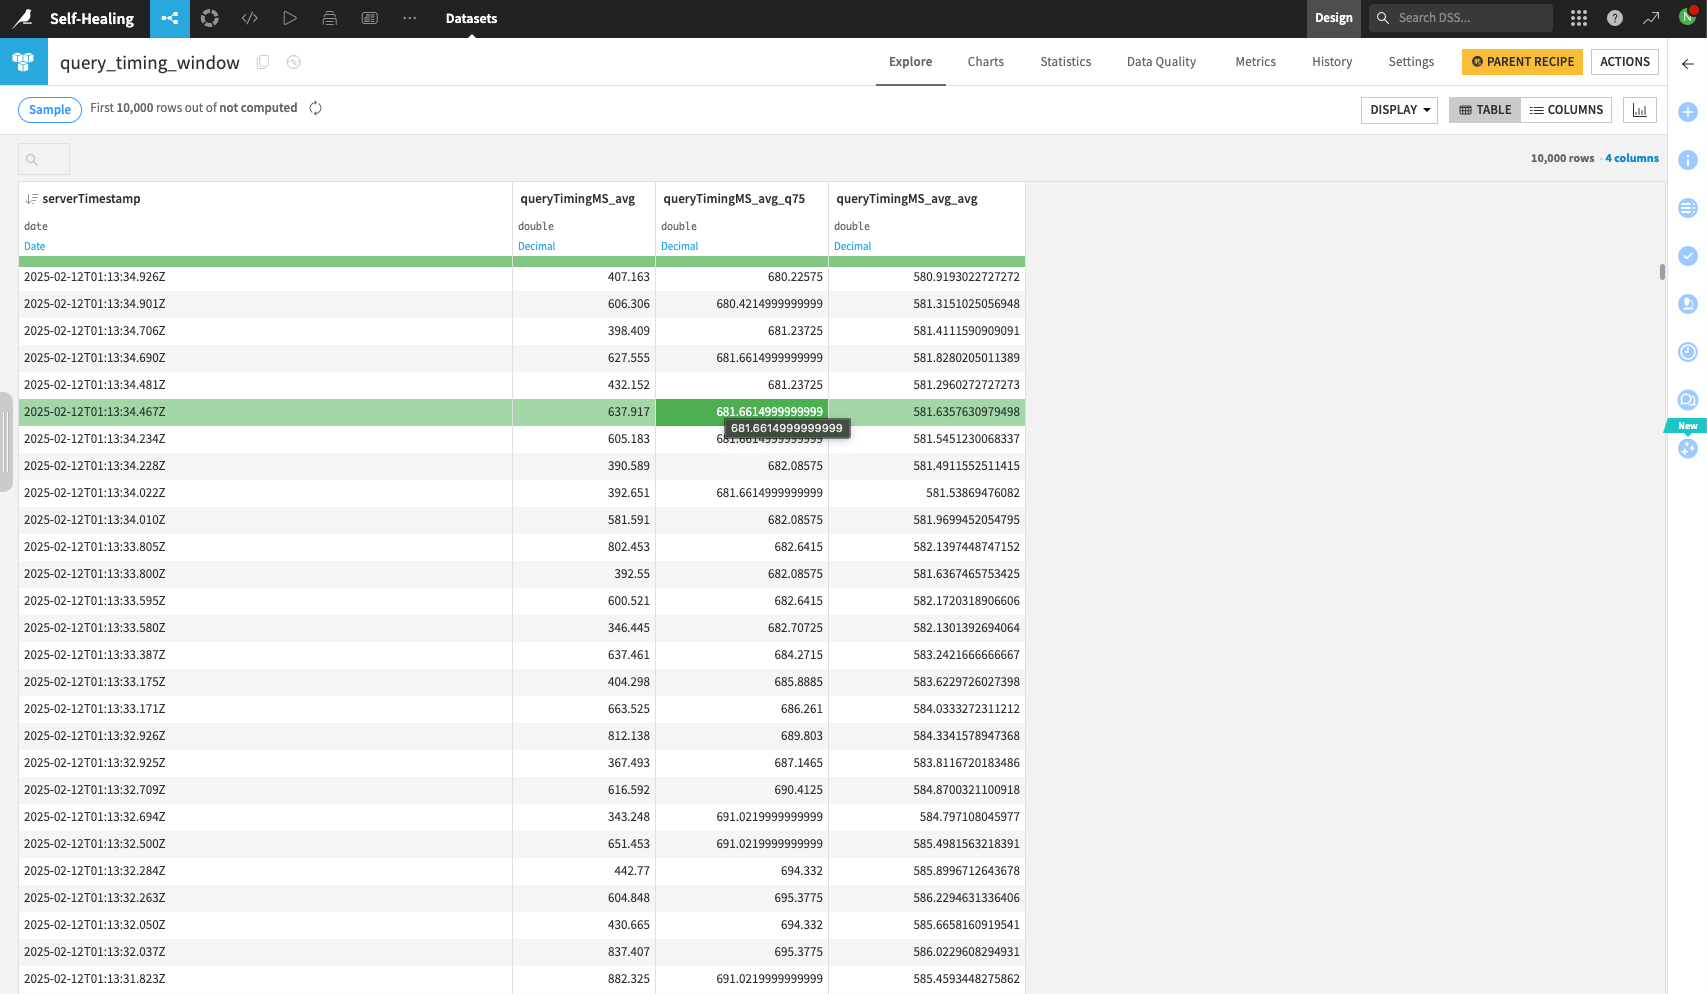
Finally, use the Time Series Windowing recipe to compute the average and 75th percentile query latency over the desired time window. The following screenshot shows computing the latency to 1min windows, although note that the recipe supports computing to the nanosecond resolution.
Automate API service pod replica tuning#
Automating actions in Dataiku is done using scenarios. To automate the increase in API service pod replicas, create a scenario to:
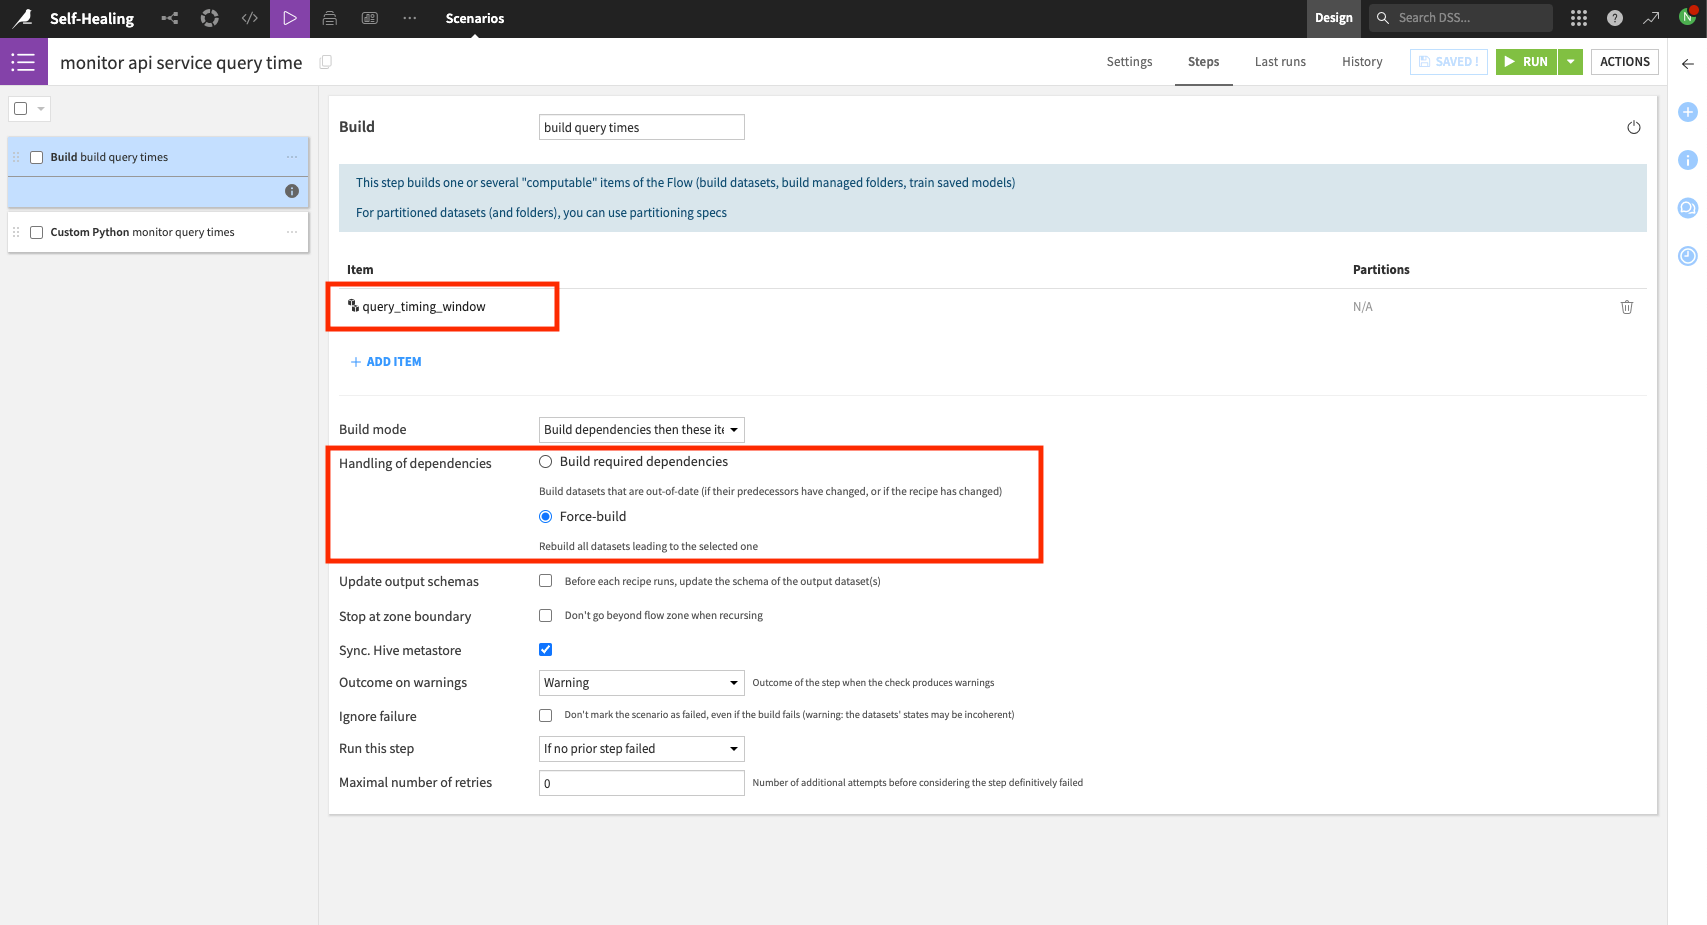
Rebuild the query latency dataset.
Increase the API service replicas when the query latency exceeds a specific threshold.
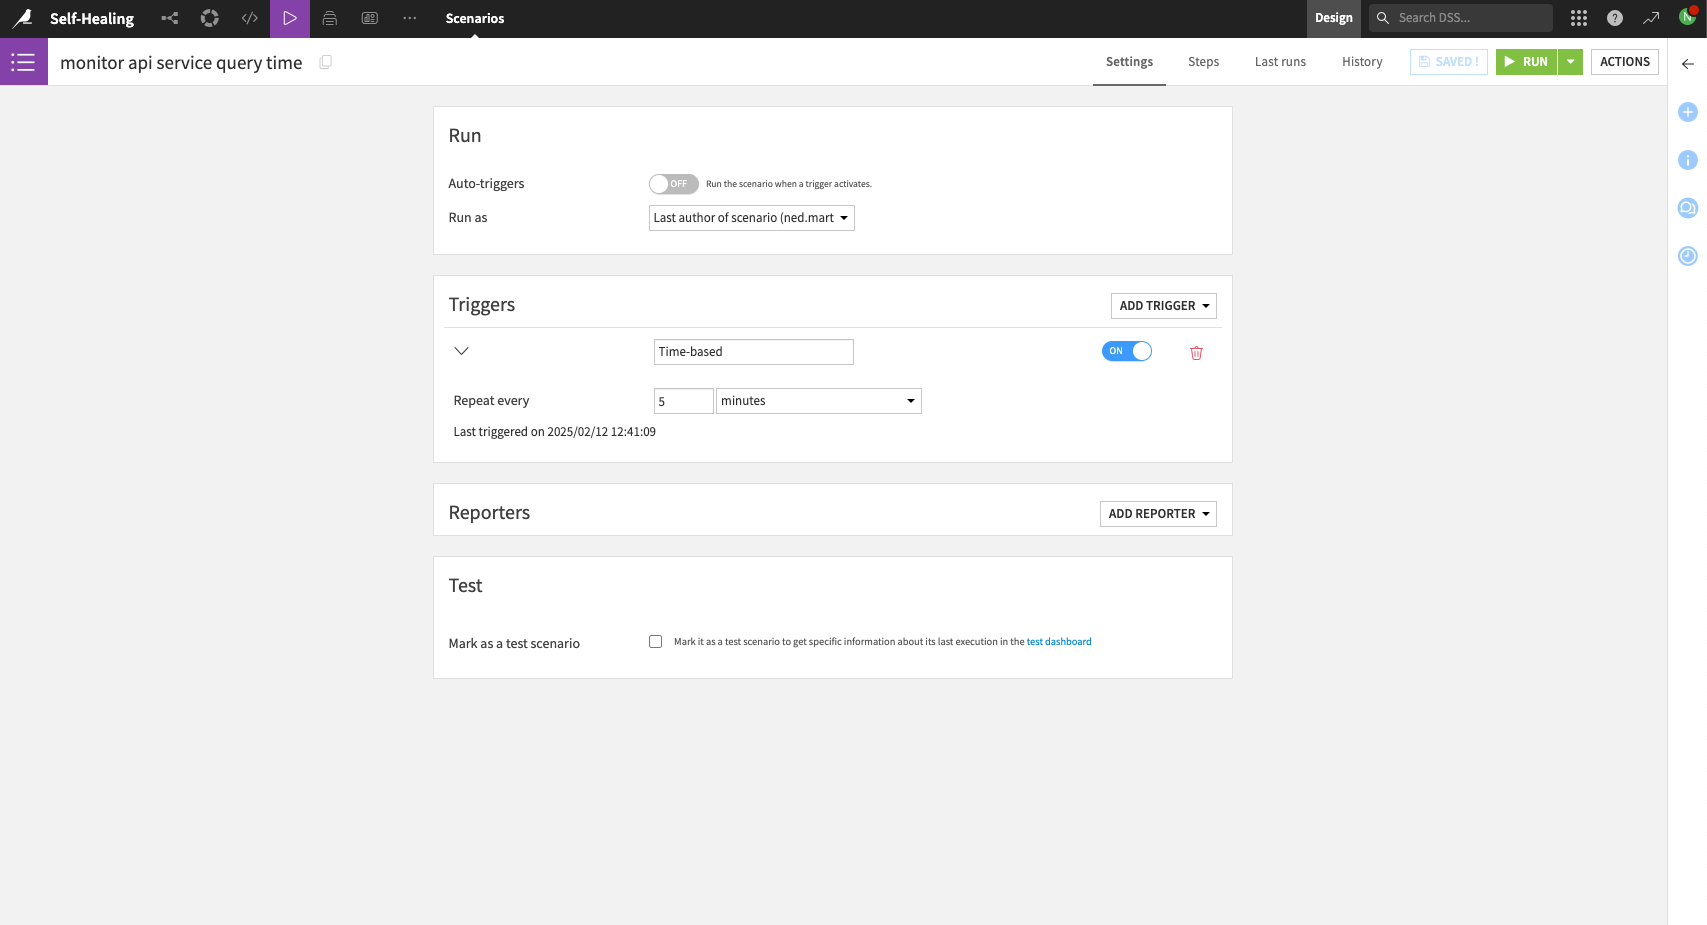
First, create a scenario with a time-based trigger. The following example shows the trigger executing every 5 minutes. Although technically possible to reduce this value further, Dataiku doesn’t recommend decreasing it below 1-2min.
Second, add a scenario step to rebuild the query latency dataset. This step should be a recursive build of the final dataset computed in the previous section.
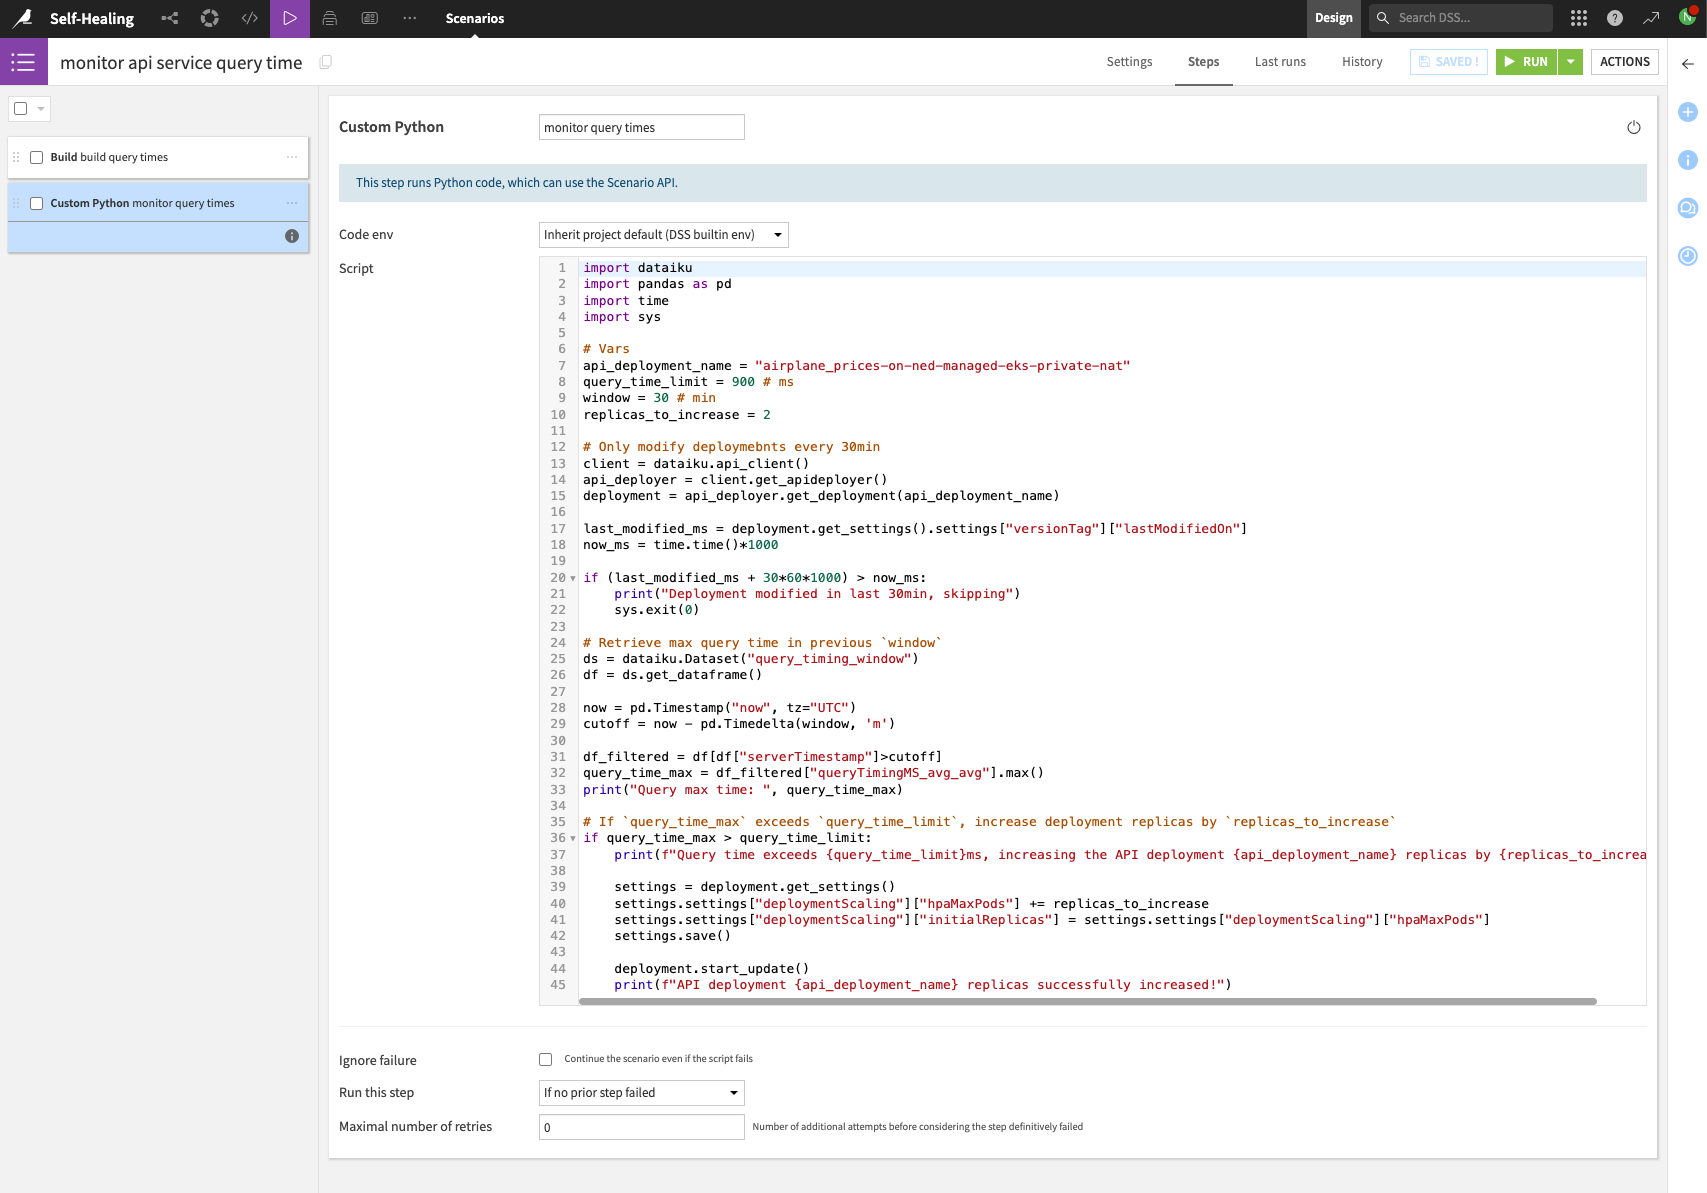
Third, add a Python scenario step that increases the API service pod replicas in response to the query latency exceeding a predetermined threshold. As an example, the following code checks the maximum query latency over the previous 30min and increases the number of replicas by two if the maximum latency is above a predetermined threshold (in this case, 900ms).
import dataiku
import pandas as pd
import time
import sys

# Vars
api_deployment_name = "airplane_prices-on-ned-managed-eks-private-nat"
query_time_limit = 900 # ms
window = 30 # min
replicas_to_increase = 2

# Only modify deploymebnts every 30min
client = dataiku.api_client()
api_deployer = client.get_apideployer()
deployment = api_deployer.get_deployment(api_deployment_name)

last_modified_ms = deployment.get_settings().settings["versionTag"]["lastModifiedOn"]
now_ms = time.time()*1000

if (last_modified_ms + 30*60*1000) > now_ms:
    print("Deployment modified in last 30min, skipping")
    sys.exit(0)

# Retrieve max query time in previous `window`
ds = dataiku.Dataset("query_timing_window")
df = ds.get_dataframe()

now = pd.Timestamp("now", tz="UTC")
cutoff = now - pd.Timedelta(window, 'm')

df_filtered = df[df["serverTimestamp"]>cutoff]
query_time_max = df_filtered["queryTimingMS_avg_avg"].max()
print("Query max time: ", query_time_max)

# If `query_time_max` exceeds `query_time_limit`, increase deployment replicas by `replicas_to_increase`
if query_time_max > query_time_limit:
    print(f"Query time exceeds {query_time_limit}ms, increasing the API deployment {api_deployment_name} replicas by {replicas_to_increase}.")

    settings = deployment.get_settings()
    settings.settings["deploymentScaling"]["hpaMaxPods"] += replicas_to_increase
    settings.settings["deploymentScaling"]["initialReplicas"] = settings.settings["deploymentScaling"]["hpaMaxPods"]
    settings.save()

    deployment.start_update()
    print(f"API deployment {api_deployment_name} replicas successfully increased!")
Note
You’ll need to replace the Vars section of the script with the values for your deployment.
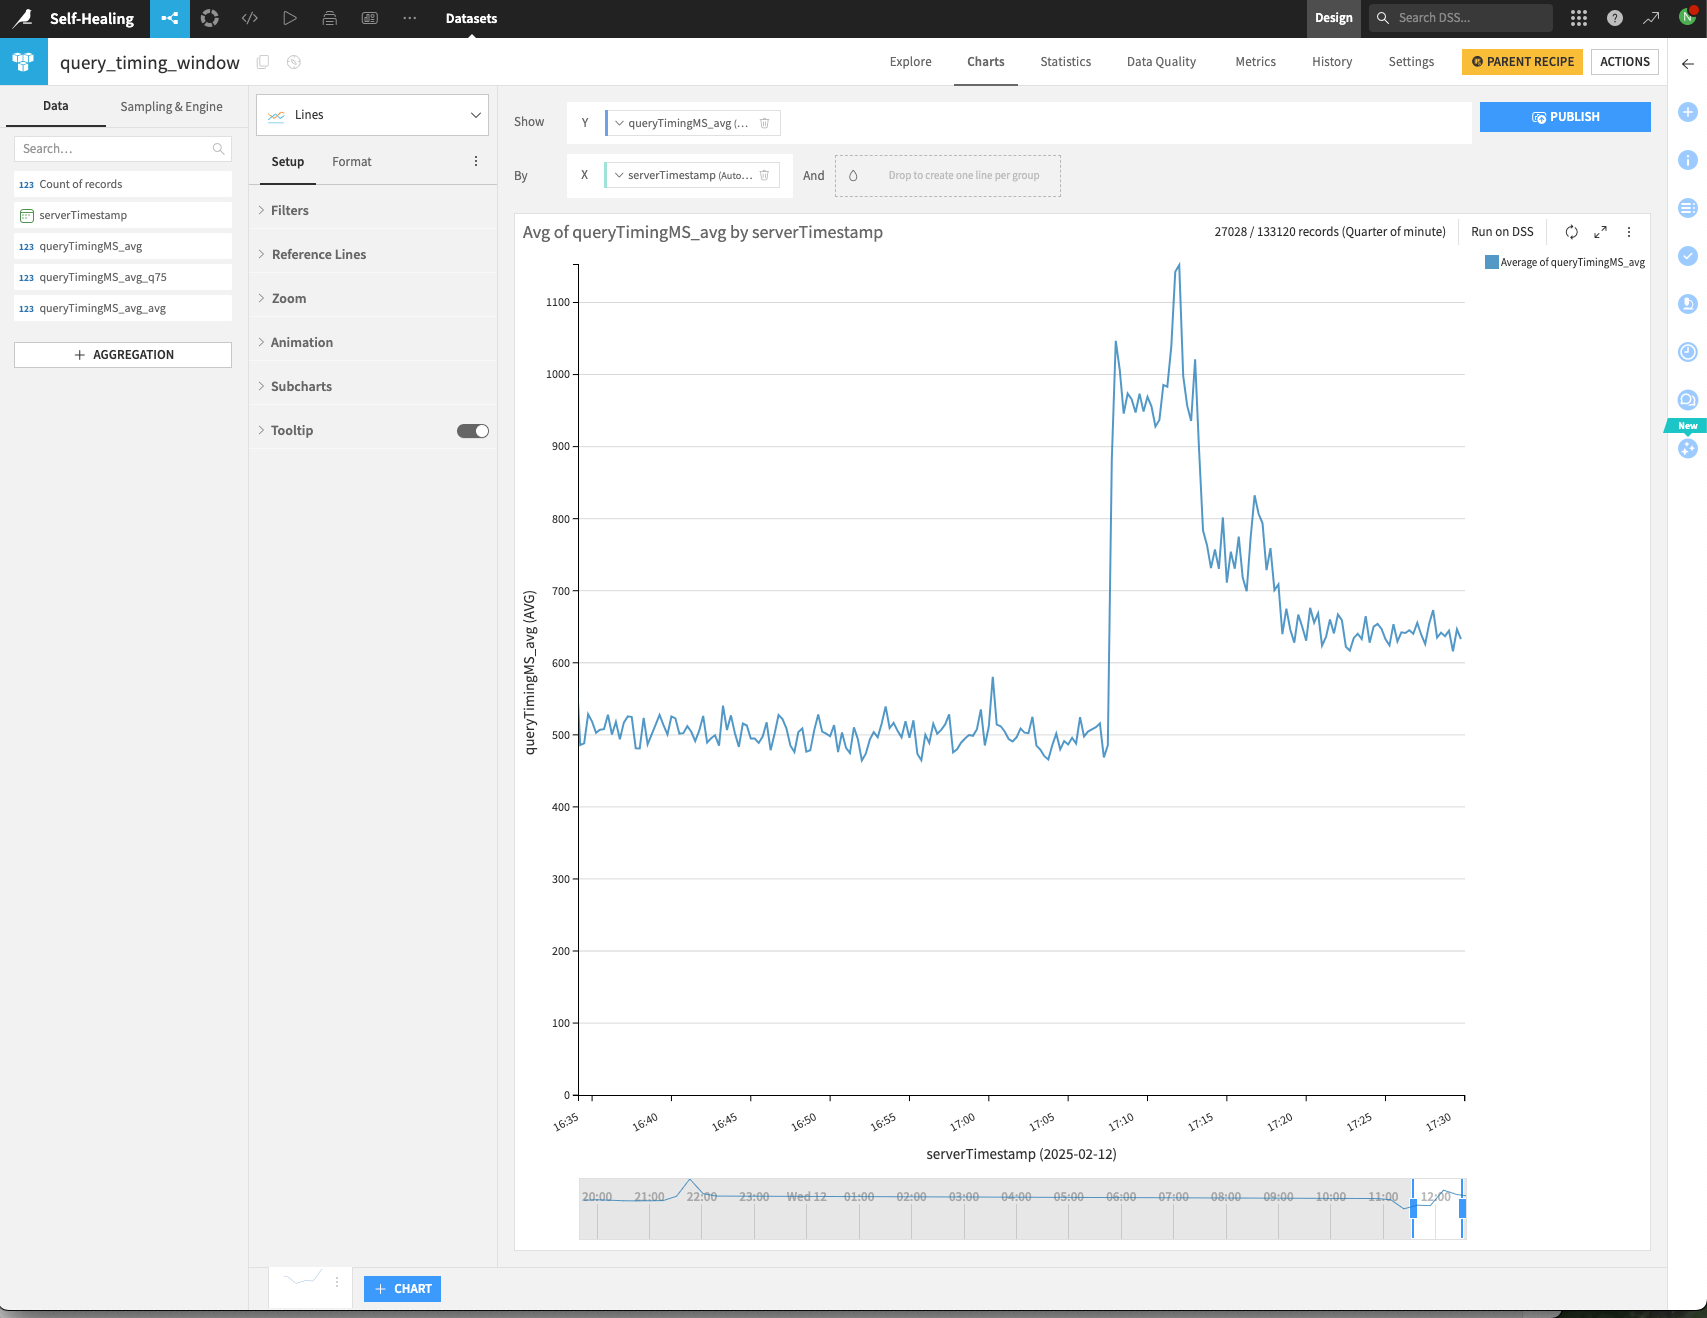
The result of this scenario is to ensure that the API service query latency doesn’t exceed the predetermined latency threshold for extended periods of time. The following graph illustrates the effect of this scenario on an API service that was subjected to high, unexpected loads. The scenario successfully reduced the query latency below the 900ms threshold by increasing the pod replicas.
Next steps#
After completing this tutorial, you’re now equipped to use API service query logs to monitor and automatically tune the performance of your API services.
Although this example only shows how to increase the maximum number of API service replicas, it should be relatively simple to modify the proposed solution to also decrease the number of replicas.