Solution | Optimizing Omnichannel Marketing#
Overview#
Business case#
Pharmaceutical companies depend on strategic marketing campaigns to increase the reach and knowledge of their products and boost sales. The challenge for companies is to understand the relationship between marketing spend and sales impact for individual healthcare providers (HCP) and build an omnichannel marketing strategy that targets prospects and clients with the right content at the right time.
Adopting an analytics-enabled omnichannel commercial model shows a significant global market impact of 5-10% in healthcare provider satisfaction, a 3-5% increase in prescribers, and a 10-20% increase in marketing efficiencies and cost savings. Building and managing an omnichannel strategy has become more complex due to the increasing communication channel options pushed by digital innovation.
This Dataiku Solution supplies an initial framework for customers to adopt and test the value of an omnichannel approach on their own data. At the same time, it supports learning how to identify essential brand and sales adoption drivers to design more competent and efficient marketing campaigns.
The journey of digital marketing begins with omnichannel marketing and sales analysis, which provides the data foundation. Brand adoption strategies create a consistent brand presence across channels. Furthermore, customer journey mapping, channel attribution, customer segmentation, and channel affinity help shape the omnichannel strategy by understanding customer behavior and preferences.
Uplift models and Next Best Action recommendations fine-tune the execution, ensuring the right message reaches the right audience at the right time. The ultimate goal is to create a smooth and personalized customer experience that fosters brand loyalty, drives conversions, and delivers positive health outcomes in the pharmaceutical industry’s complex regulated environment.
Installation#
From the Design homepage of a Dataiku instance connected to the internet, click + Dataiku Solutions.
Search for and select Optimizing Omnichannel Marketing in Pharma.
If needed, change the folder into which the Solution will be installed, and click Install.
Follow the modal to either install the technical prerequisites below or request an admin to do it for you.
From the Design homepage of a Dataiku instance connected to the internet, click + New Project.
Select Dataiku Solutions.
Search for and select Optimizing Omnichannel Marketing in Pharma.
Follow the modal to either install the technical prerequisites below or request an admin to do it for you.
Note
Alternatively, download the Solution’s .zip project file, and import it to your Dataiku instance as a new project.
Technical requirements#
To use this Solution, you must meet the following requirements:
Have access to a Dataiku 13.2+* instance.
All code scripts use Python 3.6.
To benefit natively from all the Dataiku automation, it’s recommended to reconfigure one of the following connections:
PostgreSQL
Snowflake
Data requirements#
The Solution requires the following input datasets. Please read carefully as you need to prepare several features in the specified schema and name format.
Dataset |
Description |
|---|---|
Transactions_input |
Should contain weekly product quantity sales over time (year preferably) for individual HCP accounts in the following format:
|
Product_input |
Is a lookup between product_id, the market brand_name for a drug and the unit_price. The dataset should contain the following:
|
Providers_input |
Is unique at the specific healthcare provider level (variable account_id) of a given hospital or clinic (variable parent_account_id). These records provide insight into the specific practitioners to whom outreach is directed, and some basic information about the hospital where they work. The dataset should contain the following columns:

|
Omnichannel_input |
Has all the marketing outreach with an HCP for a given date over a period of time (that matched the transactions period). These data usually contain web log analytics, email click-through rates, and other in-person or digital interactions. Required variables are account_id, product_id, campaign_id, date as described above. Further instructions below:

|
to_score_input |
Consists of the test set for the brand adoption modeling session. This dataset should contain all features you select to activate on the Project Setup for the brand adoption training dataset and model. If features are missing, you will get an error from a check scenario running in the background. |
Workflow overview#
You can follow along with the Solution in the Dataiku gallery .
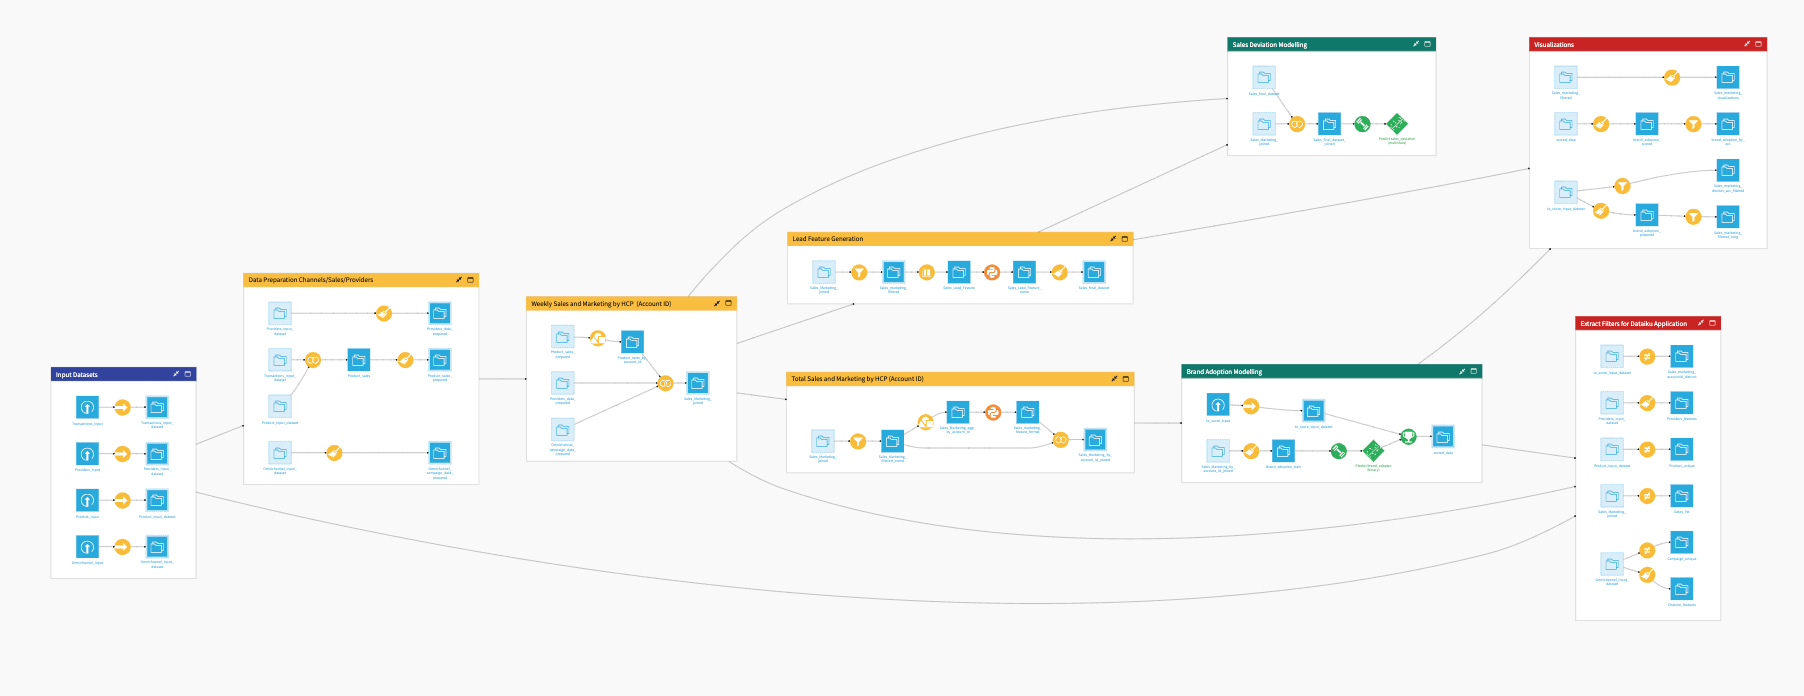
The project has the following high-level steps:
Connect your data as input, and select your analysis parameters via the Project Setup.
Harmonize your marketing channel data with provider characteristics and sales transactions in an adaptable Flow.
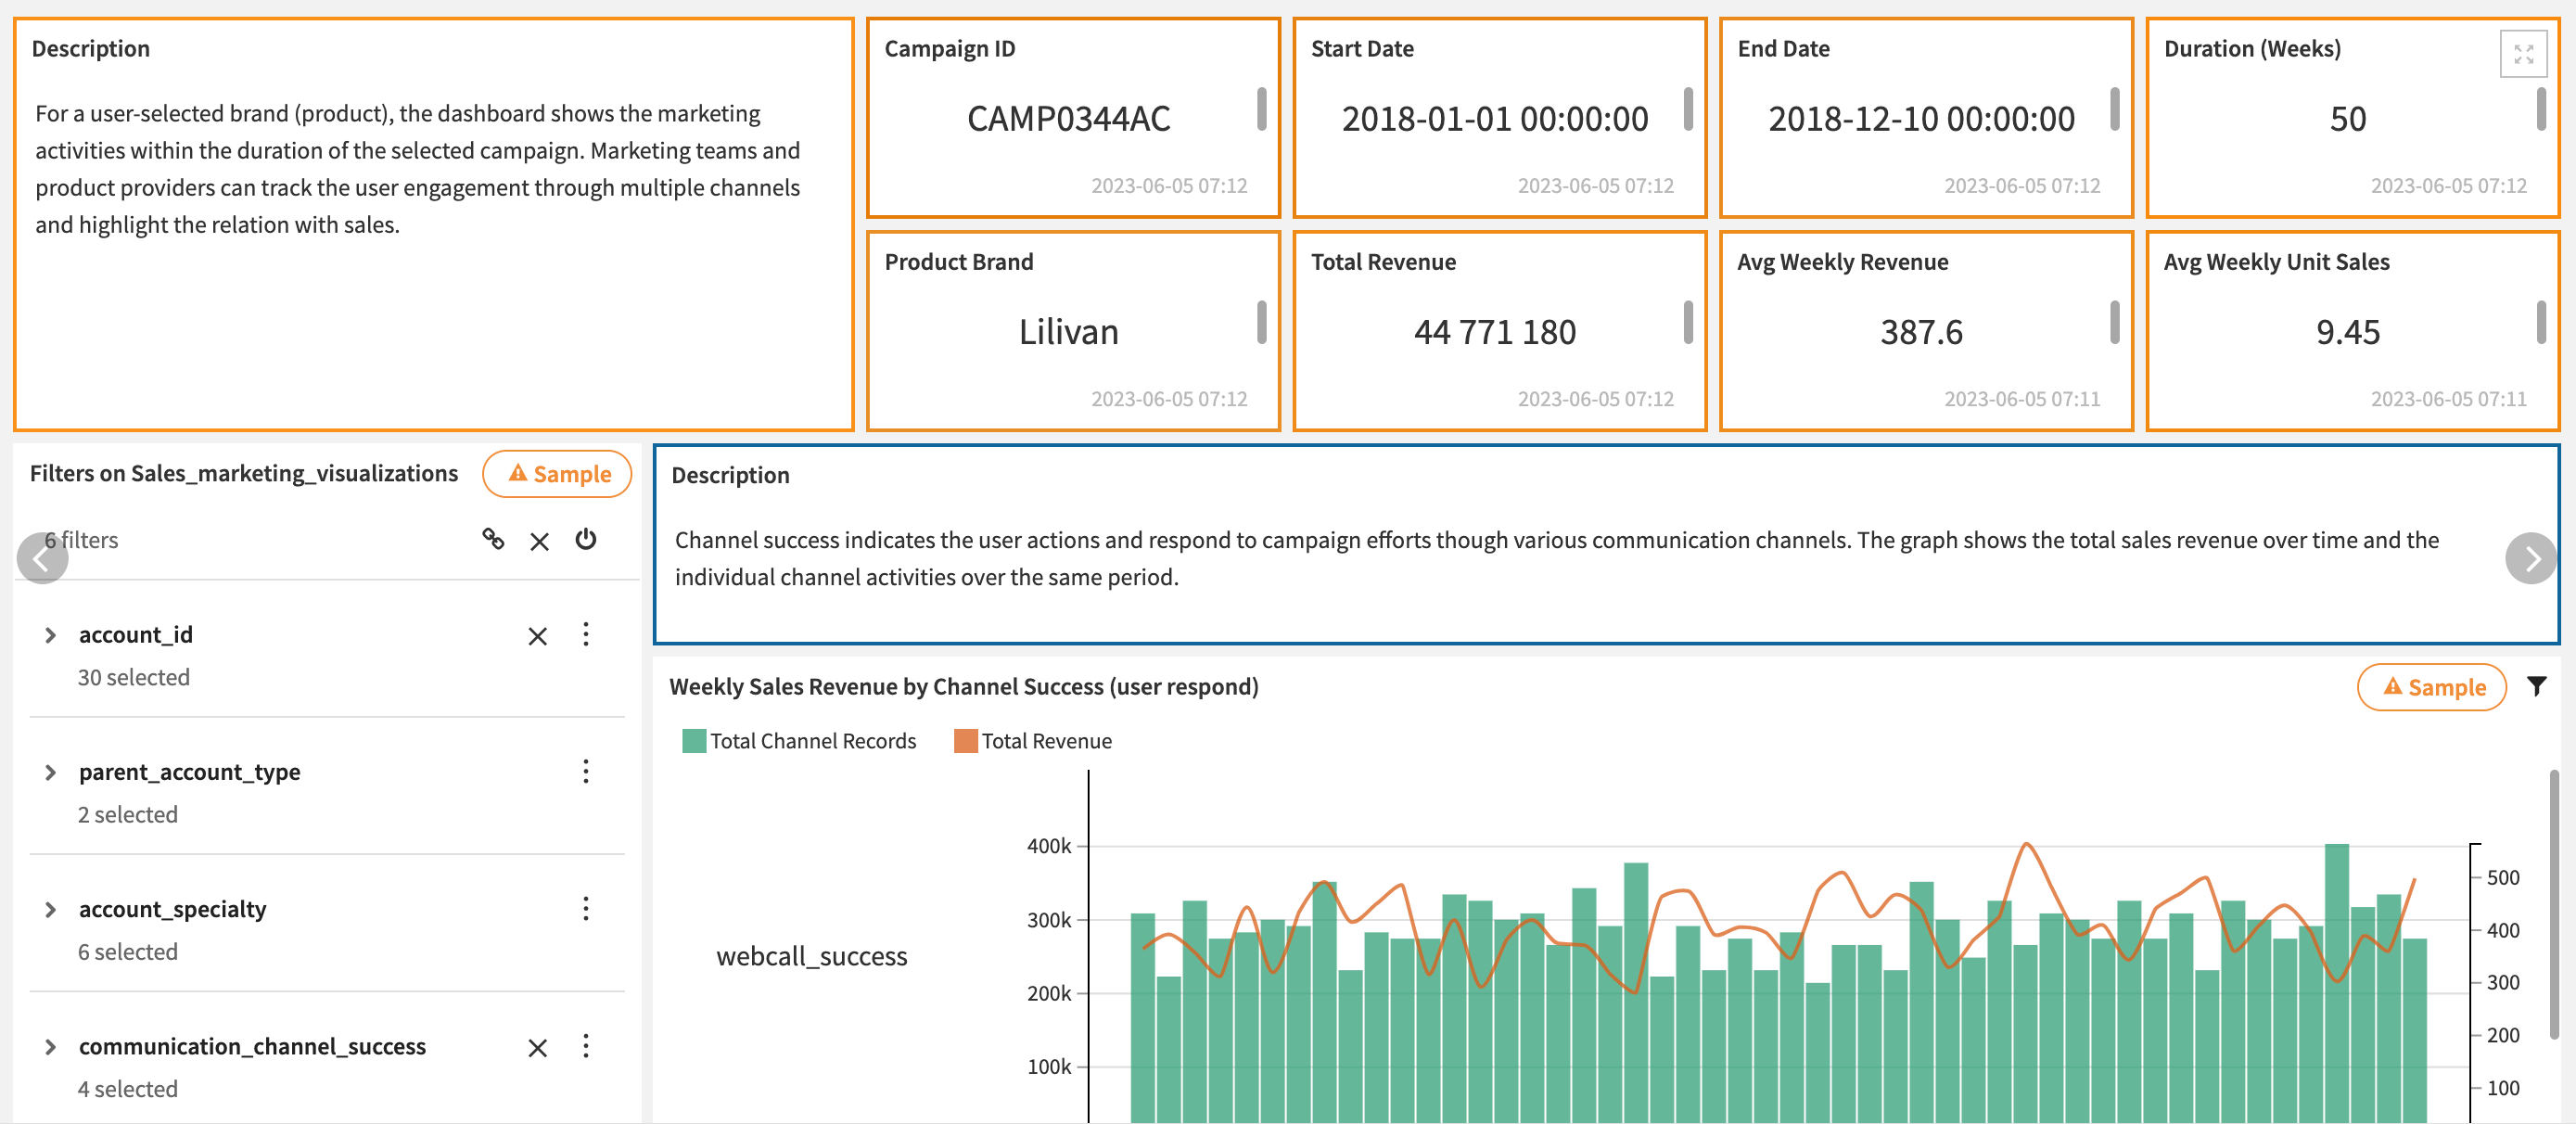
Apply descriptive analytics to show marketing outreach and sales relations to evaluate campaign effectiveness.
Train classification models, and score new HCP accounts likely to adopt a brand based on channel engagement.
Direct marketing investments and outreach via user interactive visualizations that display graphs and ML explainability tools.
Walkthrough#
Note
In addition to reading this document, it’s recommended to read the wiki of the project before beginning to get a deeper technical understanding of how this Solution was created and more detailed explanations of Solution-specific vocabulary.
Plug and play your HCP and channel data#
Kickstart your work by customizing the project parameters with user selection options through a visual interface. You can find this Project Setup in the project overview page.
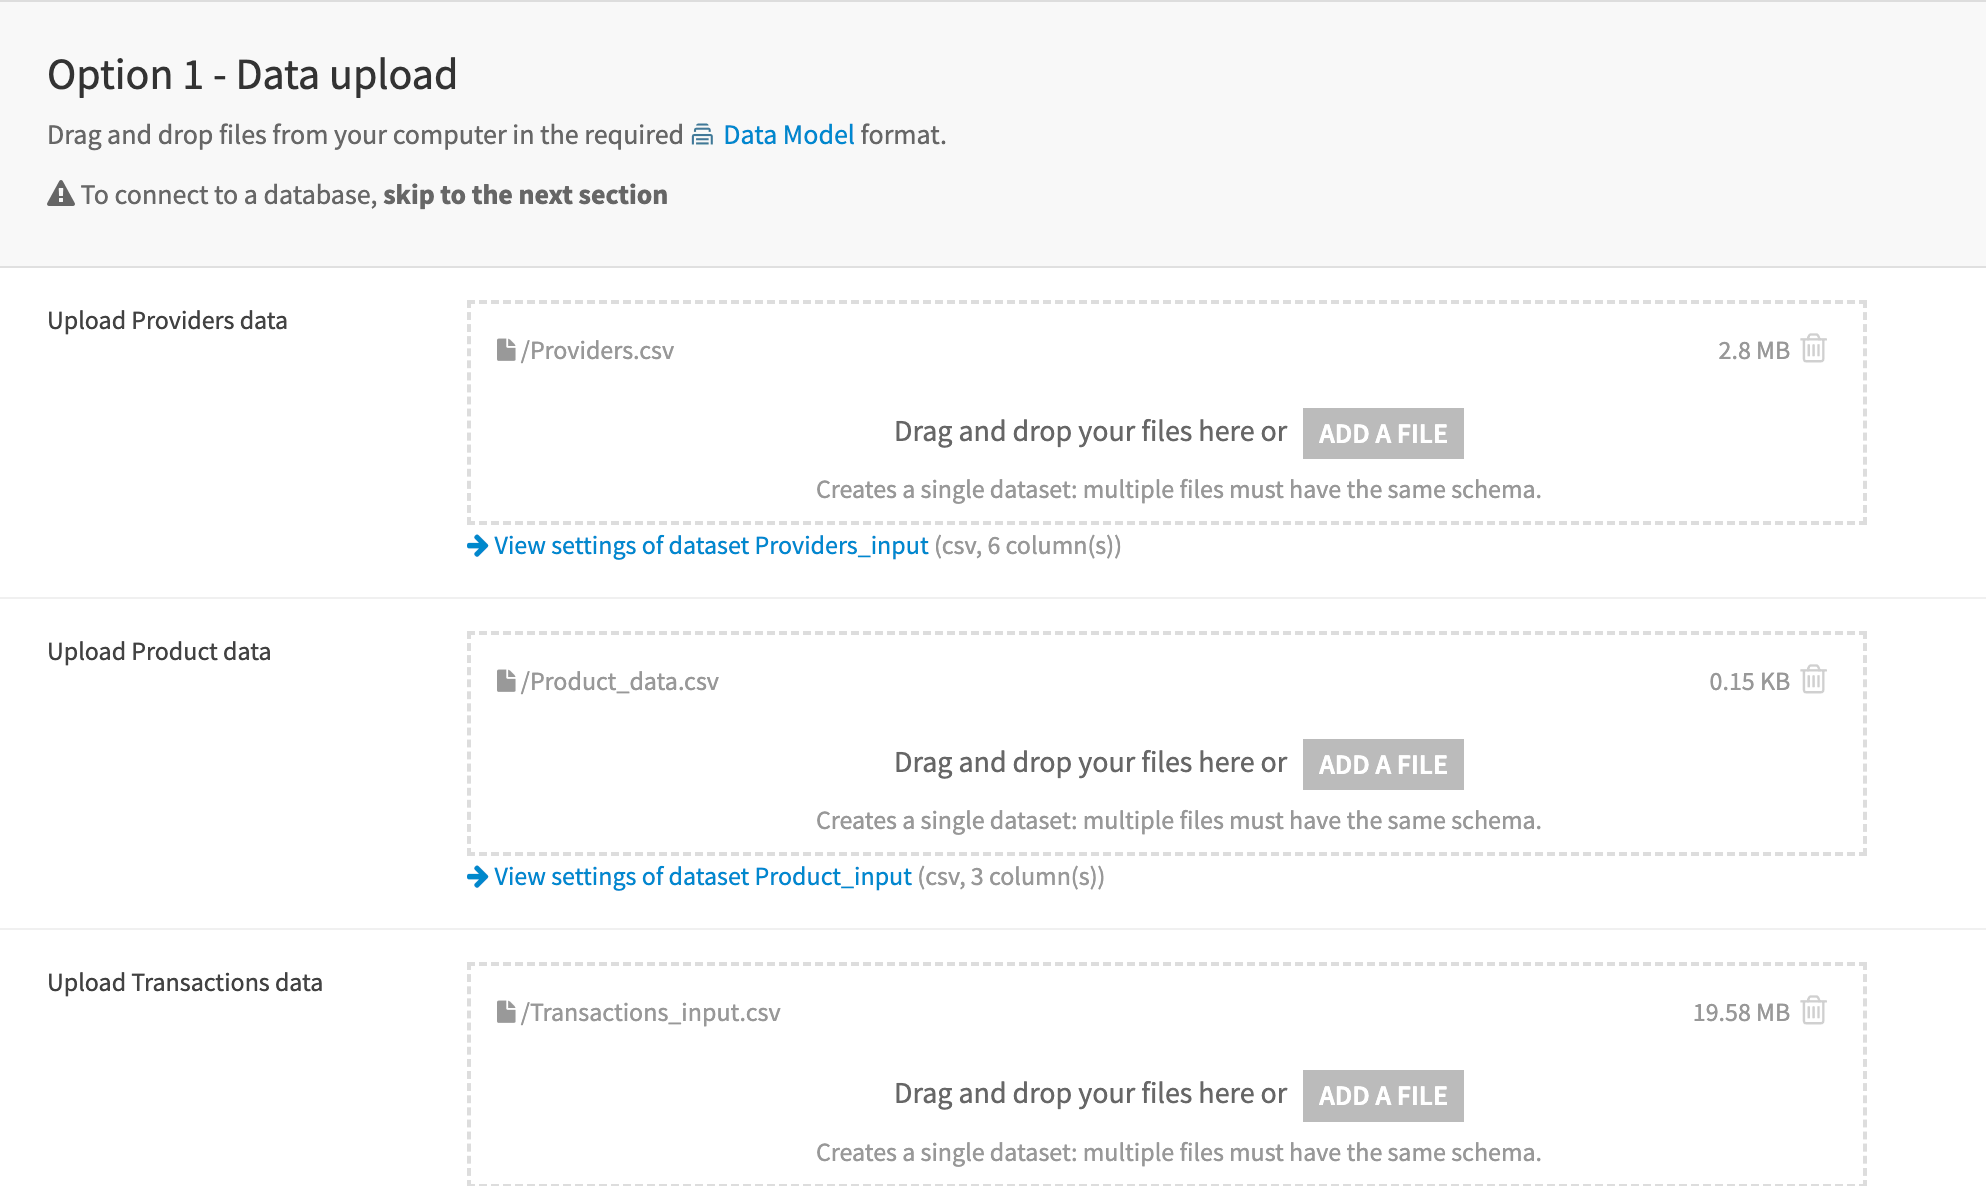
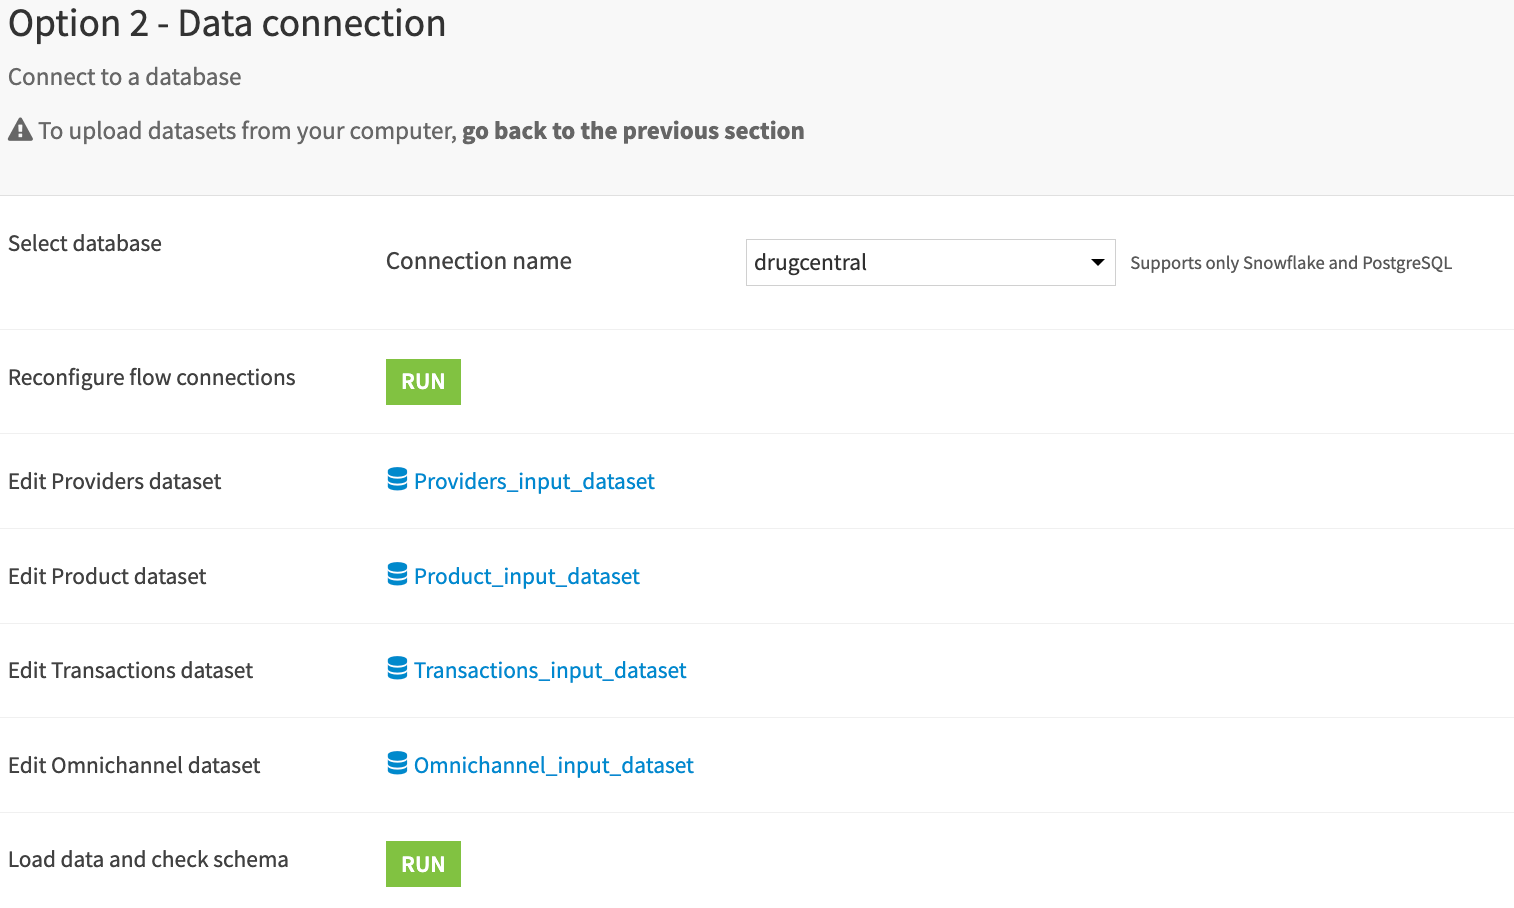
You can walk through the steps to add your data, and select the analysis parameters to run. Users of any skill level can input their desired parameters for analysis and view the results directly in interactive dashboards.
The setup has two options for data input: data upload or data connection. The Run scenario button checks the format and schema of input data. If this step fails, your data don’t comply with the required data model. In this case, check the scenario logs to see which columns are missing or have the wrong type.
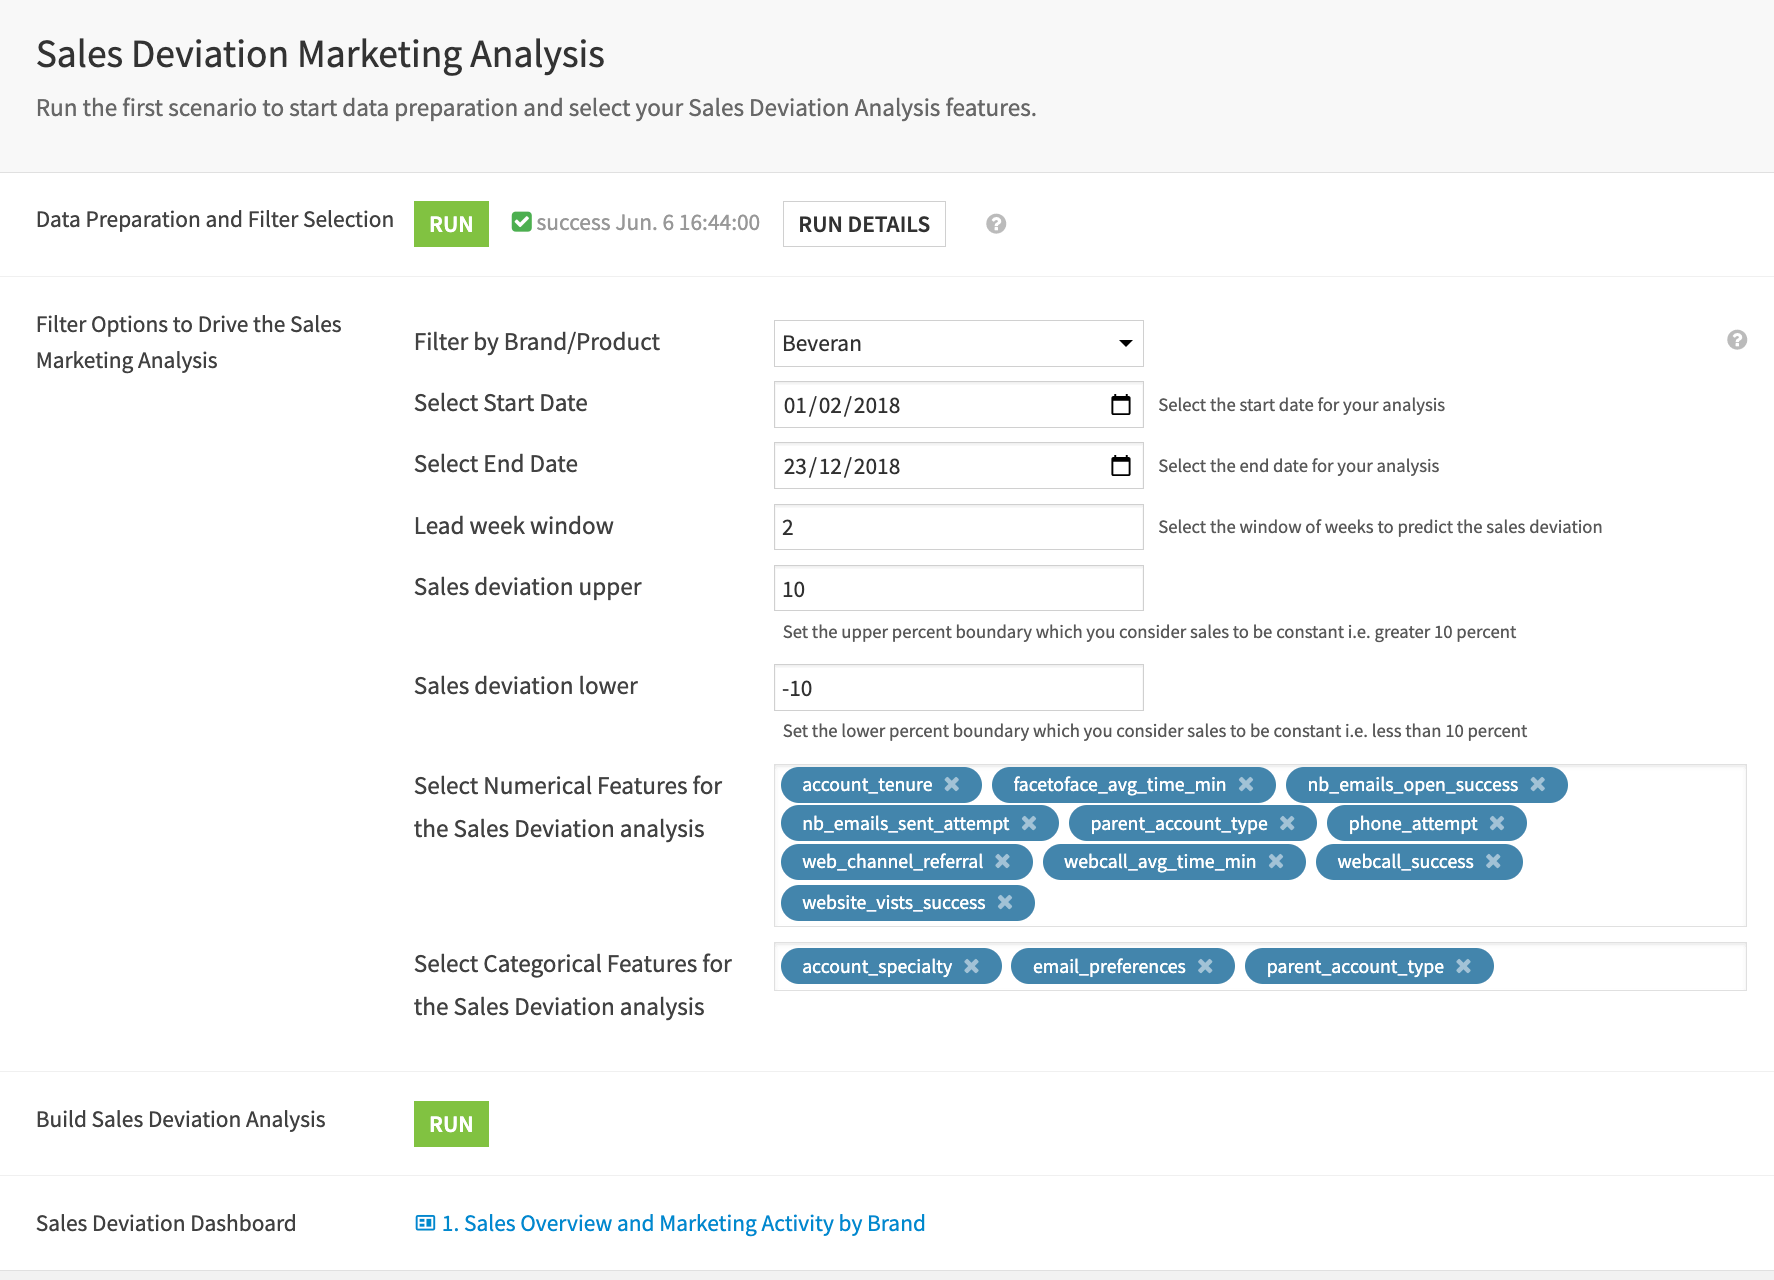
Once you have correctly connected the data, you can Run the scenario next to Data Preparation and Filter Selection to blend and preprocess all the data sources. This creates a dataset for descriptive visual analytics and the primary input dataset for machine learning modeling.
Relate marketing outreach to future sales deviation#
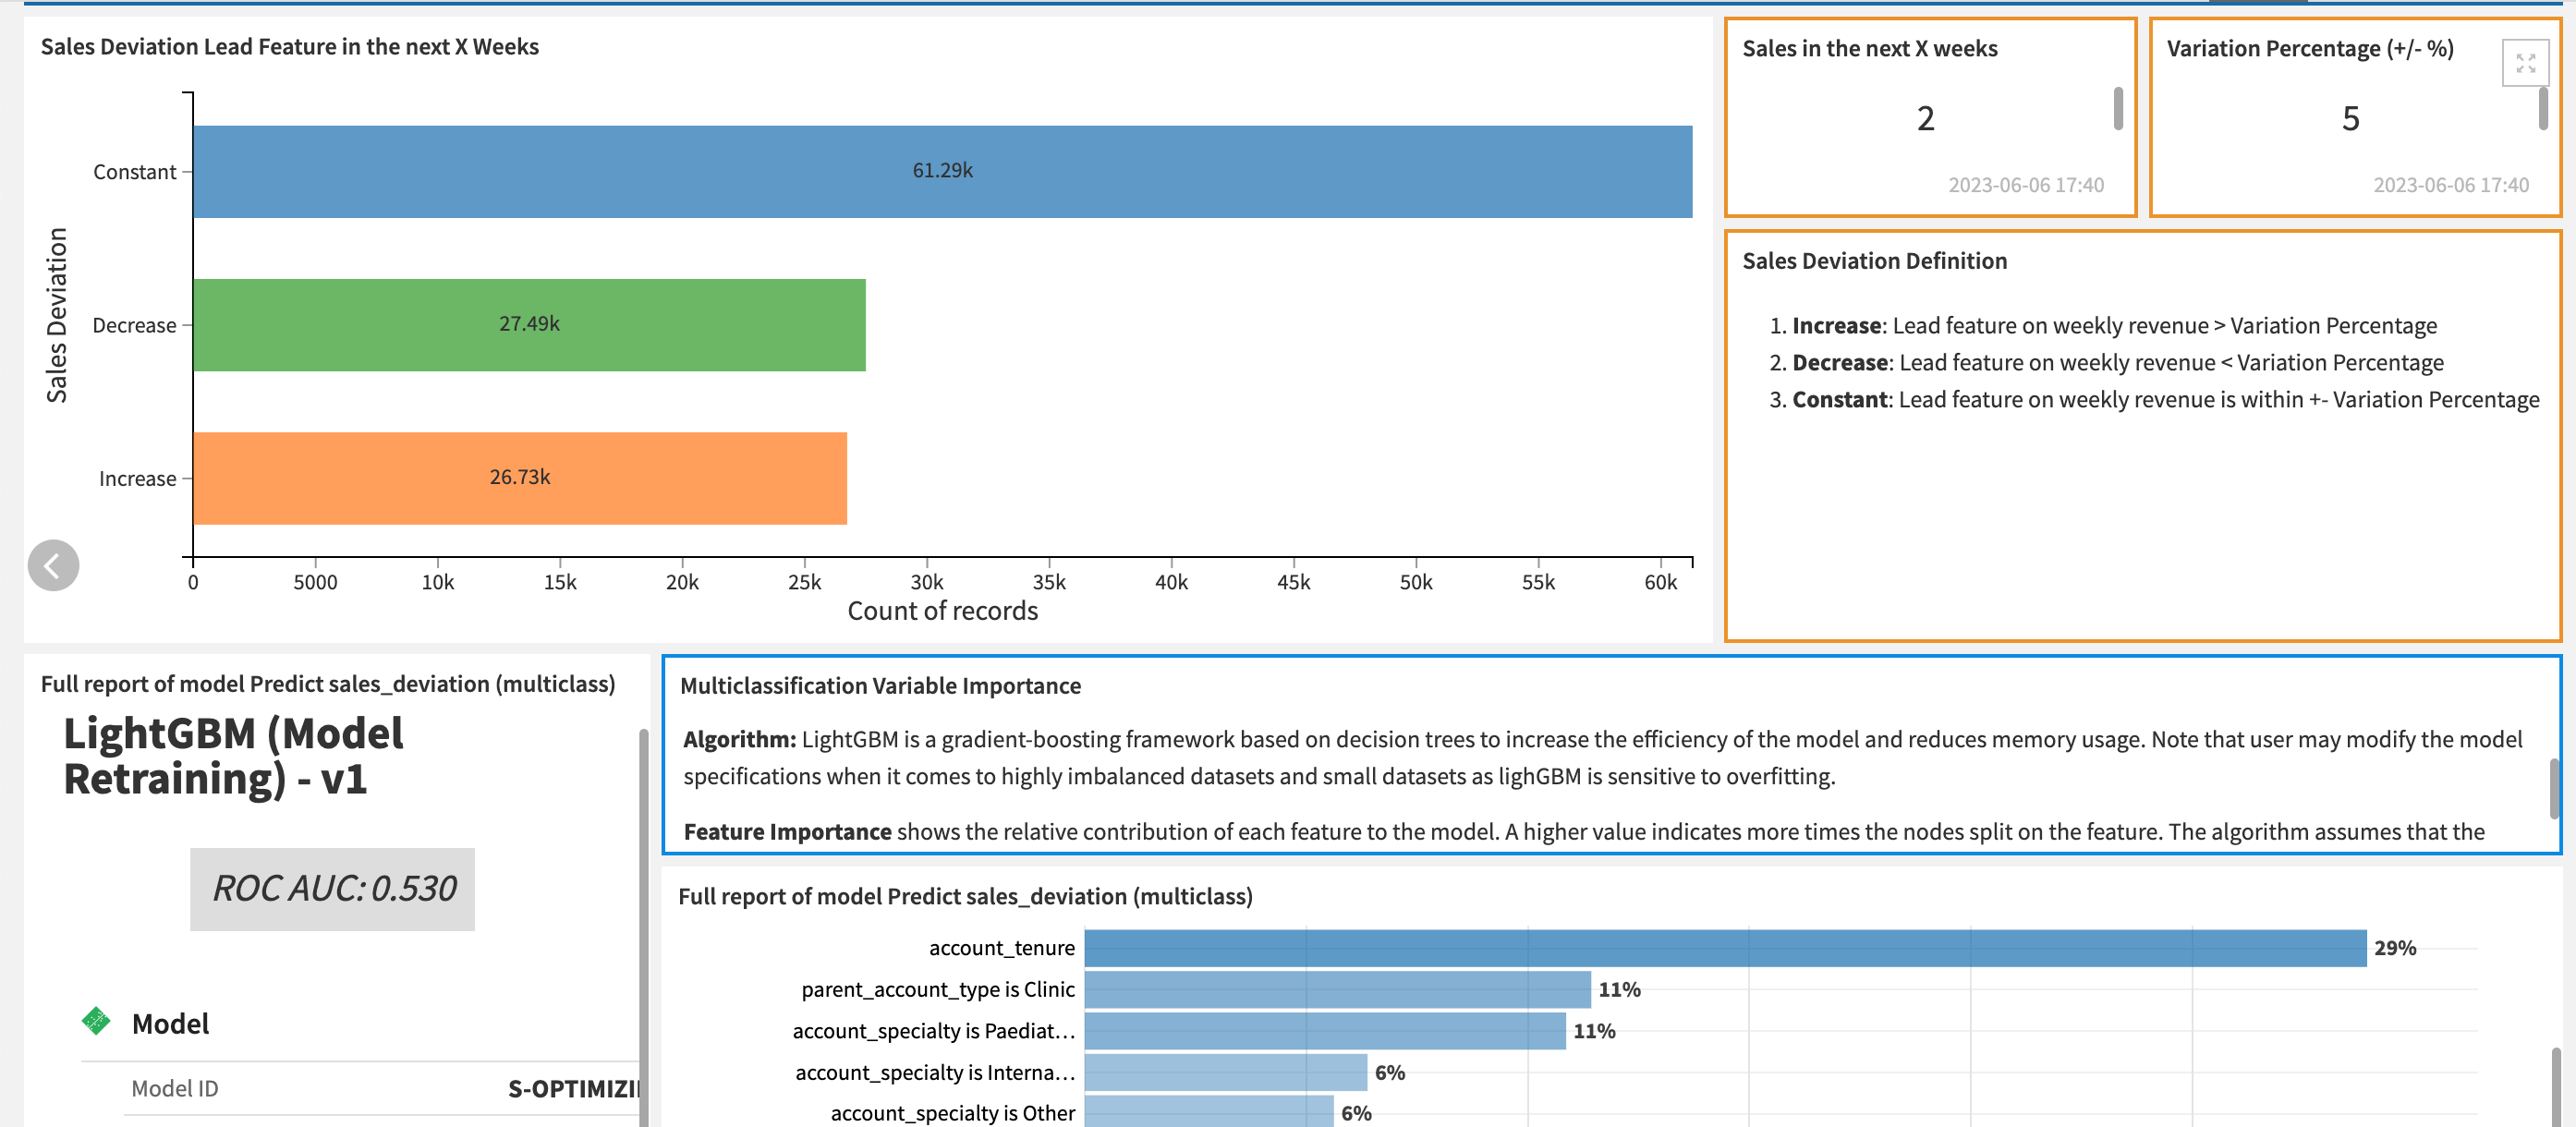
To understand the relationship between marketing outreach and sales, you need to look at the change in sales after a given behavior occurs. This means you can only see the effect of a marketing campaign in a week on sales in the following X weeks.
Select the parameters below to filter and prepare the data for predicting sales deviation (increase, decrease, or constant) if the change in sales is within a user-defined threshold. Select the numerical and categorical features for the machine learning multi-classification analytics session.
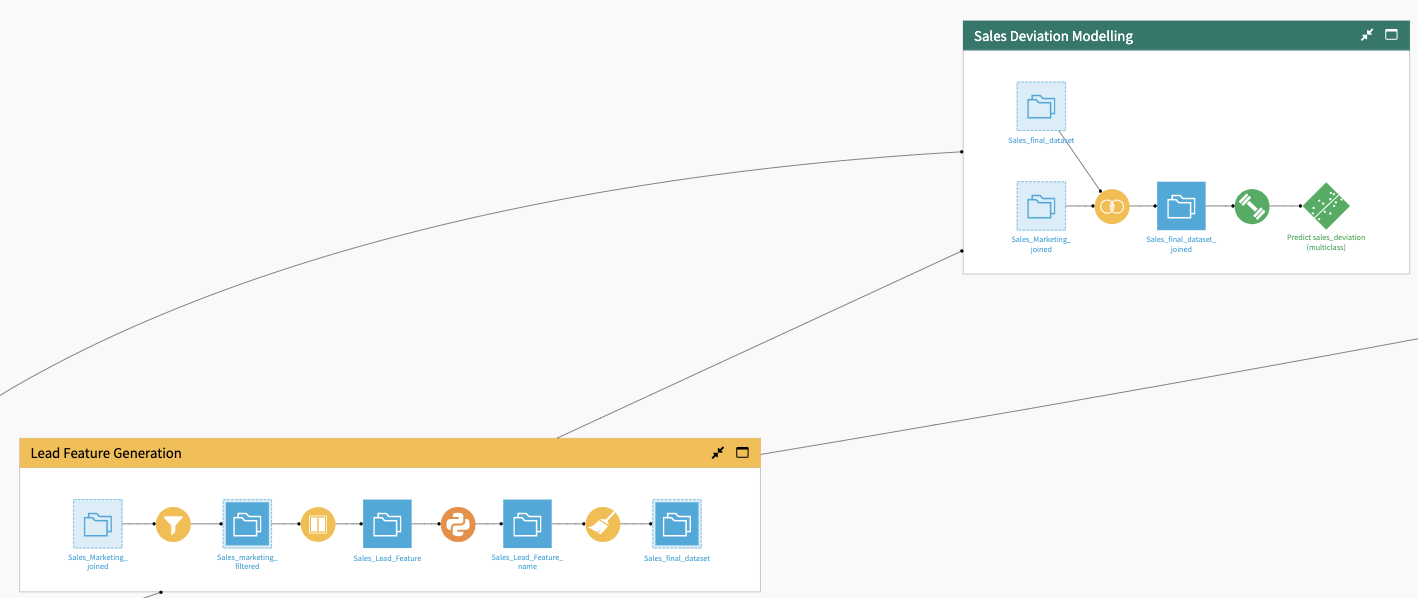
To explore the generated datasets and processes, switch to the Project View below or go straight to the visual dashboard.
The Lead Feature Generation Zone filters the data to the user-selected brand. The Window recipe groups sales by account_id and product_id for each week and calculates the difference in sales in X weeks. The Prepare recipe generates the target column sales_deviation by comparing the current and future sales within the user’s threshold.
If the difference is within the boundaries of sales_deviation_upper_filter and sales_deviation_lower_filter, the record is labeled as constant. Otherwise, its labeled as increase or decrease accordingly. The Sales Deviation Modeling Zone joins the provider’s characteristics to the aggregated sales and channel dataset and trains a multi-classification model.
Classify and target HCP accounts likely to adopt a new brand#
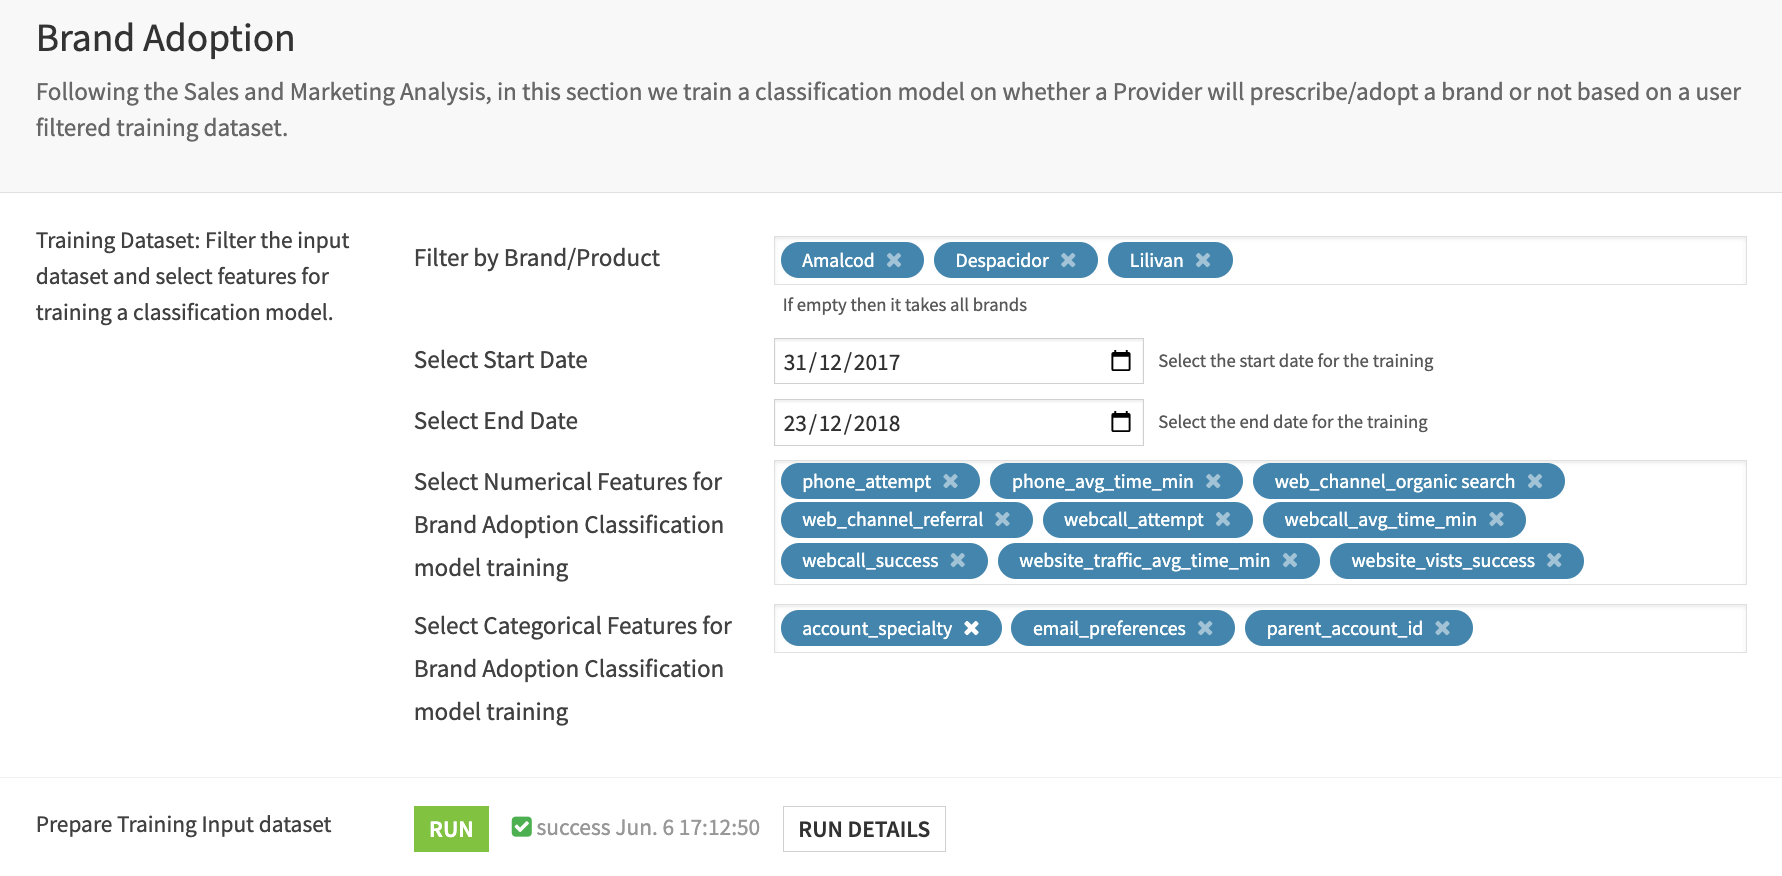
Following the Sales and Marketing Analysis, this section uses the transaction data to generate a binary brand_adoption feature on whether an HCP provider has adopted (purchased/prescribed) a product before or not and form a classification problem.
Select the multiple or a single brand and a period filter for the input training dataset. Moreover, numerical and categorical input feature selection is flexible from the input omnichannel and provider characteristics datasets.
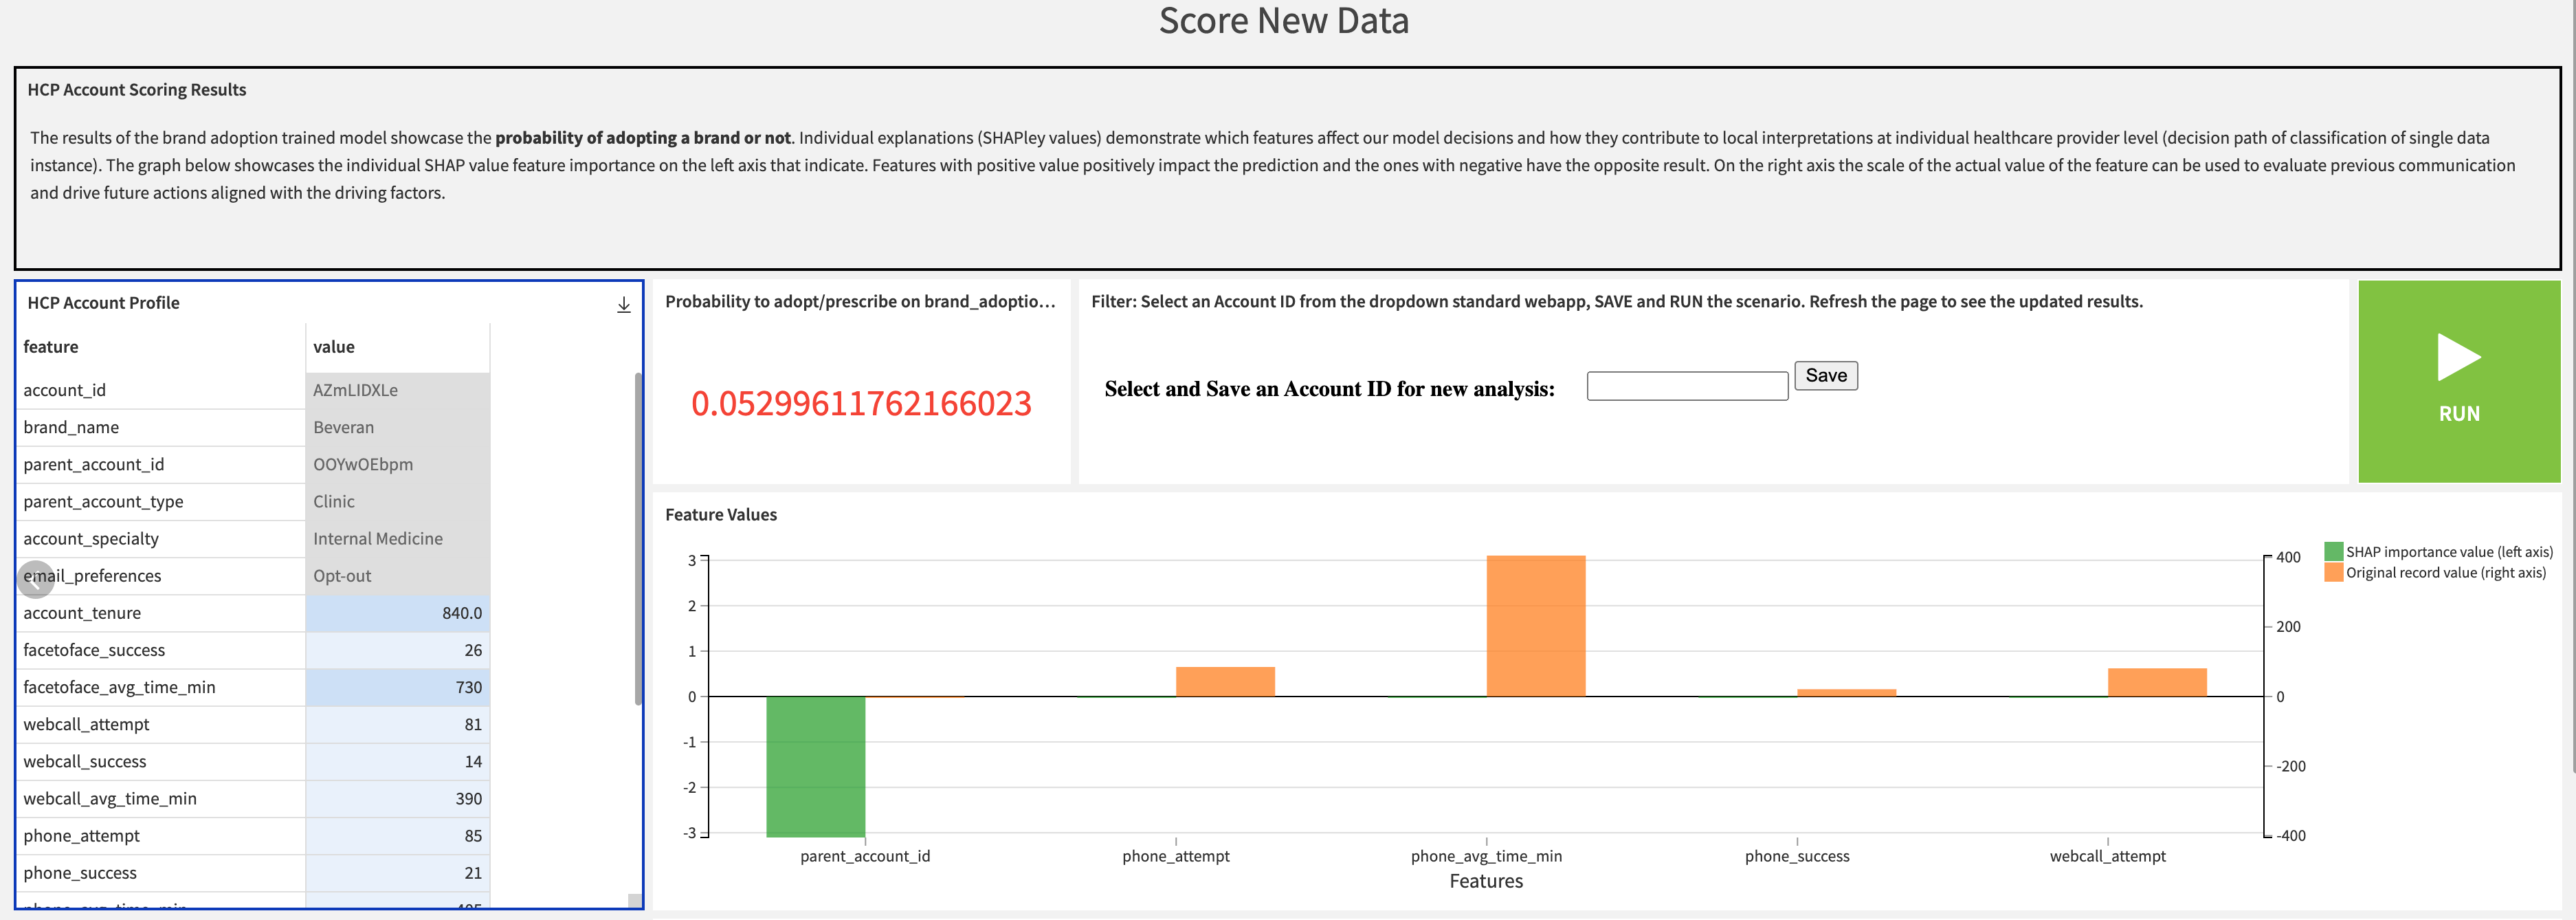
The Solution trains a machine learning algorithm for those features and enable users to score new data with the same features. (Check that the data to score includes all the selected features). It further extracts feature importance and individual feature values for each account ID. This can explain which factors impact (positively or negatively) the probability of adoption through visual displays in the Brand Adoption Dashboard.
Recipes in Total Sales and Marketing by HCP (Account ID) Flow Zone filter and Group the channel data by individual HCP (account_id). The Brand Adoption Modeling Flow Zone computes the target column brand_adopted on whether the aggregated feature product_quantity_weekly from overall transactions is positive or zero. The machine learning session trains a classification model using XGBoost algorithms and scores new user input data.
Responsible AI considerations#
This project makes use of marketing data and personal information related to HCPs. While the sample datasets don’t contain personal information (such as age, gender, or race) related to an HCP to drive analysis, real-world data may include these features. Accordingly, you should treat it with certain considerations across three areas: data, model, and reporting.
Data Check or Model Robustness: If the underlying data about HCPs includes sensitive attributes such as age, race, or gender, we recommend that users measure any potential biases in how marketing and engagement are conducted. For instance, statistics tests, such as a chi-square test or tests for normality, can help confirm whether any meaningful skew exists in the data, such as people over a certain age preferring different types of media (that is, print vs media). If such a skew or bias exists in the data, it should be noted and handled with preprocessing or in-processing techniques. Additionally, if users wish to avoid using the sensitive features in the downstream analysis, they should check for potential proxies using correlation tests and proxy models.
Reporting: Regarding reporting on the models developed in this project, the dashboard already provides several insights and feature explanations for individual predictions. These tools are important to build so that end users can make decisions with the full context in mind and understand how the model generates a given prediction.
Reproducing these processes with minimal effort for other brands and products#
This project equips marketing teams to understand how they can use Dataiku to assess their omnichannel marketing strategies’ past and future success. This may be by starting a new project from scratch or adapting this existing project to their specific needs.
You can find a deeper technical walkthrough of the project within the wiki to aid in reproducing this project.
This documentation has provided several suggestions on how to derive value from this Solution. Ultimately however, the “best” approach will depend on your specific needs and data. If you’re interested in adapting this project to the specific goals and needs of your organization, Dataiku offers roll-out and customization services on demand.


