
Solution | Leveraging Compute Resource Usage Data#
Overview#
This article will guide you through a Solution that will help you keep track of the resource consumption of your Dataiku platform.
Introduction to resource consumption#
Initially, you may use Dataiku as a standalone application that will handle the data storage, computing, and training of models. However, as your objectives grow, you will want to integrate the platform into a wider ecosystem.
At first, you will typically leverage external data sources (such as remote file storage, relational databases, data warehouses, etc).
Soon, you will start having more and more computation to do, requesting more power. With the local DSS engine being inherently limited, you will need to leverage external computation technologies. The main, and foremost, one that Dataiku uses is Spark on Kubernetes, also known as Elastic AI.
Additionally, to segregate teams and have dedicated UAT or production servers, you will deploy several Dataiku instances.
This strategy characterizes the path to success with Dataiku. However, it comes at a cost. Monitoring the resources used by your Dataiku instances is a critical topic, especially when the number of projects and users is growing.
Dataiku has an embedded capability to keep track of all resource requests called Compute Resource Usage (or CRU). Compute resource usage reporting logs enable the monitoring of the resource down to the project and job level.
See also
To get familiar with this, read the reference documentation on Compute resource usage reporting.
Caution
This Solution isn’t available on Dataiku Cloud. Although you may try to create the project using the instructions below, Dataiku offers no support in this case. Dataiku Cloud users interested in resource consumption should refer to Compute and Resource Quotas on Dataiku Cloud in the Knowledge Base.
Installation#
From the Design homepage of a Dataiku instance connected to the internet, click + Dataiku Solutions.
Search for and select Dataiku Resource Usage Monitoring.
If needed, change the folder into which the Solution will be installed, and click Install.
Follow the modal to either install the technical prerequisites below or request an admin to do it for you.
Note
Alternatively, download the Solution’s .zip project file, and import it to your Dataiku instance as a new project.
Technical requirements#
To use this Solution, you must meet the following requirements:
Have access to a Dataiku 14.2+ instance.
Workflow overview#
This project has the goal to help you leverage the compute resource usage logs to understand which user or project is consuming the most resources. Once you’ve completed this walkthrough, you should have enough knowledge to venture into this Solution yourself and replicate it without making any changes.
The project answers multiple needs with a focus on three main ones:
Need |
Purpose |
|---|---|
Reliability of Services/ Capacity Planning |
Understanding what project/user/activity consumes resources during peak RAM/CPU usage. The goal is to optimize the computation to deploy the platform on the right machine (CPU/RAM) or with the right sizing of Kubernetes clusters. |
Cost Reduction (Finops)/ Green AI |
Analyzing the duration of computations and the RAM consumption over time to monitor costs, whether financial or environmental. |
Investigate usage patterns |
Performing usage pattern and peak usage investigation. |
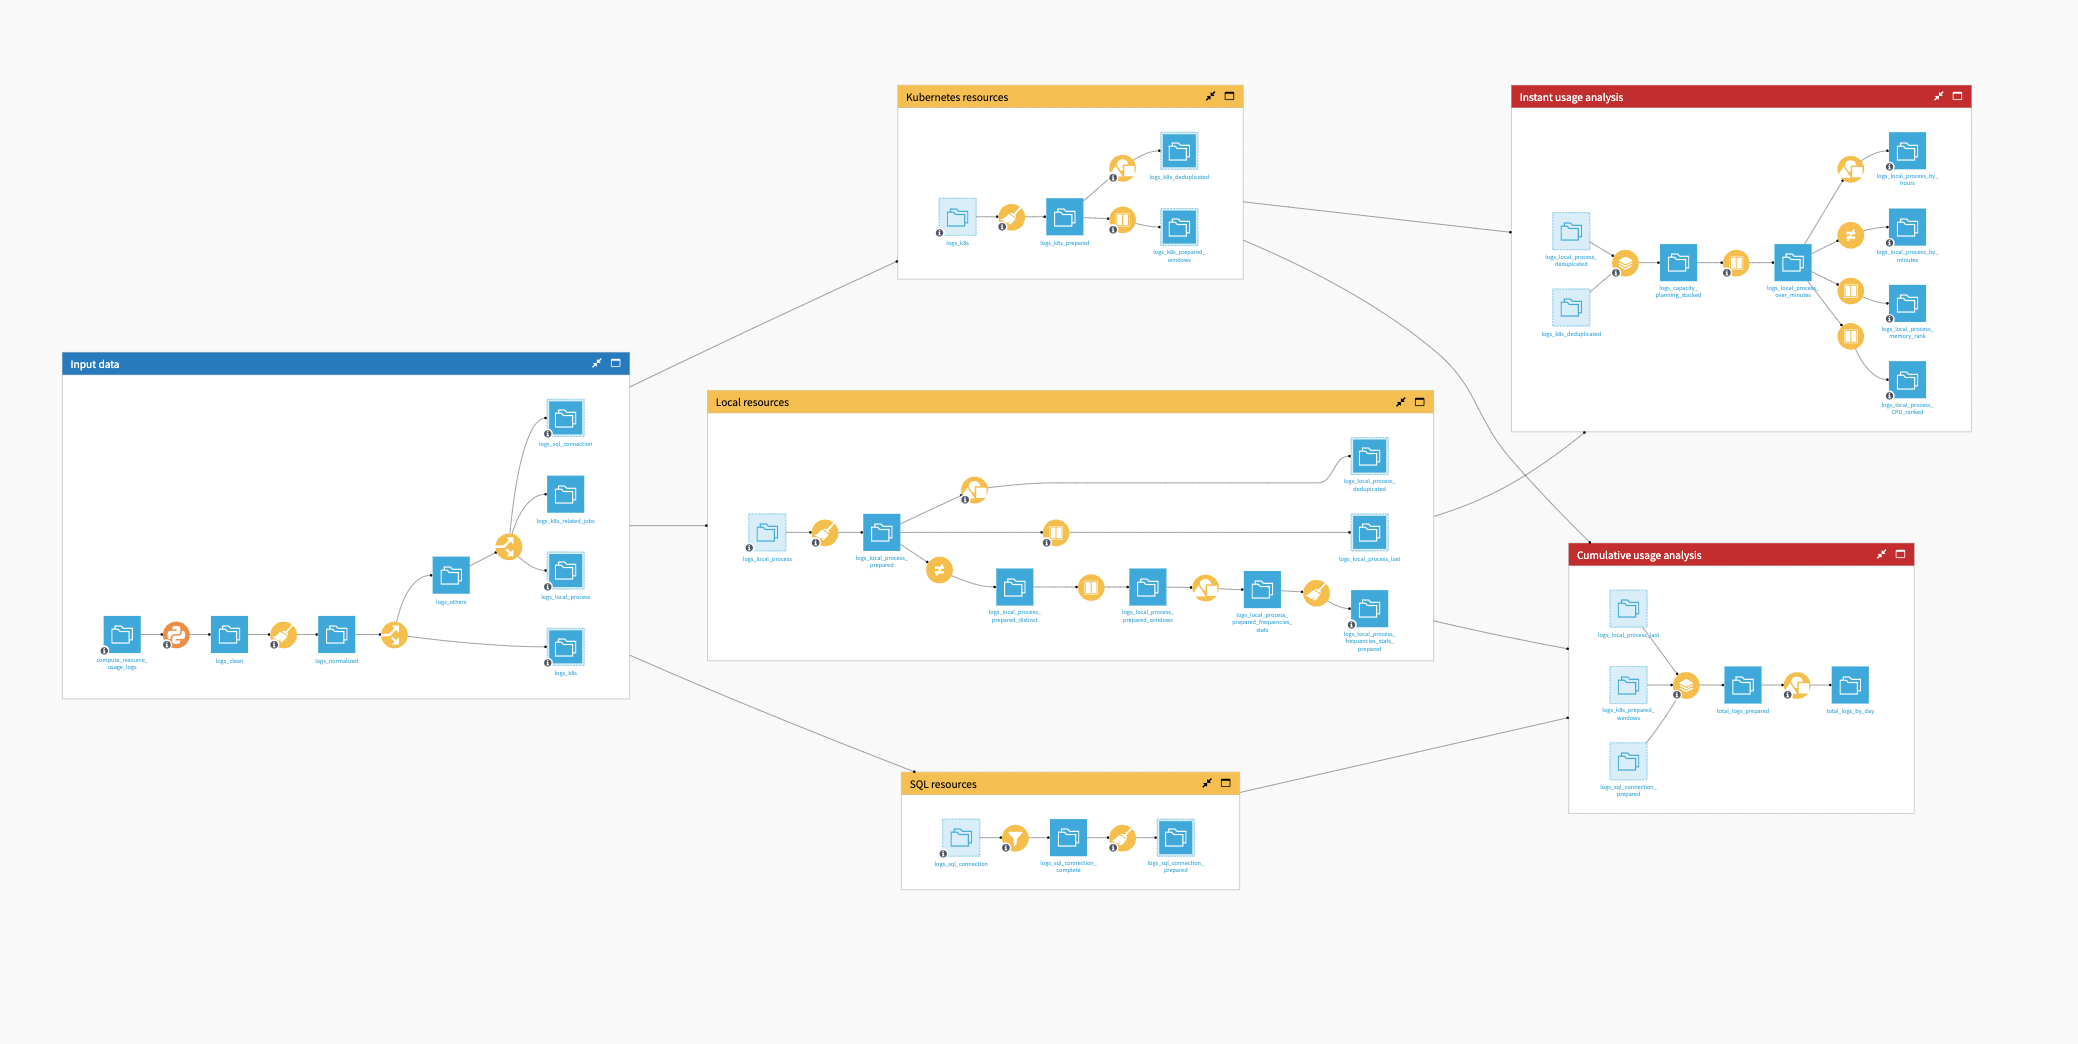
As a plug and play Solution, the user needs to connect their compute_resource_usage_logs that either come from an Event Server or directly from the audit logs of their instance. After some data preparation, three datasets, defining the main categories, will be worked on in their respective workflows: Local resources, SQL Resources, and Kubernetes Resources.
Afterword, they’re stacked into one dataset to analyze the Cumulative Usage over the total time of the processes. One last Flow zone, Instant Usage Analysis, analyzes the minute-by-minute logs.
This data preparation leads to dashboards for the user to better analyze which project/user is consuming resources, and on which infrastructure. Moreover, a Project Setup is also included in this Solution to help you connect your logs and build the dashboard.
CRU explained#
If you have read the reference documentation on Compute resource usage reporting, you know that CRU logs are natively gathered through the audit centralization mechanism, and stored in the audit logs that you can find in datadir/run/audit/.
Those logs monitor the CPU and memory usage of local and Kubernetes logs. For SQL computations, it provides the execution time (which might include waiting time). The minimal unit of time measure that you will see in this project is aggregation over minutes.
For each process, the Solution produces a trace:
Trace |
Initiates when: |
|---|---|
compute-resource-usage-start |
A process starts. |
compute-resource-usage-update |
Every minute over the duration of the process. |
compute-resource-usage-complete |
A process ends. |
The Solution sends CRU logs to the audit centralization mechanism. However, it’s recommended to install The DSS Event Server and configure your auditing target’s destination to point to your Event Server (Administration > Settings > Auditing).
It comes with several benefits:
Keeps the history of the logs (the default audit directory is cleared).
You can monitor all your nodes with the same Event Server and group the analysis into the same dashboard.
The Event Server allows dispatching the logs in different folders according to their topics and date. It will help load fewer data into the Flow and partition your datasets.
Finally, to monitor the Kubernetes processes, you’ll need to enable periodic reporting in your settings. Then, the platform will periodically (every minute) query each Kubernetes cluster for a list of pods and the current resource consumption of each pod. It will emit a dedicated CRU message containing the list of pods with their current resource consumption.
Walkthrough#
Now that this is clear, dive deeper into the Flow.
Input data#
In the Input Data zone, the first Python recipe makes sure that whatever the origin of the CRU logs, they share the same schema and only keep CRU-related rows. It’s not mandatory or complex, but a practical step.
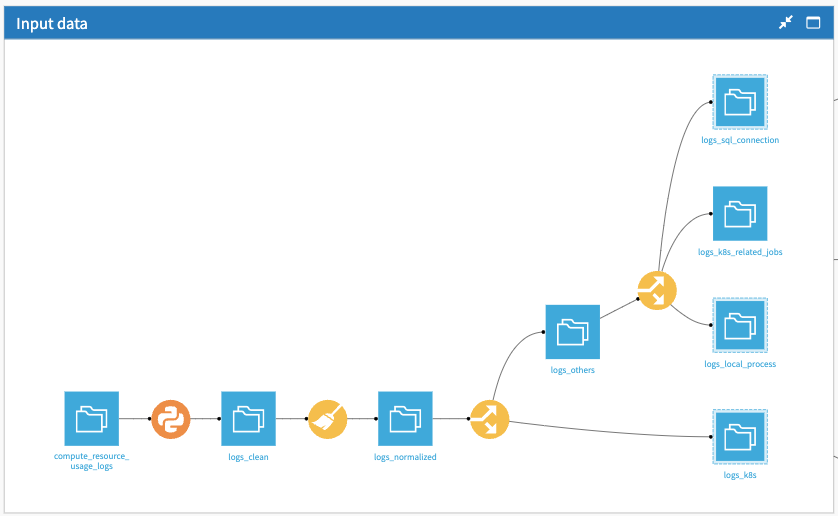
The next recipe is a normalized recipe used to clean the data and pre-compute the date at day, hour, and minute levels. It’s done early in the Flow so that you have the possibility to use SQL engines later on.
The Split recipe splits the other rows and pushes them into three main categories:
One for all SQL processing (logs_sql_connection)
One for local processing (logs_local_process)
One for the local Kubernetes processing (logs_k8s)
In the end, there is nothing complex here—mostly data splitting.
One thing to note is that some rows from the original CRU data are dropped and never used. This is normal and concerns the start and finishing of Kubernetes task reports that are of no use.
Kubernetes, SQL, and local resources#
Each of those categories will have a specific format of logs and, therefore, specific data preparation in their dedicated Flow zones. Each one is described below.

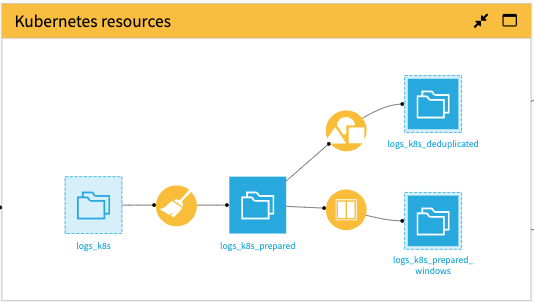
Regarding the Kubernetes Resources, most of the work is done in the Prepare recipe, which is organized into two groups of operations: Instant Usage of Resources and Cumulative Usage of Resources.
The Group recipe aggregates each pod resource used by minute and by process, whereas the Window recipe is used to take the latest log trace related to a process.
See also
If you are further interested in Kubernetes metrics and their usage, see the great blog entry from Datadog Collecting Metrics With Built-in Kubernetes Monitoring Tools.
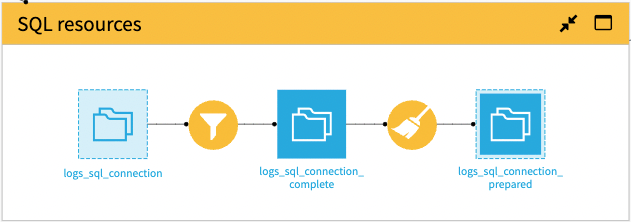
The goal of the SQL Resources zone is to measure the execution time for all SQL processes. A Sample/Filter recipe is applied to get the completed processes. Then, a Compute Recipe is added to get the execution time.
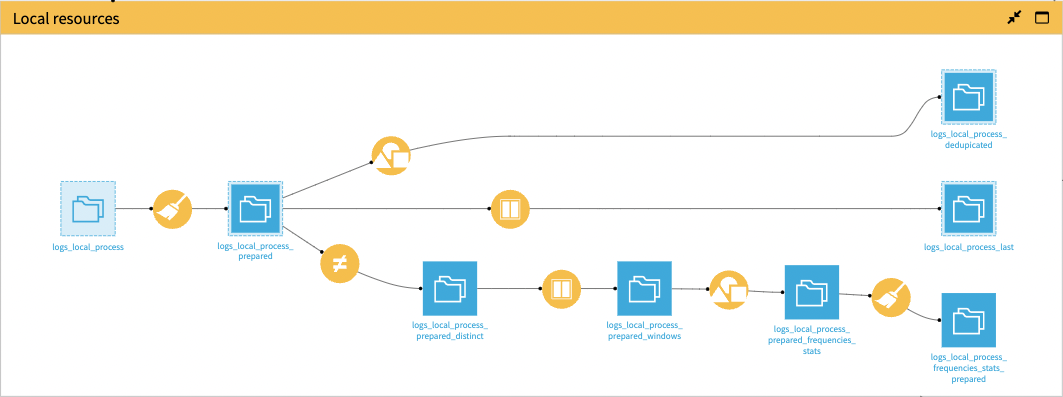
The Local Resources zone is similar to the Kubernetes zone, as it also mostly relies on some cleanup and computation done in the Prepare recipe.
The Group recipe makes sure to keep only one row per process per minute with the maximum resource usage for the minute-by-minute calculation.
The Window recipe takes the latest log trace related to a process. It’s more efficient than filtering on “complete” jobs because it also monitors aborted jobs that don’t have a “complete” trace.
Lastly, the Solution computes the intervals between two consecutive identical jobs to monitor process frequencies on the thread leading to logs_local_process_frequencies_stats_prepared.
Instant and cumulative usage analysis#
The Instant Usage Analysis and Cumulative Usage Analysis Flow zones fuel two tabs of the dashboard.
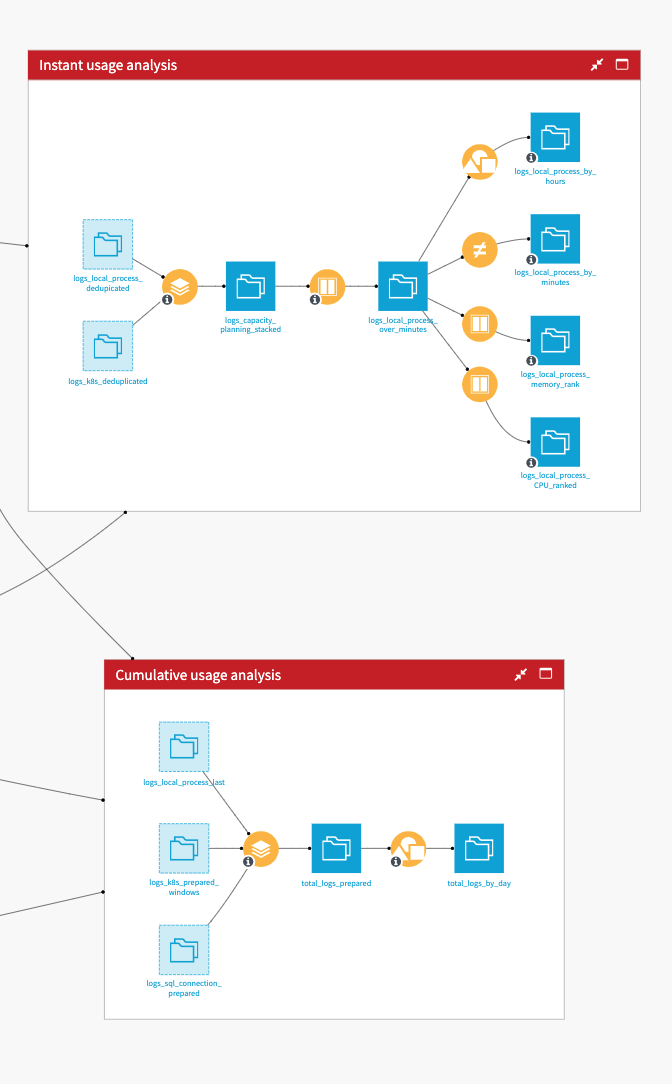
The Instant Usage Analysis zone gathers the analysis regarding the minute-by-minute logs. This Flow zone gas four datasets: Logs by day & hours, Logs by minute, Logs Top Memory usage, and Logs Top CPU usage. They allow the visualizations in the Instant Usage Analysis tab of the dashboard to help with capacity planning.
The Cumulative Usage Analysis zone stacks the local, Kubernetes, and SQL processes into one dataset to analyze the cumulative resource usage over the total time of the processes. This analysis helps with resource optimization and diminishing financial costs and/or C02 impact.
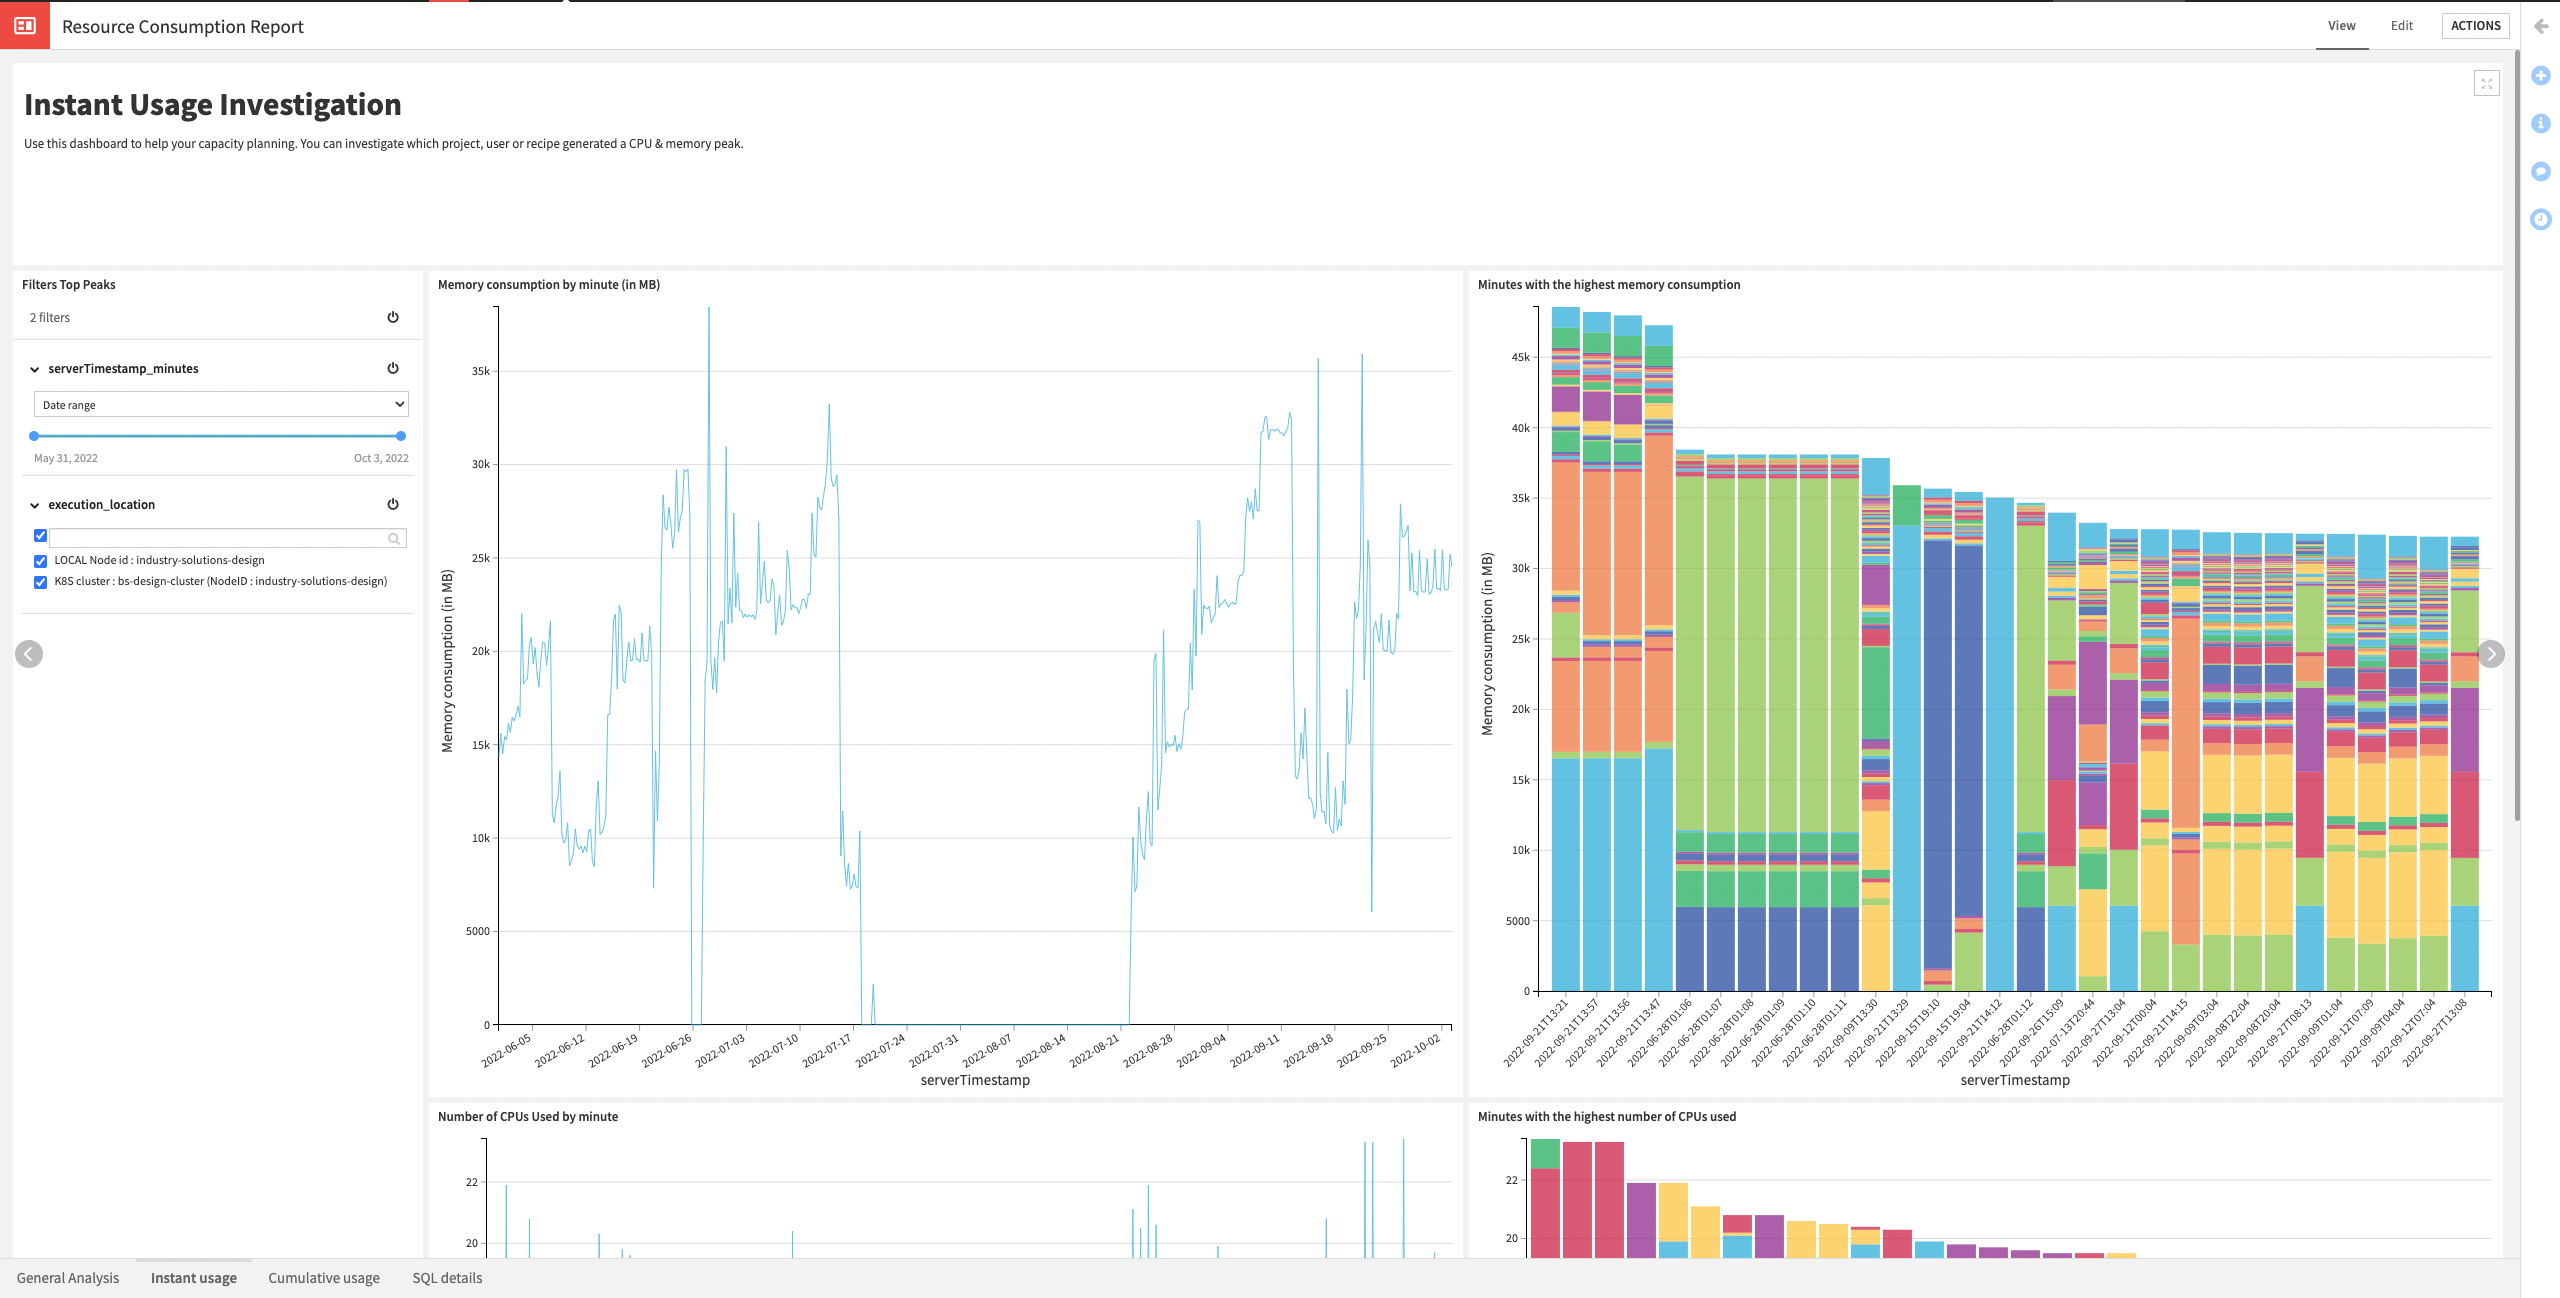
Consumption report#
The Solution has a Resource Consumption Report dashboard, which helps analyze which project/user is consuming resources, and on which infrastructure.
The dashboard has four tabs:
Tab |
Description |
|---|---|
General Analysis |
Has a general overview of your consumption with metrics, distribution of resources consumption, and most frequent jobs. |
Instant Usage Investigation |
Helps analyze your capacity planning. You can investigate which project, user, or recipe generated a CPU & memory peak. Thanks to the filter section, the user can truly understand the usage compared to date, execution location, project key, and user ID by filtering them in and out. |
Cumulative resource usage over time |
Focuses on analyzing which jobs consume the most resource over time, spot projects that should be optimized, and diminish your CO2 impact or financial cost. |
SQL Details |
Is a more specific dashboard that analyzes the SQL execution time from all your projects. It displays the daily SQL execution time per project and the distribution of the execution over the available SQL connections. |
Dashboard filters are available on each tab to re-generate the charts on a specific subset of data (that is, by user, on a certain date range, execution type, etc.).
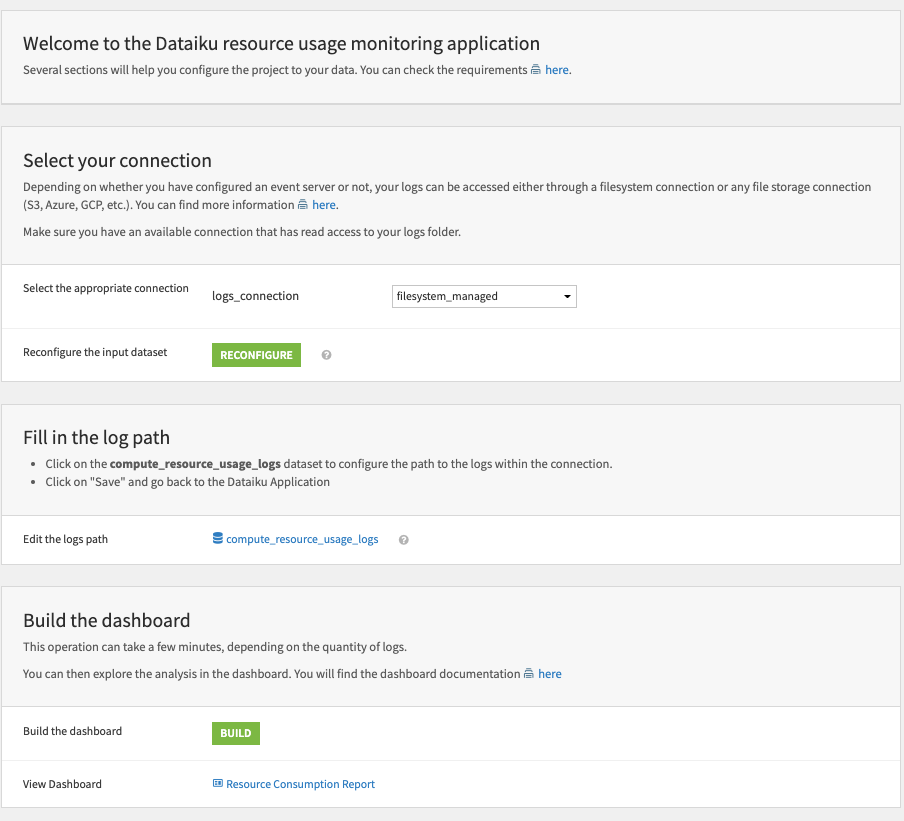
Build your own dashboard#
The Solution’s Project Setup allows you to build your own dashboard in a few clicks by connecting your logs folder.
Select your connection leading to the location of the logs. Reconfigure the connections in the Flow to match the ones selected. Configure their path within the connection. Finally, build your Resource Consumption Report dashboard.
Next steps#
As a next step, you might want to use this Solution to run some daily usage monitoring. If you wish to do so, you’ll need to do some modifications to the project to improve its performance.
Activate the time trigger on the Build scenario. The Build scenario rebuilds the Flow when you want to run an analysis. A user needs to trigger it to run the visualizations with the latest logs.
Change all the database connections to an SQL one (except for the input dataset).
Change the execution engine to an SQL engine for all compatible recipes.
Consider partitioning your dataset per day to make sure only the last slice of data is computed each day.
In a FinOps approach, the ideal scenario is to discuss with other stakeholders (business, projects, IT, finance, etc.) to review which information they need, and progressively enrich the dashboards.