
Solution | Manufacturing Process Control#
Overview#
Optimizing manufacturing processes for quality, yield, or efficiency requires the validation of new parameter settings, typically using Statistical Process Control (SPC) methods. The Manufacturing Process Control Solution enables Process and Quality Engineers to do exactly this in a no-code Dataiku app. Users can automatically generate control charts to assess process stability and calculate key capability indices (Cp, Cpk, Cpm, Cpkm) to verify that parameters will remain within specification limits and meet quality requirements.
Business case#
Manufacturers rely on SPC to ensure process changes lead to stable and predictable outcomes. However, this often requires switching to specialized SPC software, creating a disjointed workflow that slows down validation.
Because Dataiku is well-suited for preparing and cleaning manufacturing data, doing SPC within the platform allows for an efficient experience.
The Manufacturing Process Control Solution provides this by embedding SPC directly into the Dataiku platform. It allows teams to:
Generate control charts directly from prepped data
Automate capability reporting with key indices like Cp and Cpk
Eliminate context switching between data prep and SPC analysis tools
With this Solution, teams can reduce the time spent validating process changes and more confidently translate new parameter settings into measurable improvements in quality, yield, and efficiency.
Installation#
From the Design homepage of a Dataiku instance connected to the internet, click + Dataiku Solutions.
Search for and select Manufacturing Process Control.
If needed, change the folder into which the Solution will be installed, and click Install.
Follow the modal to either install the technical prerequisites below or request an admin to do it for you.
Note
Alternatively, download the Solution’s .zip project file, and import it to your Dataiku instance as a new project.
Technical requirements#
To use this Solution, you must meet the following requirement:
Have access to a Dataiku 14.1+* instance.
No dedicated code environment required.
Data requirements#
The Solution requires a single dataset: the experiment dataset. It contains process measurements collected during a configured run, such as an experimental process executed with new parameter set points. While any numerical data can be used, it’s recommended that the dataset covers a sufficient time span to enable meaningful control chart and capability analysis.
Experiment dataset (mandatory)#
This dataset must include:
Date column (date/time): used for chronological ordering of process measurements.
One or more variables to analyze (float/integer): the process parameters to be monitored with SPC charts.
Example schema:
date_time |
T_data_1 |
T_data_2 |
quality |
|---|---|---|---|
2025-01-01 08:00:00 |
475.0 |
12.3 |
421 |
2025-01-01 09:00:00 |
482.1 |
11.8 |
432 |
2025-01-01 10:00:00 |
478.5 |
12.0 |
426 |
Important
The dataset must contain at least one parsed datetime column.
Any number of process variables can be included and later selected in the application.
Support for categorical values is planned in a future version.
Workflow overview#
You can follow along with the Solution in the Dataiku gallery.
The project has the following high-level steps:
Connect your process data.
Configure parameters.
Generate SPC charts.
Walkthrough#
Note
In addition to reading this document, it’s recommended to read the wiki of the project before beginning to get a deeper technical understanding of how this Solution was created and more detailed explanations of Solution-specific vocabulary.
Dataiku app configuration#
The Solution is delivered as a Dataiku app, allowing users to configure and run analyses without coding. Key steps include:
- Connect your data
Upload CSV files or connect to an existing dataset in a Dataiku project.
Optionally, import specification limits and targets from a saved Parameters Analyzer study.
- Configure parameters
Select the date column and the variables to analyze.
Select the control chart type: I-MR, X̅-R, X̅-S.
Define subgroup size, optional specification limits and target values.
- Generate SPC outputs
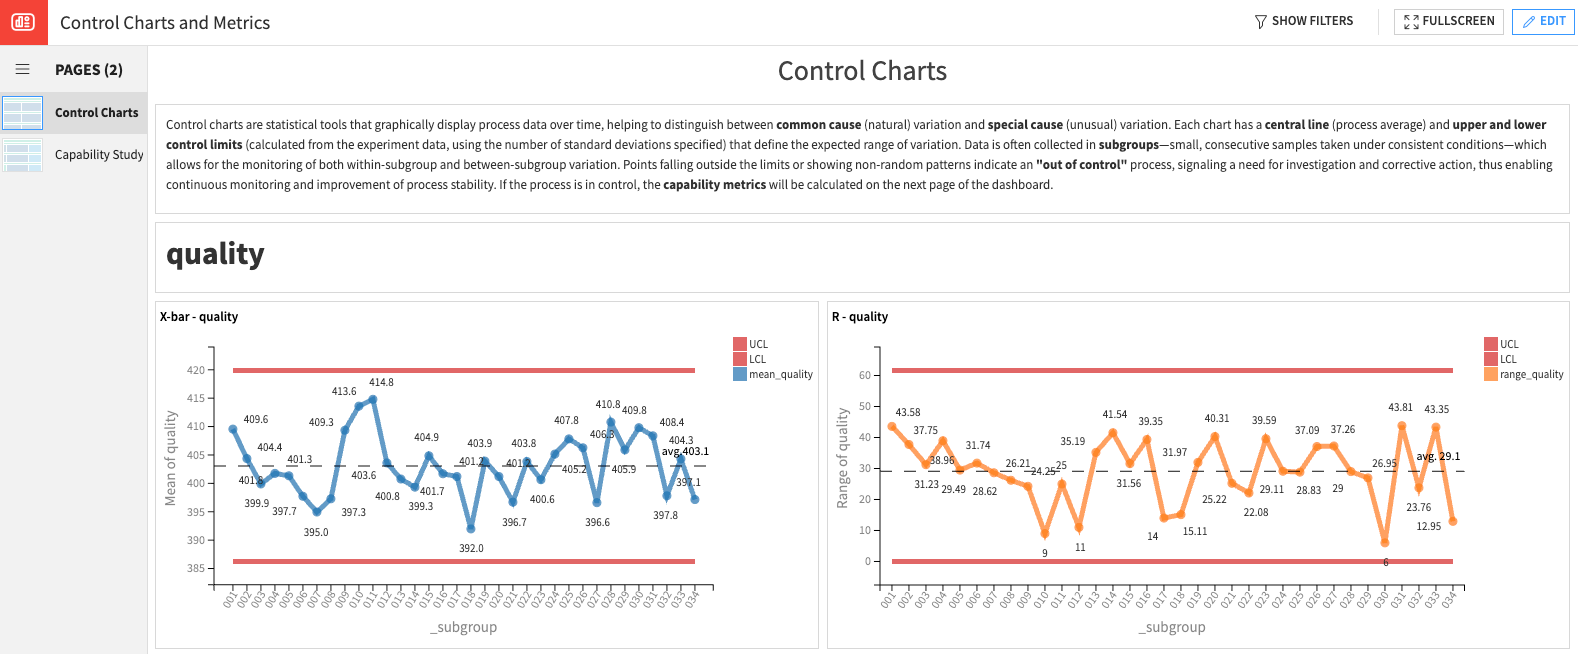
The Solution produces control charts to assess process stability.
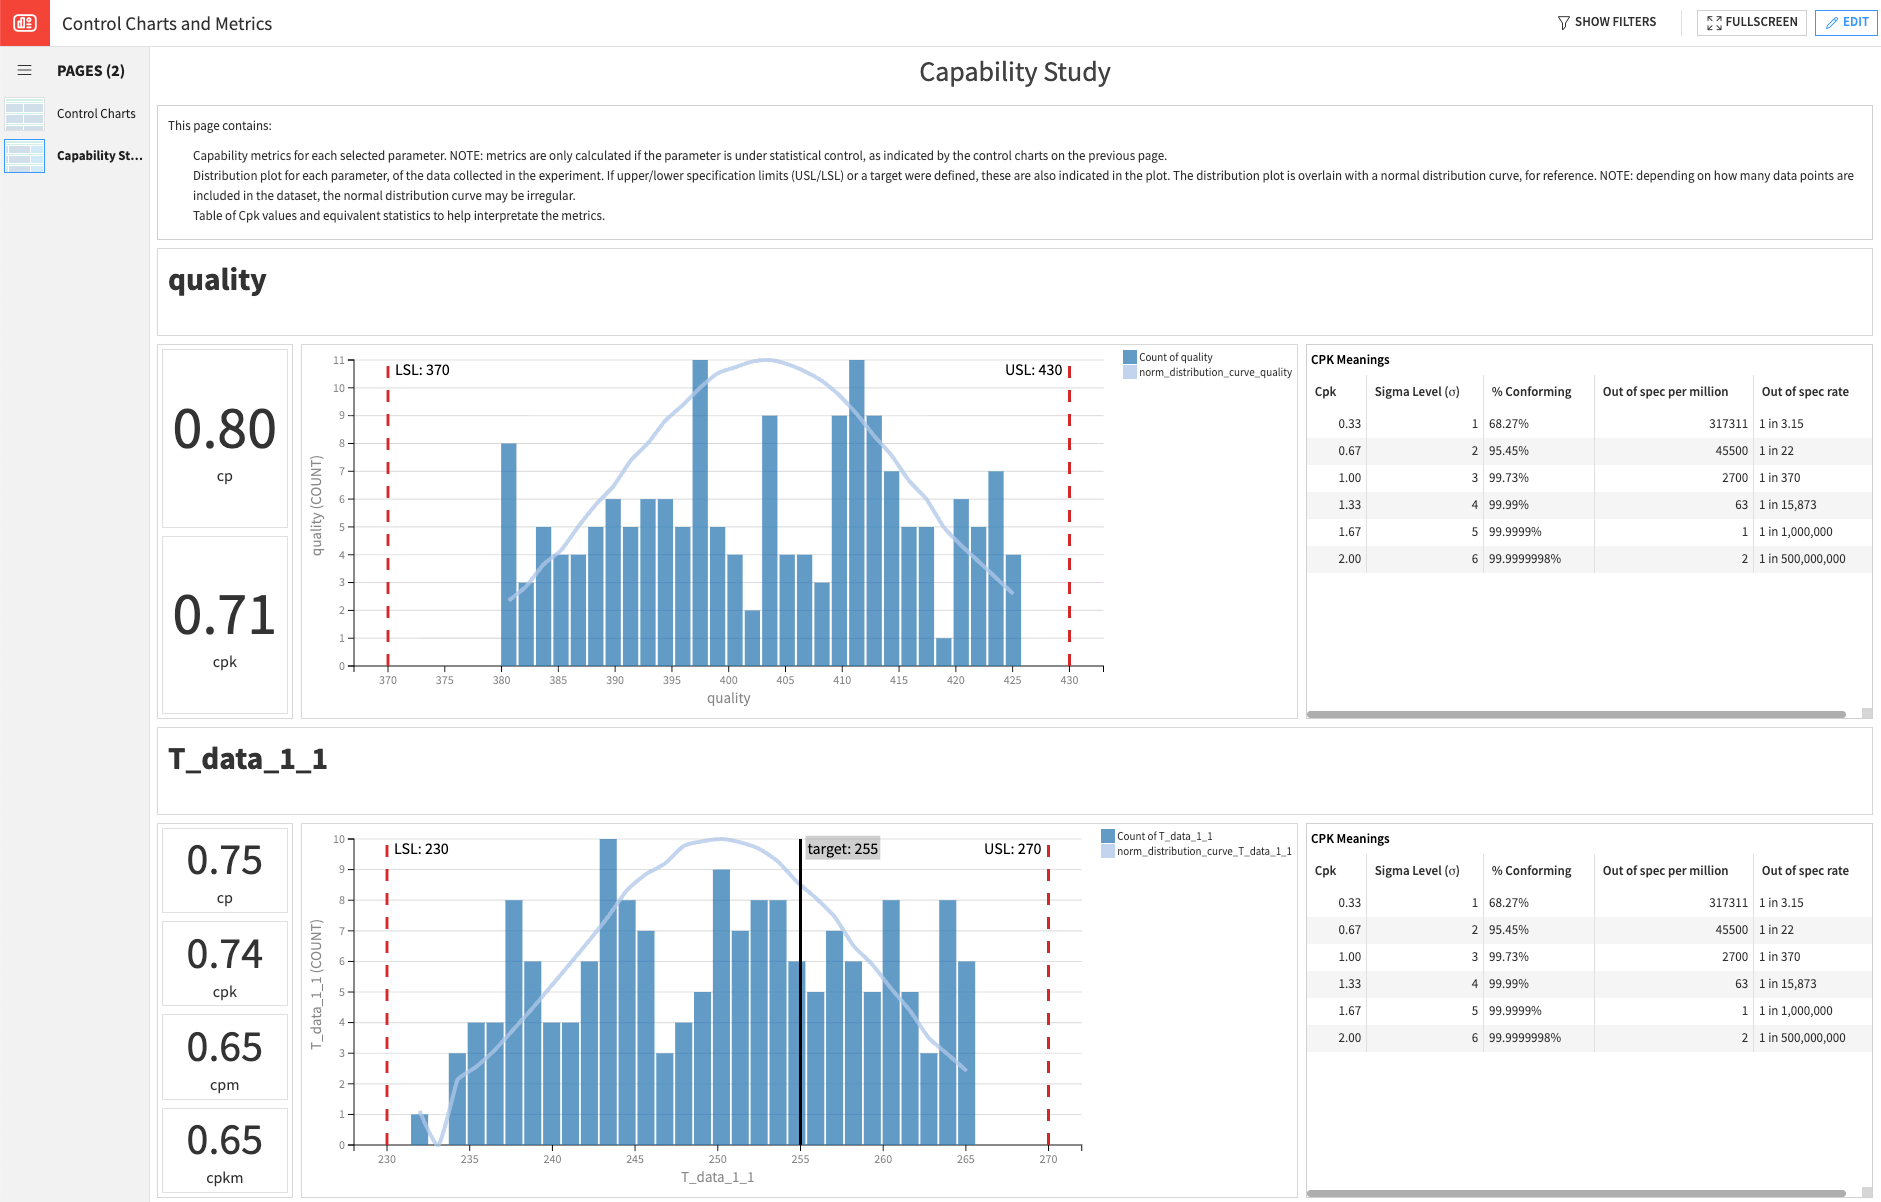
For statistically “in control” processes, capability metrics (Cp, Cpk, Cpm, Cpkm) are automatically calculated.
A dashboard consolidates results into intuitive charts, histograms, and a Cpk interpretation table.
Specification limits (optional)#
When running the analysis, you can also provide:
LSL (Lower Specification Limit)
USL (Upper Specification Limit)
Target value (for example set point, required for Cpm and Cpkm metrics)
If you don’t define any limits, control charts will still be generated, but capability metrics will not be calculated.
Parameters Analyzer connection (optional)#
If connected to the Parameters Analyzer Solution, a saved study can automatically pre-configure the Manufacturing Process Control Solution by importing the following information:
The date variable defined in the study.
The selected variables to analyze.
The specification limits (LSL, USL) and target values.
Note
The column names in the experiment dataset must match those defined in the Parameters Analyzer saved study. Otherwise, pre-configuration will fail.
Outputs#
The first dashboard contains control charts for the user’s selected parameters.
The second dashboard contains capability metrics and a distribution plot for each parameter from the experiment’s collected data. If USL, LSL or a target were defined, these are also indicated in the plot. A normal distribution curve is overlaid on the plot for reference. Below, a table of Cpk values and equivalent statistics helps you interpret the metrics. This dashboard shows capability metrics for parameters that were determined to be under statistical control.
Reproducing these processes with minimal effort for your data#
This project equips process and quality engineers to understand how Dataiku can be used to generate control charts to assess process stability and calculate key capability indices (Cp, Cpk, Cpm, Cpkm). By creating a singular Solution that can benefit and influence the decisions of a variety of teams in a single organization or across multiple organizations, it accelerates the validation cycle for process improvements, ensuring that theoretical gains translate into tangible, reliable outcomes on the factory floor.
This documentation has provided several suggestions on how to derive value from this Solution. Ultimately however, the “best” approach will depend on your specific needs and data. If you’re interested in adapting this project to the specific goals and needs of your organization, Dataiku offers roll-out and customization services on demand.